A MODIFIED APPROACH FOR CHANGE DETECTION USING CHANGE VECTOR
ANALYSIS IN POSTERIOR PROBABILITY SPACE
S. A. Azzouzia,b,∗, A. Vidala, H. A. Bentounesb a
Instituto de Telecomunicaciones y Aplicaciones Multimedia (iTEAM), Universitat Polit`ecnica de Val`encia, Valencia, Spain - [email protected], [email protected]
b
Component, signal and systems laboratory, University Abdelhamid Ibn Badis of Mostaganem, Mostaganem, Algeria - [email protected]
KEY WORDS:Modified Change Vector Analysis Posterior probability Space (MCVAPS), Classification, Spatiotemporal change, Land Cover/Land Change, Landsat-TM data, Landsat-ETM data.
ABSTRACT:
The multispectral and multitemporal data coming from satellites allow us to extract valuable spatiotemporal change. Consequently, Earth surface change detection analysis has been used in the past to monitor land cover changes caused by different reasons. Several techniques have been used for that purpose and change vector analysis (CVA) has been frequently employed to carry out automatic spatiotemporal information extraction. This work describes a modified methodology based on Supervised Change Vector Analysis in Posterior probability Space (SCVAPS) with the final aim of obtaining a change detection map in Blida, Algeria. The proposed technique is a Modified version of Supervised Change Vector Analysis Posterior probability Space (MSCVAPS) and it is applied at the same region that the original technique studied in the literature. The classical Maximum Likelihood classifier is the selected method for supervised classification since it provides good properties in the posterior probability map. An improved method for threshold determination based on Double Flexible Pace Search (DFPS) is proposed in this work and it is employed to obtain the most adequate threshold value. Then, the MSCVAPS approach is evaluated by two cases study of the land cover change detection in the region of Blida, Algeria, and in the region of Shunyi District, Beijing, China, using a pair of Landsat Thematic Mapper images and pair of Landsat Enhanced Thematic Mapper images, respectively. The final evaluation is given by the overall accuracy of changed and unchanged pixels and the kappa coefficient. The results show that the modified approach gives excellent results using the same area of study that was selected in the literature.
1. INTRODUCTION
Advances in satellite image acquisition and new storage technolo-gies have led to a huge amount of information in the spatiotem-poral domain. These data can be used and analyzed to produce land cover detection and land cover change information. Change detection methods are based on processing spatiotemporal data in a convenient way in order to access the change information as de-scribed in (Armenakis et al., 2002), (Barnes et al., 2007), (Tang et al., 2007) and (Umamaheshwaran et al., 2007). The detection of possible differences that may occur over time is a key factor when analyzing the state of an area. These differences may be caused by several phenomena, that include human activity and natural causes, as described in (Nori et al., 2009) and (Singh, 1989).
The technique of Change Vector analysis (CVA) has been vastly used in the past decade for change detection in various studies such as (Bovolo and Bruzzone, 2007), (Malila, 1980) and (Xian. et al., 2009). Many change detection techniques were summa-rized by (Lu et al., 2004) as algebraic algorithm, advanced tech-niques, visual analysis and others. Each technique provided its own features and that study also gave an effective guidance to design rules for modifying and developing CVA (Singh, 1989). Among all techniques, change vector analysis is able to describe the output data in terms of total magnitude of change and angle of direction between two different time samples from multispectral satellite images as described in (Collins and Woodcock, 1994), (Jensen, 1995) and (Johnson and Kasischke, 1998).
∗Corresponding author. This is useful to know for communication with the appropriate person in cases with more than one author
However, some shortcomings are still not solved in change de-tection techniques, such as classification error accumulation. A CVA method called Modified Supervised Change Vector Analy-sis Posterior probability Space (MSCVAPS) based on the tech-nique presented in (Chen et al., 2011) is carried out in this work. It has been applied to detect land cover change obtaining excel-lent results in the studied areas when compared to the literature results. This developed method includes two steps, the first step implements the Double window Flexible Pace Search (DFPS) al-gorithm to generate a binary ”change” or ”no-change” image and the second step uses the scalar product to obtain the classified change map.
In order to assess the effectiveness of MSCVAPS, the technique has been evaluated into two study areas : (1) Shunyi District, Bei-jing, China, (2) Blida, Algeria. One of them (China) is chosen for comparison purposes because it was the area selected for analysis in the literature (Chen et al., 2011). The second test area (Alge-ria) is the real object of study, since an operative tool to detect change has been demanded in the area of Blida in Algeria. The final quality is given by the Kappa coefficient and the overall ac-curacy of changed unchanged pixels like the methods presented in (Cha, 2007), (Chen et al., 2003), (Chen et al., 2011), (Jensen, 1995) and (Nackaerts et al., 2005). A study has chosen the same China region used in (Chen et al., 2011) for comparison purposes.
Dates Landsat ID N◦ Instrument Path/Row LPGS version Data type Solar azimuth Solar elevation
30-04-2000 ETM 7 SAM 123/032 12.3.1 L1T 137.97 58.50
10-04-2010 ETM 7 Bumper 123/032 12.5.0 L1T 142.46 51.94
Table 1: Characteristics of the Landsat 7 images in the Chinese region.
Dates Landsat ID N◦ Instrument Path/Row LPGS version Data type Solar azimuth Solar elevation
14-06-2002 TM 5 Bumper 196/035 12.5.0 L1T 111.30 63.40
04-06-2010 TM 5 Bumper 196/035 12.5.0 L1T 118.23 65.98
Table 2: Characteristics of the Landsat 5 images in the Algerian region.
2. STUDY AREA DESCRIPTION
2.1 Area selection
The images of the selected study areas have been acquired from the Landsat program by different sensors, and they are freely available in the United States Geological Survey (USGS) archive in (USGS, 2014). The first study area images were acquired by Landsat-7 ETM (Enhanced Thematic Mapper) sensor. All bands, except from the thermal infrared one, were used in the methodol-ogy. The chosen area is placed in Shunyi District, Beijing, China, which lies from latitude 40.20◦ (North) to 40.04◦ (North) and longitude 116.68◦(East) to 116.53◦(East). The image charac-teristics and acquisition dates are shown at Table 1. The selected images were obtained at the same month to reduce seasonal vari-ance. A sub-area with 560x442 pixels was finally selected for further study. It covers a total area equal to 223.67km2. This test area was chosen for validation purposes because it had been used in the literature to present the original CVA methodology in (Chen et al., 2011). Fig. 1 shows the general map and the sub-area location.
The second data set used in this work consisted of two spatiotem-poral images acquired by Landsat-5 TM (Thematic Mapper) sen-sor in the region of Blida, Algeria. All bands, except from the thermal infrared one, were used in the methodology. The change detection analysis in this area was the main objective of this work. It presents a total surface equal to 788.18km2
, located at a lati-tude of 36.34◦(North) to 36.13◦(North) and longitude of 1.98◦ (East) to 2.36◦(East). In the study, a sub-area of 1130x775 pixels was chosen and it is shown in Fig.2 and Fig.3. Table 2 presents more information about the data set in Algeria and their acquisi-tion characteristics.
3. METHODOLOGY
3.1 Image pre-processing
The selected images may contain pixel spectral changes caused by several factors, such as soil moisture, atmospheric conditions, sun angle variation, sensor type and other parameters, apart from the real change detection cause. These pixel spectral changes must be removed to make that the changes are only caused by surface changes. A very important factor in change detection is to make sure that the location of the same surface features is co-herent. If the accuracy of image co-registration is low, a high amount of pixels will be detected as changed just because of im-age shifting.
Therefore, pre-processing of the satellite imagery includes radio-metric calibration, atmospheric reflectance, atmospheric normal-ization, geometric correction, image registration, and image rec-tification. The radiometric correction is critically needed due to several factors like changing sensor type parameters, different so-lar azimuth and soso-lar zenith angles, different atmospheric condi-tions for scattering and absorption (Yan. and Shaker, 2014). In
130°E
Figure 1: The studied area of China: Map location of the sub-area in a), satellite image acquired on April 30, 2000 in b), and satellite image acquired on April 10, 2010 in c).
this work, atmospheric correction has been carried out using the dark substraction algorithm and radiometric correction has been done using the Landsat Correction algorithm of the ENVI soft-ware. The geometric correction is also applied in order to resem-ble the truth ground location coordinates following (Xiangyang. et al., 2010). Then, image registration and image rectification finally provide the corrected image that will be used for the anal-ysis (Reji and Vidya, 2012).
After geometric rectification and image-to-image registration pro-vided by the ENVI tools using 100 control points, the Root Mean Square Error (RMSE) between both images were computed and they were approximately equal to 0.21, and 0.11 pixels for the sub-areas represented in the Figure.1, 3, respectively.
3.2 Change Vector Analysis
10°E
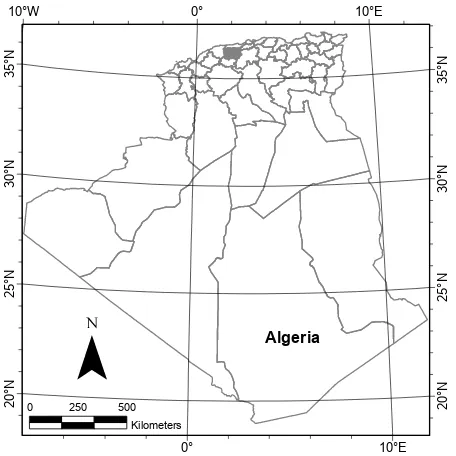
Figure 2: Map localisation of the studied area in Algeria.
global idea of CVA consists in computing the spectral change vectors by the subtraction of pairs of spectral bands. A change vector is described by the magnitude of change and the angle of change between two images obtained at the momentt1andt2(Lu et al., 2004). When a threshold is applied to this change vector based on their magnitude, then a possible change is determined, as described in (Chen et al., 2003) and (Nackaerts et al., 2005).
The Modified Supervised Change Vector Analysis Posterior prob-ability Space (MSCVAPS) described in (Chen et al., 2011) has been taken as the initial point for this study. The first step in the methodology is to carry out a supervised classification that pro-vides a posterior probability map for each scene. In this work, 5 classes were used in the classification process: bare soil, dense vegetation, no-dense vegetation, urban and water areas. In our case, the Maximum Likelihood Classifier (MLC) was the chosen classification technique using the spectral bandsb1,b2,b3,b4,b5 andb7of the Landsat TM or ETM instrument, respectively. The supervised MLC classifier requires a training process that needs ground truth data. Since no in situ information was available, visual information was obtained from the satellite images. The total amount of training pixels used in the classification process were10.74%of the total sub-area in China and6.02%of the total sub-area in Algeria.
The Maximum Likelihood classifier provides the posterior prob-ability vectors in the space-time domain:
H= (h1, h2, . . . , hn), (1)
G= (g1, g2, . . . , gn), (2)
whereH, andGrepresents the posterior probability vector at the timet1andt2, respectively. The index1,2, . . . , nrefers to each one of the classes consequently defined.
The change vector of the posterior probability space can be de-fined as:
∆M =G−H, (3)
where∆M is the posterior probability difference map for each pixel, and it also contains the information of the change that has taken place between the two images. The magnitude of change
2ºE 2º6'E 2º12'E 2º18'E
Figure 3: The studied area of Algeria: image acquired on June 14, 2002 in a), and image acquired on June 04, 2010 in b).
vector is given by the following expression:
k∆Mk=
In this context, a large value for||∆M||indicates a strong possi-bility of a changed pixel.
3.3 Threshold determination
The stage of the threshold selection is one of the most important steps in the procedure to determine whether a pixel is changed or not. A supervised threshold determination method using the Dou-ble FlexiDou-ble Pace Search (DFPS) algorithm, described in (Chen et al., 2003), was employed in this work.
3.4 Change type discrimination
The change type discrimination is used to identify the considered changed pixels in the Land Use/Land Cover (LULC) map. It is obtained by the analysis of the posterior probability map and the pixel-wise radiometric comparison as described in the literature in (Chen et al., 2011).
The change class information between the space-timet1 andt2 can be obtained from the direction of∆M. A pure pixel trans-formed from classato other classbduring a period of time would present the following change vector
wherePzdescribes the posterior probability vector of a pure pixel of class z. When the angle between the actual vector∆Mand the theoretical vector ∆Pab is small, then the corresponding pixel has probably changed from classato classb. Then, the change type can be easily determined from the scalar product, searching for the maximum value for the scalar product from all possible combinations of pairsa-b:
∆M·∆Pab=
The presented methodology has been applied to the selected data sets corresponding to the sub-area in China and Algeria.
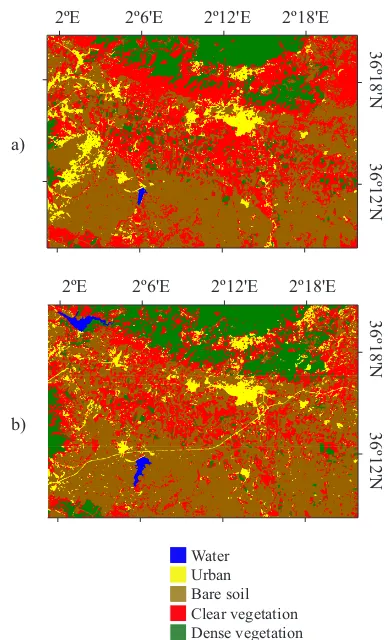
The posterior probability vectorsH for timet1andGfor time t2are shown in Fig. 4 and Fig. 5 for the sub-areas of China and Algeria respectively. These are results from the MLC classifier usingb1, b2,b3, b4, b5 andb7 bands. A previously described, 5 classes were used for classification: bare soil, dense vegeta-tion, no-dense vegetavegeta-tion, urban and water areas. This limited range of classes allow the methodology to get a very accurate classification map even with a low amount of training pixels. The total amount of training pixels used in the classification process were10.74%of the total sub-area in China and6.02%of the to-tal sub-area in Algeria. An important amount of changed pixels is clearly visible across the China scenes. The Algerian scenes show change in vegetation and they also show differences in valuable water bodies.
Figure 4: The posterior probability map for the China region: a) acquired on April 30, 2000, and b) acquired on April 10, 2010.
In order to evaluate the performance of the proposed MSCVAPS method, the overall accuracy and kappa coefficient obtained in determining changed or unchanged pixels were computed using the MSCVAPS results and a reference data set. This validation data set used was obtained again from visual inspection and it was different from the training data set, in order to get a fair accuracy assessment.
The changed/unchanged confusion matrix of MSCVAPS at the region of China is shown in Table 3. It represents the results of 247520 sample pixels. The reference validation data set in China was equal to13.6%of the total sub-area. A remarkable Kappa coefficient of0.827and an overall accuracy of91.50% were achieved by the proposed method. This change detection
a)
Figure 5: The posterior probability map for the Blida region: ac-quired on June 14, 2002 in a), and acac-quired on June 04, 2010 in b).
result was compared with the results presented in the literature in (Chen et al., 2011). The comparison indicates that the pro-posed method gives excellent results. Therefore, the method is validated for its use in other regions.
Then, once the methodology is validated, Table 4 shows the con-fusion matrix of changed/unchanged pixels at the sub-area of Al-geria, that contains875750pixels. The reference validation data set was equal to13.6%of the total sub-area. The obtained Kappa coefficient was equal to0.865and the overall accuracy was equal to93.96%.
These results show the effectiveness of the change detection method-ology in the selected regions using Landsat data and the defined classes. Kappa coefficient is above 0.7 and the omission and commission errors of the changed and unchanged pixels were good balanced in both test areas.
Number of pixels Reference changed
UP CP Sum CE
Classified changed
UP 100008 9348 109356 8.55%
CP 11713 126451 138164 8.48%
Sum 111721 135799 247520 OE 10.48% 6.88%
Overall accuracy 91.50%, Kappa coefficient 0.827 NB: UP, CP, CE, OE represent the unchanged pixels, changed
pixels, commission error, and omission error respectively.
Table 3: Changed/unchanged confusion matrix for the sub-area in China.
Number of pixels Reference changed
UP CP Sum CE
Classified changed
UP 554799 23075 577874 3.99% CP 29801 268075 297876 10.00% Sum 584600 291150 875750
OE 5.10% 7.93%
Overall accuracy 93.96%, Kappa coefficient 0.865 NB: UP, CP, CE, OE represent the unchanged pixels, changed
pixels, commission error, and omission error respectively.
Table 4: Changed/unchanged confusion matrix for the sub-area in Algeria.
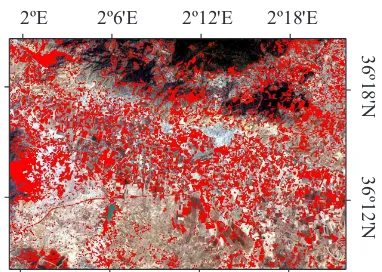
shown in Fig. 6 and Fig. 7 for the Chinese region and the Alge-rian region, respectively. In the case of China, it can be demon-strated that many pixels appear as changed due to urban growth and change of land use. This zone is very dynamic and this effect could be easily assessed by the use of the proposed methodology.
In the area of Algeria, a large number of pixels were also labeled as changed due to human activity and different climatic condi-tions. The forest areas were increased by3.18%, the urban ar-eas were incrar-eased by2.9%and water areas were also increased by 0.62%. On the contrary, grassland and the bare soil areas were decreased by3.64%and3.06%, respectively. The urban changes were mainly caused by new building construction. The changes in forest areas were caused by the plantation of new trees in mountainous areas and this fact is also related to the reduction of the grassland area.
116º35'E 116º40'E
40º10'N
40º5'N
Figure 6: Pixels in red represent the changed areas detected by MSCVAPS method in the sub-area of China.
2ºE 2º6'E 2º12'E 2º18'E
36º18'N
36º12'N
Figure 7: Pixels in red represent the changed areas detected by MSCVAPS method in the sub-area of Algeria.
5. DISCUSSION AND CONCLUSION
This work has described a methodology based on the existing change vector analysis in the posterior probability space and it has been applied in two different scenarios. The performance of the proposed algorithm has been evaluated with validation data obtained by visual inspection. The accuracy evaluation provides a Kappa coefficient greater than0.7for both test areas. The results suggest that the MCVAPS is effective and it has a strong potential for Remote Sensing change detection methods.
The quality of the data plays a very important role, as acquisi-tion of data should be made at different years choosing the same season. Besides, image registration has a strong impact on the final change detection methodology because it can introduce se-vere artifacts due to pixel location mismatch. In this work, excel-lent results are obtained thanks to the good quality of the satellite images, the strict radiometric and geometric correction and the accurate co-registration given by the proposed methodology.
In general, it is difficult to collect global information for all years of land use/land cover change information. The presented method-ology takes advantage of the spatiotemporal differences between two images acquired at different dates. For that reason, CVAPS is an effective approach in this scenario. Further development of the CVA technique is expected in the future, with an enhance-ment of robust and automatic algorithms for land use/land cover detection.
ACKNOWLEDGEMENTS
This research has been done in the frame of EMMAG funding.
REFERENCES
Armenakis, C., Cyr, I. and Papanikolaou, E., 2002. Change de-tection methods for revision of topographic databases. In: Sym-posium on Geospatial Theory, Processing and Applications., IS-PRS.
Barnes, C., Fritz, H. and Yoo, J., 2007. Hurricane disaster assess-ments with image-driven data mining in high-resolution satellite imagery. Geoscience and Remote Sensing, IEEE Transactions on 45(6), pp. 1631–1640.
Bovolo, F. and Bruzzone, L., 2007. A theoretical framework for unsupervised change detection based on change vector analysis in the polar domain. Geoscience and Remote Sensing, IEEE Trans-actions on 45(1), pp. 218–236.
Cha, S., 2007. Comprehensive survey on distance/similarity mea-sures between probability density functions. In: International Journal of Mathematical Models and Methods in Applied Sci-ences, Vol. 1, IEEE, pp. 300–307.
Chen, J., Chen, X., Cui, X. and Chen, J., 2011. Change vec-tor analysis in posterior probability space: A new technique for land cover change detection. In: IEEE Geo-science and Remote Sensing Letters, Vol. 8, IEEE, pp. 317–321.
Chen, J., Gong, P., He, C., Pu, R. and Shi, P., 2003. Land-use/land-cover change detection using improved change-vector analysis. In: Photogrammetric Engineering and Remote Sensing, Vol. 69, ASPRS, pp. 369–379.
Jensen, J. R., 1995. Introductory Digital Image Processing: A Remote Sensing Perspective. 2 edn, Prentice Hall PTR, Upper Saddle River, NJ, USA.
Johnson, R. D. and Kasischke, E. S., 1998. Change vector anal-ysis: A technique for the multispectral monitoring of land cover and condition. International Journal of Remote Sensing 19(3), pp. 411–426.
Lu, D., Mausel, P., Brondzio, E. and Moran, E., 2004. Change detection techniques. International Journal of Remote Sensing 25(12), pp. 2365–2401.
Malila, W., 1980. Change vector analysis: An approach for de-tecting forest changes with landsat. In: Proceedings of Sixth Annual Symposium on Machine Processing of Remotely Sensed Data: Soil Information Systems and Remote Sensing and Soil Survey, IEEE, pp. 326–335.
Michalek, J. L., Wagner, T. W., Luczkovich, J. J. and Stoffle, R. W., 1993. Multispectral change vector analysis for monitoring coastal marine environments. Photogrammetric Engineering & Remote Sensing 59(3), pp. 381–384.
Nackaerts, K., Vaesen, K., Muys, B. and Coppin, P., 2005. Com-parative performance of a modied change vector analysis in forest change detection. In: Int. Journal of Remote Sensing., Vol. 26, Taylor & Francis, pp. 839–852.
Nori, W., Sulieman, H. and Niemeyer, I., 2009. Detection of land cover changes in el rawashda forest, sudan: A systematic com-parison. In: Geoscience and Remote Sensing Symposium,2009 IEEE International,IGARSS 2009, Vol. 1, pp. I–88–I–91.
Reji, R. and Vidya, R., 2012. Comparative analysis in satel-lite image registration. In: Computational Intelligence Comput-ing Research (ICCIC), 2012 IEEE International Conference on, pp. 1–6.
Singh, A., 1989. Review article digital change detection tech-niques using remotely-sensed data. International Journal of Re-mote Sensing 10(6), pp. 989–1003.
Tang, J., Wang, L. and Yao, Z., 2007. Spatiotemporal urban land-scape change analysis using the markov chain model and a mod-ified genetic algorithm. International Journal of Remote Sensing 28(15), pp. 3255–3271.
Umamaheshwaran, R., Bijker, W. and Stein, A., 2007. Im-age mining for modeling of forest fires from meteosat imIm-ages. Geoscience and Remote Sensing, IEEE Transactions on 45(1), pp. 246–253.
USGS, 2014. GLOVIS http://glovis.usgs.gov/.
Xian., G., Homer., C. and Fry, J., 2009. Updating the 2001 na-tional land cover database land cover classification to 2006 by using landsat imagery change detection methods. Remote Sens-ing of Environment 113(6), pp. 1133–1147.
Xiangyang., S., Conggui., L. and Yizhen, S., 2010. Comparison and analysis research on geometric correction of remote sensing images. In: Image Analysis and Signal Processing (IASP), 2010 International Conference on, pp. 169–175.