AN EQUITABLE APPROACH FOR COMPENSATING MUNICIPALITIES OF THE RIO
GRANDE WATERSHED FOR ELECTRICITY GENERATED BY THE FURNAS
HYDROPOWER PLANT, BRAZIL
C. A. A. S. Ribeiro a, *, D. J. Mounts b, S. Jr. C. Menezes c, R. R. C. Rocha d, M. A. Chaves e, N. L. M. Castro a, K. O. Barros a, B. F.
Martins a, J. M. Gleriani a, V. P. Soares a
a Dept. of Forestry, Fed. Univ. Vicosa, 36570-900 Vicosa, MG, Brazil - (cribeiro, nero.castro, kelly.barros, bruno.martins, gleriani,
vicente)@ufv.br
b Fulbright Commission Brazil, 04001-083 Sao Paulo, SP, Brazil - [email protected]
c Tres Rios Institute, Federal Rural University of Rio de Janeiro, 25802-100 Tres Rios, RJ, Brazil - [email protected] d Federal University of Tocantins, 77001-090 Palmas, TO, Brazil - [email protected]
e Institute of Geoinformation and Technology, 31630-901 Belo Horizonte, MG, Brazil - [email protected]
KEY WORDS: Payment for Environmental Services, Water Royalties, Hydropower production, Financial Compensation
ABSTRACT:
In Brazil, ninety percent of total electric power comes from renewable sources, where hydropower represents 2/3 of the national energy matrix. In 2012, the new Federal Forest Code eliminated environmental protection along drainage divides and reduced the mandatory width of riparian zones, allowing for land cover change in these environmentally sensitive areas. The conversion of forestlands to agriculture will subject hydroelectric reservoirs to a growing load of sediments, shortening their useful life. In this study of the Furnas hydropower plant and its contributing basin, in the upper reaches of the Rio Grande, a re-evaluation of factors that determine the distribution of finances accrued from hydroelectric generation is recommended. Under the current policy, royalties are paid by the Furnas facility to states and municipalities in direct relation to the area of land flooded by its reservoir, whereas contributing rainfall precipitating in municipalities upstream of the lake is not considered. Currently, the 31 municipalities with lands flooded by the reservoir receive an average of R$ 213,107 (US$ 67,226) annually, while the remaining 172 municipalities in the basin receive no water royalties. In the proposed approach to redistribute these funds, each of the 203 municipalities will receive compensation determined by their contributing catchment area, averaging R$32,543 (US$ 10,266) per year. By considering distribution of rainfall in order to equitably allocate hydroelectric royalties, a system for the payment of environmental services is conceived. Such a system intends to incent stakeholders to protect or replant native forests along drainage divides and riparian zones, in recognition of the value this vegetation has in the reduction of long term costs for hydroelectric facilities.
INTRODUCTION
In Brazil, hydroelectric power plants provide more than 70% of the electricity consumed. The Southeastern and Midwestern regions of the country house 45% of these facilities (EPE, 2013), where Brazil is facing an increasingly dramatic electricity crisis. Since 2001 demand peaks have become quite frequent during summer months. On January 13, 2015 the ONS (Operator of the National Electricity System) was once again forced to partially interrupt the supply of electricity to the eight states of these regions for more than 1 hour, where 50% of the Brazilian population live and 65% of the total gross domestic product is produced. The root causes of these events are due to both factors of supply and demand. Supply is restricted because approximately 80% of ongoing construction projects of new hydropower plants are delayed (EBC, 2014). Also, during 2014 Southeast Brazil faced the most severe drought in the last 80 years, where reservoirs in this region currently average 17% of full capacity. Due to political reasons, both state and federal government refused to recognize the need to implement a gradual electric power and water rationing plan that would have preserved proper water volumes in the reservoirs. On the demand side, the Brazilian government stimulated the purchase of household appliances by the low-income population, while simultaneously reducing taxes and creating a low-interest-rate credit program. Abnormally high temperatures related to the current drought have increased the use of air conditioners during
* Corresponding author
peak hours, thus augmenting energy demand (ONS, 2015). These events increased the request for electric supply, now forcing the government to supplement demand with higher cost thermal power plants.
Drainage basins provide an array of economic goods, including agriculture, water resources and energy. They also provide many environmental services, such as erosion control, increased water infiltration and improved water quality. In the recently enacted Brazilian Forest code (Federal Law no. 12.651), protection zones along the watershed divides and the contributing areas of spring catchments were removed, paving the way for land use/land cover (LULC) changes (Castro, 2014). These LULCs not only threaten environmental services but also have the potential to destroy interbasin wildlife corridors. A meticulous analysis of this new Brazilian Forest Code indicated that riparian protection zones remained as the only explicitly articulated category of permanent preservation areas in Brazil (Castro, 2014).
However, due to increased global demand for food production, it is not likely that stakeholders will take these voluntary measures (Dean et al., 2007; Janzen et al., 2011). Due to economic growth and a recognition of value for environmental services, there exists a conflict for water resources related to the immediate intensification of agricultural and energy production and a long-term environmental preservation policy.
Payment for environmental services (PES) aims to incent stakeholders to protect native forests. These native forests hold economic values that are difficult to quantify but play an important role in the economy. In relation to hydroelectricity production, soil erosion control is recognized as valuable environmental service. The rate of sedimentation has a large impact on costs for the hydroelectric sector (ICRAF, 2013). A PES mechanism that incents stakeholders to reduce soil erosion rates will not only benefit energy production, but will simultaneously foster environmental preservation actions.
In 1988, Brazil created a system of watershed committees to settle conflicts related to water use, establish a price for water consumption and approve respective water resource plans. One year later, a federal policy was developed for financial compensation from the use of water resources for electricity generation (CFURH), known as water royalties (Rocha, 2012). This policy exclusively reimburses states and their municipalities with lands flooded by a reservoir. Although there exist committees and policies to regulate the use of water resources, their effective areas do not always encompass the entire watershed of a hydroelectric power station.
In light of the new Brazilian Forest code, the revision of the distribution of water royalties emerges as an economically viable, socially fair and environmentally conscious solution to incent the protection of native forests that were previously restricted from LULC, particularly along interbasin divides. This revision would set the basis for establishing a payment policy for environmental services within the watershed in which they are produced.
According to Brazilian legislation (ANEEL, 2014a), the water royalties correspond to 6.75% of the energy generated by each power plant, being calculated as follows:
CFURH = 6.75% * E * TAR (1)
where CFURH = water royalties [$]
E = energy generated by the power plant [MW h] TAR1 = updated reference tariff for electric energy
[$ MW-1 h-1]
Six percent of the total value of the energy produced is distributed as follows: 45% for the state where the power plant is located, 45% for municipalities surrounding the reservoir, and 10% for specific federal agencies: Ministry of Environment - MMA (3%), Ministry of Mining and Energy - MME (3%) and the National Fund for Scientific and Technological Development – FNDCT (4%). The amount allotted to municipalities depends on the proportion of the area flooded by the waters of the reservoir. The remaining 0.75% funds the National Water Resources Policy and the Nacional Water Resources Management System (ANEEL, 2014a).
Current divisions of water royalties assume that the value of energy produced in a hydroelectric power station is solely the result of water held in its reservoir. This assumption inhibits
1currently 79.87 R$ MW-1 h-1 26.69 US$ MW-1 h-1
payment for environmental services that originate in the upper portions of a basin. ANEEL (2014b) – the Brazilian Electricity Regulatory Agency – calculates the monthly quantity and value of hydropower produced by reservoirs, and identifies the amount of water royalties to be paid by each power station company to: a) the municipalities bordering its reservoirs, b) the respective states and c) Federal agencies previously mentioned. However, it is well known that the production of hydroelectricity results from both the falling height and the water flow (Maher et al., 2003). The existence of these two factors indicates the error of using just one single criterion to compute the apportionment of water royalties. Currently, only municipalities with lands flooded by a reservoir are financially rewarded (ANEEL, 2001). To solve this problem, Oliveira (2009) has developed a methodology to compute the percentage of electricity generation related to rainfall in areas upstream of the dam, and then calculate the financial compensation for each municipality within the basin.
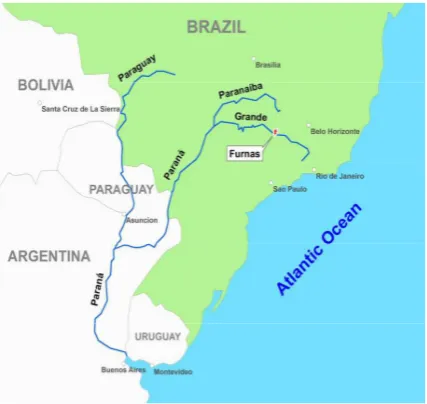
Furnas, one of the 20 largest Brazilian hydroelectric power stations, was chosen as a case study. Its construction started in 1958 to address the emerging energy crisis that threatened Southeastern Brazil, a region that was and still is home to the largest economic and political centers of the country: Minas Gerais, São Paulo and Rio de Janeiro. The dam was built in the canyon of the Rio Grande, which belongs to the Paraná basin (Fig. 1).
Figure 1. Location of the Furnas hydroelectric power plant and the main rivers that form part of the Paraná basin
In 2014, Furnas generated 3,113 GW h of energy and paid an equivalent of US$ 5.5 million in water royalties, less than half of the production in 2012 (ANEEL, 2014b). This decline in revenue compounded negative effects on local economies already suffering energy and water shortages.
MATERIALS AND METHODS
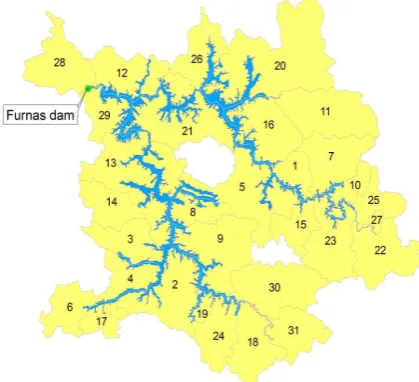
The Furnas watershed has an area of 51,890.16 km² and is located in the state of Minas Gerais (Fig. 2).
Figure 2. Furnas watershed, location of its dam, and states that form part of the Southeast Region of Brazil
The reservoir covers 1,406.26 km², representing 2.7% of the watershed, and holds 22.6 billion m³ of water. The hydroelectric power plant has a net falling height (h) of 94.1 m (Furtado, 1965) and a water flow (Q) of 678 m³ s-1 (ANA, 2005). It has eight 152
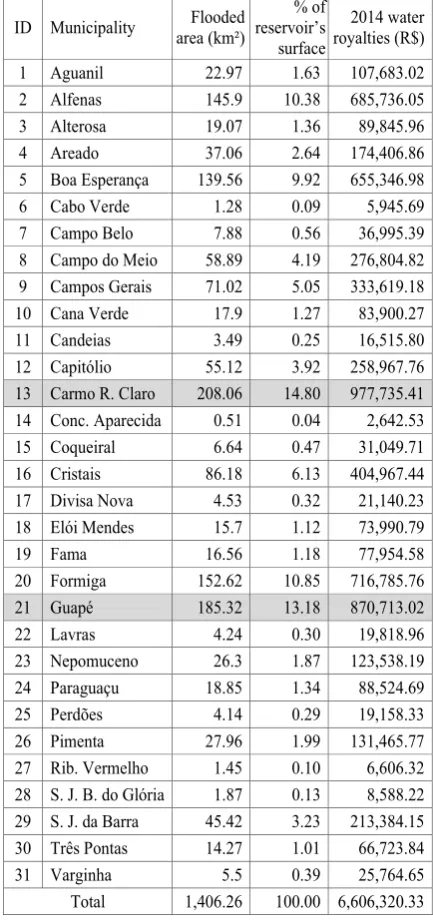
MW generators, accounting for an installed capacity of 1,216 MW. Its reservoir intercepts 31 of the 203 municipalities in the watershed (Fig. 3).
Figure 3. Municipalities with lands flooded by Furnas reservoir
All spatial analyses were performed in ArcGIS® version 10.3. First, the coordinates of Furnas reservoir’s spillway (46.3181° W, 20.6697° S) were obtained from Google Earth and used to create a point feature. The upstream portion of the Paraná basin hydrography digital dataset2, provided by ANA, the Brazilian
2 http://hidroweb.ana.gov.br/baixar/mapa/Bacia6.zip 3 http://srtm.csi.cgiar.org/SELECTION/inputCoord.asp
National Water Agency, was selected from this point. The extent of the minimum boundary rectangle encompassing this portion of Paraná basin had the following geographic coordinates: 20.2° S (top), 23° S (bottom), 46.7° W (left), and 43.5° W (right). Next, this information was used to identify and download the corresponding Shuttle Radar Topography Mission (SRTM) tiles3,
provided by the Consortium for Spatial Information of the Consultative Group on International Agricultural Research (CGIAR-CSI). The data, which has a cell-size of 90m, was originally produced by NASA and had been processed by CGIAR-CSI to eliminate voids and to reduce the occurrence of both spurious peaks and depressions. The corresponding geographic coordinate system adopts the WGS_1984 datum.
The two SRTM tiles encompassing the watershed were mosaicked, resulting in a seamless digital elevation model (DEM). Using the Hydrology toolbox of ArcGIS Spatial Analyst extension, the flow direction grid was generated, followed by the corresponding flow accumulation grid. The command ‘Snap Pour Point’ of the Spatial Analyst extension was used to snap the point feature depicting the location of the Furnas reservoir’s spillway – a pour point – to the cell of highest flow accumulation within a distance of 1.5 cells, to account for diagonals. Finally, the resulting grid cell was used to delimit its drainage area, i.e., the Furnas watershed.
The delineation of the watershed divide is the starting point for spatializing the two factors of hydroelectric power generation (falling height and water flow). The contributions of water flow and headwater to the total energy produced by a hydropower station are given by equations (2) and (3) (Oliveira, 2009):
(2)
(3)
where PQ = percentage contribution of water flow [%]
Ph = percentage contribution of falling height [%]
h = net falling height [m] Q = water flow [m3 s-1]
By applying h and Q values for Furnas to equation (2), the resulting water flow contributes 87.8% of the total energy generated in this hydropower plant. From equation (3), it is found that the resulting net falling height adds 12.2%.
Once these values were obtained, their spatial distribution within the Furnas watershed was determined. The net falling height is a function of the full reservoir level, while the distribution of water flow spans the entire drainage area, including the reservoir. In the present study, it is assumed that rainfall is uniformly distributed over the watershed. Thus, the annual water yield of each municipality towards hydropower production is computed multiplying area within Furnas watershed by the specific water flow value (SWFV4).
The municipalities feature dataset was clipped using the polygon associated to the Furnas watershed, in order to identify the municipalities within the basin. The percentage contribution of each one of the 31 municipalities to the net falling height is found dividing the value of the inundated area of each municipality by
4 SWFV [m³ s-1 m-²] = total water flow [m³ s-1] at the turbine
the total area of the reservoir's surface (Table 1). The water royalties owed to each municipality are calculated by multiplying their respective percentage contribution by 2.7% (0.45 * 0.06) of the total value of the energy generated annually.
ID Municipality area (km²) Flooded reservoir’s % of surface
2014 water royalties (R$)
1 Aguanil 22.97 1.63 107,683.02
2 Alfenas 145.9 10.38 685,736.05
3 Alterosa 19.07 1.36 89,845.96
4 Areado 37.06 2.64 174,406.86
5 Boa Esperança 139.56 9.92 655,346.98
6 Cabo Verde 1.28 0.09 5,945.69
7 Campo Belo 7.88 0.56 36,995.39 8 Campo do Meio 58.89 4.19 276,804.82 9 Campos Gerais 71.02 5.05 333,619.18 10 Cana Verde 17.9 1.27 83,900.27
11 Candeias 3.49 0.25 16,515.80
12 Capitólio 55.12 3.92 258,967.76 13 Carmo R. Claro 208.06 14.80 977,735.41 14 Conc. Aparecida 0.51 0.04 2,642.53
15 Coqueiral 6.64 0.47 31,049.71
16 Cristais 86.18 6.13 404,967.44 17 Divisa Nova 4.53 0.32 21,140.23 18 Elói Mendes 15.7 1.12 73,990.79
19 Fama 16.56 1.18 77,954.58
20 Formiga 152.62 10.85 716,785.76
21 Guapé 185.32 13.18 870,713.02
22 Lavras 4.24 0.30 19,818.96
23 Nepomuceno 26.3 1.87 123,538.19 24 Paraguaçu 18.85 1.34 88,524.69
25 Perdões 4.14 0.29 19,158.33
26 Pimenta 27.96 1.99 131,465.77
27 Rib. Vermelho 1.45 0.10 6,606.32 28 S. J. B. do Glória 1.87 0.13 8,588.22 29 S. J. da Barra 45.42 3.23 213,384.15 30 Três Pontas 14.27 1.01 66,723.84
31 Varginha 5.5 0.39 25,764.65
Total 1,406.26 100.00 6,606,320.33 Table 1.Municipalities bordering Furnas reservoir, their flooded areas, percentage contribution to the area of the reservoir and water royalties received from ANEEL during
2014.
RESULTS AND DISCUSSION
The values of the mosaicked DEM ranged from -165 to 2,854 m. A visual inspection of pixels with negative values indicated that elevation errors were spread mostly along the coastline, far from the Furnas watershed. The topography of this region presented elevations between 618 and 2,765 m, with a mean of 1,002 m ± 196 m.
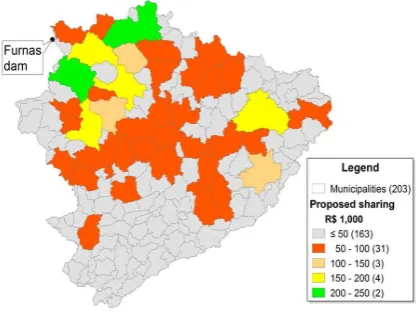
A visual depiction of values from Table 1 shows the distribution of water royalties from Furnas power station received by municipalities in 2014 (Fig. 4). An analysis of Figure 4 shows the concentration of water royalties surrounding the reservoir and also depicts that the majority of the watershed receives no compensation.
Figure 4. Spatial distribution of water royalties paid in 2014 to the municipalities within Furnas watershed.
In the year 2014, ANEEL paid R$ 6,606,320.33 in water royalties to the 31 municipalities intercepted by the reservoir. The same amount was also paid to the state of Minas Gerais and another R$ 3,303,160.16 to the federal agencies (ANA, FNDCT, MMA and MME), totaling R$ 16,515,800.82 ( US$ 5.5 million) in
royalties. The average value paid to each municipality bordering the Furnas reservoir was R$ 213,107 ± 272,528.
As can be observed from Figure 4, the vast majority of the municipalities (172 out of 203) within the Furnas watershed do not receive any compensation related to the energy generated by the power plant. The magnitude of this inequitable distribution can be perceived by noting that only two towns (Carmo do Rio Claro e Guapé, highlighted in Table 1 and depicted in green in Fig. 4) account for almost 30% of the financial compensation paid by Furnas.
Based on the inundated and non-inundated surface areas of each municipality, relative contributions to net falling height and water flow are summarized in Table 2. This table shows that the 31 municipalities intercepted by the reservoir contribute 100% to the net falling height and 28% to the water flow. It can also be seen that the remaining 172 municipalities do not contribute to the net falling height, but compose 71.46% of the water flow.
Municipali-ties Quan-tity area (km²)Flooded Dry area (km²) Rh RQ
Intercepted
by reservoir 31 1,406.26 13,403.13 100% 28.54 % Not
intercepted
by reservoir 172 0.00 37,080.77 0% 71.46% Total 203 1,406.26 50,483.90 100% 100% Table 2. Surface areas and contributions of municipalities to the
Water Flow (Q) and head of water (h) of the Furnas hydroelectric power plant
where Rh = relative contributing area of municipalities to net
falling height
RQ = relative contributing area of municipalities to
Using the values of contributing net falling height and water flow from Table 2, the equitable apportionments of water royalties for municipalities, both intercepted and not intercepted by the reservoir, are presented in Table 3.
Municipalities Quantity Ph PQ apportionmentEquitable
Intercepted by
reservoir 31 12.2% 25.1% 37.3% Not
intercepted by
reservoir 172 0% 62.7% 62.7%
Total 203 12.2% 87.8% 100% Table 3. Percentage contributions to the total energy produced
by the Furnas hydropower plant, of areas within Furnas watershed, intercepted by and outside its reservoir.
As can be seen in Table 3, the 172 municipalities within Furnas watershed that are not intercepted by its reservoir contribute to 62.7% (0.878 × 0.7146) of the total energy produced by the power station. However, under current distribution criteria for water royalties, these municipalities do not receive any financial compensation from ANEEL.
The values from Table 3 were used to calculate an equitable distribution of water royalties for each one of the 203 municipalities that form the Furnas watershed. By redistributing the amount of water royalties paid by ANEEL in 2014, the proposed apportionment strategy led to an average value of R$ 32,543 ± 38,316, with a maximum of R$ 242,647. The corresponding spatial distribution of these new water royalties is showed in Figure 5.
Figure 5. Apportionment of Furnas royalties, based on the net falling height and water flow.
CONCLUSIONS
In the face of growing conflicts between conservation and land use, attention must be given to allocate scarce natural resources between competing uses. Payment for environmental services arises as a recent economic solution to incent stakeholders to protect native forests. In the case of hydroelectric production, forests upstream of the power facilities provide an economic value through decreased erosion, thus slowing sedimentation of reservoirs and reducing costs. In Brazil, the water royalties policy (CFURH) enacted in 1989, presents itself as an established and
consistent source of finances to compensate environmental services.
Although the water royalties mechanism was not originally conceived as a solution to value environmental services, it has the potential to distribute funds accrued from electricity generation in order to protect native forests that are no longer considered preservation areas in the new Brazilian Forest Code. Land use land cover changes related to the alteration in federal law threaten water quality, biodiversity and the welfare of riverine communities. A simple redistribution of the existing water royalties has the potential to incent stakeholders within the power plant basin to conserve native vegetation and reduce environmental threats.
Instead of being a mechanism to reduce social gaps and asymmetries on regional markets, the current criteria to distribute the water royalties in Brazil promotes the concentration of wealth in municipalities bordering the reservoir. Currently, there are 31 towns within the Furnas drainage basin receiving an average of R$ 213,107 ± 272,528 per year. The proposed equitable approach for sharing these water royalties will lead to an annual average of R$ 32,543 ± 38,316, thus promoting a broader financial compensation to all 203 municipalities of this region.
As can be seen in this case study of the Furnas power plant and its watershed, the current distribution criteria lacks a complete understanding related to the spatial factors of hydroelectricity production. By including water flow as a major component to the production of hydroelectricity, finances that were once concentrated around the reservoir become proportionately distributed throughout the watershed. The equitable distribution of water royalties creates a funding source for payment of environmental services originating upstream of a reservoir.
Further improvements in the legislation regarding the purpose of water royalties must stipulate the conservation of native forests and the sustainable development of the watershed, in order to assure payment for environmental services. Additional study is necessary to determine whether the quantity of water royalties related to the proposed methodology is sufficient to compensate the tradeoff for converting forestland to agriculture. The suggested approach can be more accurate by including the geographic variations on water budget, considering its major components – precipitation, evapotranspiration and changes in water storage within a drainage basin.
AKNOWLEDGMENTS
The authors acknowledge CNPq, FAPEMIG, Fulbright/CAPES, and Projeto Floresta-Escola/Hidroex for the financial support.
REFERENCES
ANA – Brazilian Water Agency. 2005. Water Resources Studies: water resources demand and supply in Brazil. Brasília: ANA. 134 pp. http://arquivos.ana.gov.br/planejamento/planos/pnrh/VF%2-0DisponibilidadeDemanda.pdf (30 Jan. 2015).
ANEEL. 2014a. Financial Compensation for the use of water resources in electricity generation. http://www.aneel.gov.br/apli-cacoes/cmpf/gerencial/ (28 Jan. 2015).
ANEEL. 2014b. Distribution coefficients: energy gains from upstream power plant reservoirs – the Furnas power station. http://www.aneel.gov.br/aplicacoes/cmpf/gerencial/CMPF_Mu-nicipios/CMPF_Municipios_Selecionar_UHEs_Cascatas_.cfm? IdeEmp=394&IdeUsi=1007&seginfo=6220151324. (28 Jan. 2015).
Castro, N. 2014. Automated delineation of permanent preservation areas along ridgelines. Universidade Federal de Vicosa, Vicosa, Brazil (M.Sc. dissertation), 76 pp.
Dean, T., McMullen, J. 2007. Toward a theory of sustainable entrepreneurship: reducing environmental degradation through entrepreneurial action. Journal of Business Venturing, 22, pp. 50–76.
EBC – Brazilian Press Agency. 2014. http://agenciabrasil.ebc.- com.br/economia/noticia/2014-09/quase-80-das-usinas-hidrele-tricas-em-construcao-estao-atrasadas-diz-tcu (25 Jan. 2015). EPE – Energy Research Company. 2013. Electric energy statistical yearbook. Rio de Janeiro, Brazil, pp 251. http://www. epe.gov.br/AnuarioEstatisticodeEnergiaEletrica/20130909_1.pd f (26 Jan. 2015).
Furtado, C. 1965. BNDE documental sources. Appendix A – Explaining the 1965 Brazilian Program for its Economic Modernization. 74 pp. http://www.centrocelsofurtado.org.br/ar-quivos/image/201109010919410.MD2_0_099.pdf (28 Jan. 2015).
ICRAF – World Agroforestry Centre. 2013. Rewards for, Use of, and Shared Investment in, Pro-poor Environmental Services project, phase 2. West Java, Indonesia, pp. 75. http://www.ifad.-org/climate/regions/apr/rupes2_booklet.pdf (20 Mar. 2015). Janzen, H., Fixen, P., Franzluebbers, A., Hattey, J., Izaurralde, R., Ketterings, Q., Lobb, D., Schlesinger, W. 2011. Global prospects rooted in soil science. Soil Science Society of America Journal, 75, pp. 1–8.
Maher, P., Smith, N., Williams, A. 2003. Assessment of pico hydro as an option for off-grid electrification in Kenya. Renewable Energy, 28, pp. 1357–1369.
Oliveira, A. 2009. A new regulatory framework for the sharing of the financial compensation for the use of water resources in the generation of electricity: balancing regional asymmetries. Universidade Federal de Vicosa, Vicosa, Brazil (Ph.D. thesis), 36 pp.
ONS – Brazilian Operator of the National Electricity System. 2015. http://www.ons.org.br/tabela_reservatorios/conteudo.asp (25 Jan. 2015).