AIRBORNE X-HH INCIDENCE ANGLE IMPACT ON CANOPY HEIGHT
RETREIVAL: IMPLICATIONS FOR SPACEBORNE X-HH TANDEM-X GLOBAL
CANOPY HEIGHT MODEL
M. Lorraine Tighe(a)*, Doug King(b), Heiko Balzter(c), Abderrazak Bannari(d), Heather McNairn(e)
[email protected]; [email protected]; [email protected]; [email protected]; [email protected]
(a)
Intermap Technologies, Inc., 8310 South Valley Highway, Suite 400, Englewood, CO, 80112-5809 USA
(b) Carleton University, Dept. of Geography and Environmental Studies, 1125 Colonel By Dr. Ottawa, Ontario K1S 5B6, Canada (c)
University of Leicester, Centre for Landscape and Climate Research, Department of Geography, Leicester LE1 7RH, UK (d) Department of Geography, University of Ottawa, 60 University, Simard 029, Ottawa, ON, Canada K1N 6N5
(e)
Agriculture and Agri-Food Canada, 960 Carling Avenue, Ottawa Ontario, K1A 0C6 Canada
Commission VII WG2: SAR Interferometry
KEY WORDS: Canopy Height, InSAR, X-band, DTM, DSM, DEM
ABSTRACT:
To support international climate change mitigation efforts, the United Nations REDD+ initiative (Reducing Emissions from Deforestation and Degradation) seeks to reduce land use induced greenhouse gas emissions to the atmosphere. It requires independent monitoring of forest cover and forest biomass information in a spatially explicit form. It is widely recognised that remote sensing is required to deliver this information. Synthetic Aperture Radar interferometry (InSAR) techniques have gained traction in the last decade as a viable technology from which vegetation canopy height and bare earth elevations can be derived. The viewing geometry of a SAR sensor is side-looking where the radar pulse is transmitted out to one side of the aircraft or satellite, defining an incidence angle ( ) range. The incidence angle will change from near-range (NR) to far-range (FR) across of the track of the SAR platform. InSAR uses image pairs and thus, contain two set of incidence angles. Changes in the InSAR incidence angles can alter the relative contributions from the vegetation canopy and the ground surface and thus, affect the retrieved vegetation canopy height. Incidence angle change is less pronounced in spaceborne data than in airborne data and mitigated somewhat when multiple InSAR-data takes are combined. This study uses NEXTMap® single- and multi-pass X-band HH polarized InSAR to derive vegetation canopy height from the scattering phase centre height (hspc). Comparisons with in situ vegetation canopy height over three test sites (Arizona-1, Minnesota-2); the effect of incidence angle changes across swath on the X-HH InSAR hspc was examined. Results indicate at steep incidence angles ( = 35º), more exposure of lower vegetation canopy structure (e.g. tree trunks) led to greater lower canopy double bounce, increased ground scattering, and decreased volume scattering. This resulted in a lower scattering phase centre height (hspc) or a greater underestimation of vegetation canopy height given by the single-pass X-HH InSAR data. The opposite effect occurs in the far range ( = 55º), an increase in volume scattering resulted in more accurate vegetation canopy heights when compared to in situ measurements. These findings indicate that incidence angle corrections should be applied to airborne X-HH single-pass InSAR. In contrast, NEXTMap X-HH (multi-pass data) hspc data experienced little or no effect of incidence angle, possibly because NEXTMap is an aggregation of multi-pass flight line strips, which averages data over several incidence angles. These results may aid in the understanding of potential incidence angle effects in Astrium spaceborne Tandem-X data, which will have global digital surface elevation coverage by 2015.
1. INTRODUCTION
Mapped estimates of vegetation canopy height of forests are relevant to understanding carbon storage and cycling, susceptibility to wildfire, changes in vegetation structure from disturbance (e.g. insect outbreaks, wildfire, storms, forest management practices such as thinning and logging), and assessment of biodiversity and wildlife habitat. Furthermore, vegetation canopy height is useful in obtaining more accurate estimates of aboveground woody biomass and is a key indicator of succession status (Balzter et al. 2007a). Knowledge of vegetation canopy structure is required for modelling processes such as photosynthesis, energy transfer, evapotranspiration, and climate change at both local and global scales. Furthermore, vegetation canopy height is of great value in many types of regional- to global-scale modelling and is an essential precursor to many techniques for extracting physical, topographic, and cultural data for a plethora of applications. Examples of applications include floodplain modelling, geological hazard assessment, landslide analysis, urban planning, topographic and geologic mapping, biomass studies, and land-fire initiatives, amongst others. Digital surface models (DSMs) derived from
interferometric Synthetic Aperture Radar (cited as IFSAR or InSAR in the literature) exhibit frequency-dependent sensitivity to the height of vegetation canopy elements (e.g. leaves, twigs, branches, and tree trunks), and a number of investigators have had success in retrieving estimates of canopy height from interferometric measurements (Treuhaft and Siqueira, 2000; Kellndorfer et al., 2004; Balzter et al., 2007a; 2007b; Walker et al., 2007; Sexton et al., 2009). Methods to estimate vegetation canopy height from InSAR techniques vary. One approach, applied in this study, is to subtract an independent elevation measurement of the bare ground surface (e.g. digital terrain model – DTM) from the interferometric surface height (e.g. digital surface model – DSM) to estimate the scattering phase centre height (hspc; Kellndorfer et al., 2004; Simard et al., 2006; Andersen et al., 2008) to yield an estimate of vegetation canopy height. While a significant amount of research has been published on the application of InSAR for vegetation parameter extraction—in particular for vegetation canopy height— additional research is needed to gain further understanding of the effect of incidence angle changes on InSAR derived vegetation canopy height given by hspc and methods must be International Archives of the Photogrammetry, Remote Sensing and Spatial Information Sciences, Volume XXXIX-B7, 2012
employed that seek to minimize their influence, (Izzawati et al., 2006; Woodhouse et al., 2006; Balzter et al., 2007a).
The aim of this paper to assess the impact of incidence angle changes on the ability of airborne short-wavelength (X-band) InSAR data to retrieve accurate vegetation canopy height estimates for shrub, deciduous, coniferous, mixed forest, and wetland vegetation. This will be achieved using Intermap Technologies NEXTMap multi-pass and single-pass X-band, horizontal transmit and receive polarization (X-HH) InSAR data. This assessment was performed over three sites in the United States. In particular, the nature and extent of vegetation canopy height underestimation at different incidence angles and the conditions under which they are most likely to occur for the single-pass InSAR configuration were investigated. Section 2 introduces the concept of SAR viewing geometry and scattering phase centre heights from InSAR data. Section 3 gives a brief description of the data and study sites addressed in this analysis, followed by Section 4, which provides the methodology utilized to access the vertical accuracy of the NEXTMap X-HH InSAR data over three incidence angles in flat terrain (e.g. slopes less than 10º). In Section 5, the test results are presented. Section 6 concludes the paper with some discussions of future work.
2. INSAR INCIDENCE ANGLE AND SCATTERING
PHASE CENTRE HEIGHT BACKGROUND
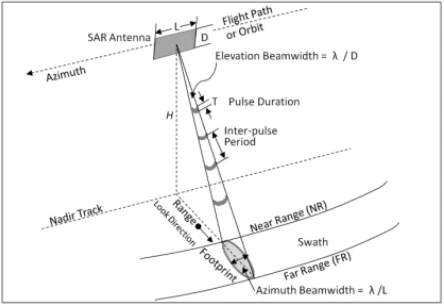
The side-looking SAR sensor configuration defines an incidence angle range ( ) that is determined by how far from nadir (H – Figure 2) the SAR beam points out to the side. The incidence angle range will change from the near-range (NR) to mid-range (MR) to far-range (FR) across the swath (Figure 1). This type of viewing geometry can lead to geometric distortions in InSAR elevation data. Furthermore, changes of incidence angle modify the relative contribution from structural vegetation canopy elements (leaves, twigs, branches, tree trunk) and ground surfaces. Due to the different flying altitude, NR – FR incidence angle changes are more pronounced in airborne data, than in spaceborne data. In the case of the airborne X-band InSAR (e.g. NEXTMap) sensor used in this study, the incidence angle ranges from 35º in NR to 55º in FR, centred on 45º (MR).
Figure 1. Scanning configuration of right-looking rectangular SAR antenna, modified after Olmsted (1993), to show antenna
length (L), antenna width (D), and pulse duration (T).
The X-HH InSAR DSM minus an accurate digital terrain model (DTM) determines the scattering phase centre height (hspc), which is an average of all vertically distributed scattering elements within a SAR resolution cell (Figure 2). Note, at
X-band there is penetration into the vegetation canopy (red line, Figure 3). X-HH derived hspc is at or very near bare ground (Mercer, 2001; blue dashed line, Figure 3) in barren areas; whereas in forest canopies the location of hspc depends on the penetration depth of microwaves into the canopy. This depth depends on wavelength, incidence angle, size and density distribution of the scattering elements, geometric arrangement of the scatterers, canopy moisture condition, surface roughness, and moisture content of the ground layer (Andersen et al., 2006; Izzawati et al., 2006; Woodhouse et al., 2006). Vegetation canopy heights given by X-HH InSAR hspc data are typically located in the upper portion of the vegetation canopy.
Figure 2.DSM (yellow line) minus DTM (red line) is the hspc.
Figure 3. Relative position of X-HH InSAR hspc for a dense forest, bare ground, and true canopy height (red, blue and white
dashed lines, respectively.
Incidence angle variations across swath will change the relative signal contribution from features on the ground (Woodhouse et al., 2006). For example, steep incidence angles (e.g. = 35º) permit more exposure of the lower portion of a vegetation canopy such that there is greater signal interaction with trunks and lower vegetation leading to greater volume scattering if there is understory, or if little to no understory, greater double bounce, and greater ground scattering contributions resulting in a lower scattering phase centre height (hspc, Figure 4 left – steep incidence angle). The opposite effect occurs in the FR (Figure 4 – right shallow incidence angle).
Figure 4. Incidence angle effects on hspc retrieval for a forest across one flight line strip of data from NR (steep incidence
angle) to FR (shallow incidence angle).
It is anticipated that incidence angle range of a single interferometric data-take (e.g. one flight line strip of data) will International Archives of the Photogrammetry, Remote Sensing and Spatial Information Sciences, Volume XXXIX-B7, 2012
result in a larger range of height errors across the swath, but this effect will be less pronounced in multi-pass (e.g. NEXTMap) since the imagery produced is averaged from multiple data takes that are not aligned (Woodhouse et al., 2006). This hypothesis is examined in this paper.
3. STUDY SITES
Three research sites are located in the United States (Minnesota [2], Arizona [1]) and were selected because the bio-geophysical characteristics of these sites provided a unique opportunity to evaluate X-HH InSAR multi-pass data aggregated (called NEXTMap) and single-pass (Intermap’s non-commercial data) dataset as a source for high-resolution vegetation canopy height estimates across a range of vegetation densities and structural classes, as well as under a variety of topographic conditions and environments (arid and temperate). A description of the three sites is presented below.
3.1 Ely, Minnesota
The first site is situated in the temperate climate between 47º37’30” N and 47º52’30” N and 91º37’30” W and 91º52’30” W near the city of Ely, Minnesota. It is comprised of dense homogenous coniferous and deciduous forests as well as mixed forests with little understory. The common species are red pine (Pinus resinosa), white pine (Pinus strobus), black spruce (Picea mariana), and red maple (Acer rubrum). The site covers an area of 169.8 km2 and is dominated by rolling topography with irregular slopes (0º-18.7º) and many craggy outcrops of bedrock. The elevation range is 422 – 506 m.
3.2 International Falls, Minnesota
The International Falls, Minnesota, site is located between 48º30’00” N and 48º37’30” N and 93º15’00” W and 93º30’00” W. It represents more of a pure coniferous site than the Ely site. Forests are dominated by coniferous species such as white pine, white spruce (Picea glauca), and balsam fir (Abies balsamea) with a mixture of white pine, red pine, and jack pine (Pinus banksiana) more prominent in the eastern portion. The site was 16.35 km2 and situated on a lake plain with topographic variation of less than 30 m and slopes less than 15º.
3.3 Southern Arizona
The Arizona site is located near the Mexican border between 31º22’50” N and 31º45’09” N and 111º14’53” W and 111º37’42” W. It represents a hot arid environment with a diverse range of vegetation types on flat to steep terrain. The vegetation classes are predominately grassland (e.g. Bouteloua curtipendula and Schizachyrium scoparium), shrub / scrub (e.g. thornscrub (Canotia holacantha)), and coniferous forests, with minor coverage of wetlands, bare earth, and urban development. Woody species dispersed throughout the area include various species of oak (Quercus spp.), juniper (Juniperu spp.), desert riparian cottonwoods (Populus fremontii), Goodding willow (Salix gooddingi), Arizona ash (Fraxinus velutina), Arizona walnut (Juglans major), Arizona sycamore (Platanus wrightii), Mexican elder (Sambucus mexicana), and velvet mesquite (Prosopis velutina). The site is approximately 1,484 km2 with a range of elevations from 931 m in the plains to 1762 m in the mountains and rolling topography of irregular slopes (0º-28º).
4. DATASETS
Digital elevation models (DEMs) are topographic models of the earth’s terrain representing either bare earth or surface
elevations. DEMs typically are offered as a continuous elevation surface (Podobnikar, 2009). DEMs with elevations of vegetation, buildings, and other cultural features digitally removed are referred to as digital terrain models (DTMs), whereas those that have maintained heights of features above the ground are called digital surface models (DSMs). Intermap has created a continental U.S. database of X-HH InSAR derived DTM and DSM data under the NEXTMap mapping program.
NEXTMap DSM data are a compilation of multiple-data takes aggregated together to reduce errors associated with side-looking viewing geometry of SAR sensors (Figure 1). Multi-pass data processing provides a stable dataset for which vegetation canopy height can be modelled (Kellndorfer et al., 2004; Andersen et al., 2008; Chen et al., 2010). NEXTMap DTMs are derived from X-HH InSAR DSMs using a 3D workflow based on an ISO-certified process (Intermap, 2011). Incidence angle are not extractable from aggregated data. Single-data take X-HH InSAR flight line strips used to create the NEXTMap data were available and used to access incidence angle variations.
Both the single- and multi-pass datasets were obtained as 32-bit floating 5-meter posted elevation grids (also known as 5 m ground sampling distance, or ground range pixel spacing) in geometric coordinates for three sites. The NEXTMap DTM data (multi-pass data aggregated have a 1 m, 1-3 m, and >3m linear error (LE) 90% vertical accuracy in unobstructed terrain with slopes less than 10º, 11º – 20º, and greater than 20º, respectively. There are no published accuracies for the NEXTMap DSM or the single-data take InSAR. Data of slopes less than 10º were used in this research to isolate effects due to incidence angle variations rather than changes in terrain slope.
Within a year of the InSAR data collection, field programs were conducted to obtain tree and shrub vegetation heights using an Abney hand spirit level or clinometer with an expected accuracy of better than 0.5m (e.g. 2.5% for a 20 m tree height) when the observer has a clear view of the tree being measured. Mean canopy height was taken as the average of the measured tree heights and used as reference data to assess the vertical accuracy of the InSAR derived vegetation canopy height of the single-/multi-pass derived hspc.
5. METHODS
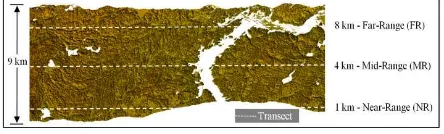
The X-HH InSAR DTM data were subtracted from both the single- and multi-pass datasets to derive vegetation canopy height given by the hspc (Figure 2). To investigate the effect of incidence angle on InSAR derived data, vegetation canopy heights were extracted from the single- and multi-pass hspc for each x-y in situ vegetation canopy height location, stratified by three incidence angles (NR = 35º, MR = 45º, FR = 55º), and by vegetation cover type (shrub, deciduous, coniferous, mixed and wetland). All height values were classified based on slope data to ensure that only those values that represented terrain slopes <10º were used; otherwise, the effects of incidence angle cannot be evaluated independently. Root mean square and mean errors were computed. To further investigate the effect of incidence angle on InSAR derived hspc, vegetation canopy heights represented by hspc values along three transects located 1 km (NR = 35º), 5 km (MR = 45º), and 9 km (FR = 55º) across single-data take swaths in the range direction (Figure 5) were extracted from the single and multi-pass datasets. These canopy height values were compared to each other using the absolute RMS difference (RMSD) and the absolute mean difference (MD). RMSD was calculated since neither the single- nor multi-International Archives of the Photogrammetry, Remote Sensing and Spatial Information Sciences, Volume XXXIX-B7, 2012
pass derived hspc along transect lines were considered as
Figure 5. Transect line (dashed line) positions in near-, mid-, and far-range for one strip of X-HH InSAR data.
6. RESULTS AND DISCUSSION
6.1 Vertical Accuracy of InSAR Vegetation Canopy Height
The results of the incidence angle analysis comparing the X-HH InSAR single- and multi-pass hspc data against in situ measurements of vegetation canopy height in flat terrain (<10°) stratified by vegetation class and incidence angle are presented in Tables 1-3 for all site data stratified by research site, vegetation type, and incidence angle class (NR, MR, FR).
Vegetation
Table 1. NEXTMap and single-data take X-HH InSAR-derived hspc error assessment against in situ vegetation canopy height for the Ely site, stratified by vegetation cover type and incidence angle range for <10ºterrain slope.
Vegetation Table 2. NEXTMap and single-data take X-HH InSAR-derived hspc error assessment against in situ vegetation canopy height for the International Falls site, stratified by vegetation cover type and incidence angle range for <10ºterrain slope.
Vegetation
Table 3. NEXTMap and single-data take X-HH InSAR-derived hspc error assessment against in situ vegetation canopy height for the Arizona site, stratified by vegetation cover type and incidence angle range for <10ºterrain slope.
The results for the multi-pass InSAR (NEXTMap), in most cases, supported the theory that in NR (steep incidence angles, e.g. = 35º) greater exposure of the lower vegetation canopy structure leads to greater canopy penetration, greater volume scattering if there is understory, or if little to no understory, greater double bounce, and a decrease in the amount of volume scattering contributions higher up in the canopy. This scenario results in a lower overall scattering phase centre height (hspc) or greater vegetation canopy height underestimation in the single-data take InSAR single-data. The opposite effect occurs in the FR, where at shallow incidence angles ( = 55º) there is an increase in more relative volume scattering from the upper canopy, little to no ground scattering contributions, resulting in more accurate vegetation canopy height estimates. The improvements from NR to FR were, however, minor, indicating that the multi-pass InSAR are not impacted by changes in incidence angle in flat terrain due to the aggregation of multiple flight line passes. In the case of the single-data take results, the theory did not hold through. In fact, in some cases the NR were better than the FR, and in most cases the MR were worse than both the NR and FR. Overall, however, the differences were not significant, indicating that that incidence angle range for flat terrain does not play a major role in the vegetation canopy height accuracy. Comparisons of the transect lines (Figure 5) are presented in the next section and help to explain a possible reason for the deviation from the expected theory.
6.2 Single and Multi-Pass X-HH InSAR Scattering Phase
Centre Height Comparison – Stratified by Incidence Angle
The results of the incidence angle analysis comparing transect lines that run parallel to the X-HH InSAR single-data take flight line strips (Figure 5) against the NEXTMap multi-pass X-HH InSAR in flat terrain (<10°) are presented in Table 4 for all site data combined and stratified by range class into NR, MR, and FR, respectively. The mean differences shown in Table 4 are all negative, meaning that on average, single-data take derived hspc was slightly lower than NEXTMap hspc. The RMSD decreased and R2 increased from NR to FR, indicating a greater correlation
between the single-pass InSAR and multi-pass InSAR with increasing incidence angle. When all data from the three sites were combined (Table 4), Single-pass hspc was more similar to NEXTMap data in the FR. The number of void samples (missing data due to decorrelation in InSAR phase) were less than 3% of the single-pass data sampled. An increase in void data samples is expected with spaceborne X-HH InSAR such as that derived from Tandem-X because there is a time lag between the TerraSAR and Tandem-X data.
# data takes) compared to NEXTMap X-HH InSAR (multi-pass) for all data combined, and averaged based on samples per site.
Given the difference in site characteristics, analysis were conducted per site (Tables 5-7), to determine if similar results angles for the Ely site, generated from single-pass X-HH InSAR compared to NEXTMap X-HH InSAR (multi-pass).
Angle # along transect lines of slopes <10° across NR and MR incidence angles (FR data were not available) for the International Falls InSAR compared to NEXTMap X-HH InSAR (multi-pass).
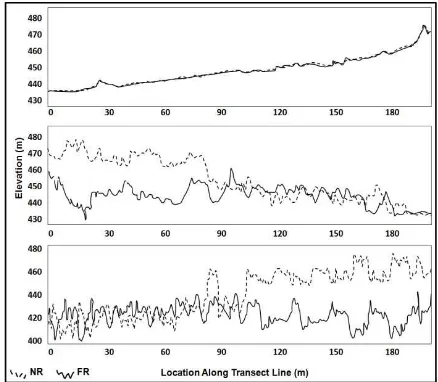
The mean differences shown in Tables 5-7 are all negative as in Table 4, meaning that on average, single-pass X-HH hspc was slightly lower than NEXTMap hspc. However, the effect of incidence angle on RMSD and R2 was site-dependent. The trend of an increase in agreement (decrease in mean difference) were more similar to the multi-pass data than were the MR data. These results were unexpected. Could this mean that X-HH InSAR derived hspc is sometimes closer to multi-pass data averaged data in the NR and sometimes closer in the FR? Additional information about how the multi-pass data were put together is needed to make this conclusion. One possibility could be that slight twisting along a single flight line (Figure 6) can occur due to the long flight lines of NEXTMap (up to 1,200 km long) and also place a role. Another is that it may be possible that at one site the multi-pass data stitched together NR or FR data in the same area, producing a multi-pass image that still shows a range effect. In other sites it is possible that the multi-pass data averages NR and FR data of the same pixels from different single-data take images.
Figure 6. Three examples of X-HH airborne flight line twisting. The top graph illustrates a strong correlation between the NR interferometric Synthetic Aperture Radar (InSAR) single- and International Archives of the Photogrammetry, Remote Sensing and Spatial Information Sciences, Volume XXXIX-B7, 2012
multi-pass derived hspc to estimate vegetation canopy height. In addition, accuracy of single- and multi-pass hspc as an estimate of vegetation height derived across three incidence angles (NR, MR, and FR) for five vegetation classes were compared against in situ measurements of vegetation canopy height. This was accomplished by a statistical analysis over vegetated land cover (shrub, deciduous, coniferous, mixed forest, and wetland) of diverse eco-regions (arid and temperate).
Commercially available X-band InSAR data products are rapidly being acquired for a large number of countries under the NEXTMap program and via the Tandem-X global mission, and so are becoming increasingly available to users. Further investigation using single-data take data is warranted to aid in the understanding of potential incidence angle effects in Astrium spaceborne Tandem-X data, which will have global coverage by 2015.
The InSAR side-looking geometry created additional errors in InSAR scattering phase centre height estimates of the single-data take single-data, and requires further investigation to better understand potential reasons for the vegetation canopy height underestimation at HH InSAR. Furthermore, although the X-HH InSAR NEXTMap scattering phase centre heights are strongly correlated with field-observed measurements, with the best accuracies found in the FR, tree heights are underestimated. Therefore, further calibration of scattering phase centre heights is required to provide better estimates of InSAR-derived vegetation canopy heights across all incidence angles.
The Tandem-X (e.g. X-band InSAR from space) mission is generating a consistent global digital surface model (DSM) with accuracy equalling or surpassing the HRTI-3 specification (12 m GSD, 10 m LE90%, and 3 m CE90%) for use in a host of applications (Krieger et al., 2007; Moreira et al., 2004). Multiple data-takes of these DSM data combined with an accurate elevation dataset may be used to, for example, derive a global vegetation canopy height model to improve biomass estimations to inform the United Nations REDD+ initiative (Reducing Emissions from Deforestation and Degradation) in support of climate change mitigation, and to assist forest management applications.
REFERENCES
Andersen, H. E., S. E. Reutebuch, and R. J. McGaughey, 2006. A Rigorous Assessment of Tree Height Measurements Obtained Using Airborne LIDAR and Conventional Field Methods, Canadian Journal of Remote Sensing, 32(5), pp. 355-366.
Andersen, H. -E., R. J. McGaughey, and S. E. Reutebuch, 2008. Assessing the influence of flight parameters, interferometric processing, slope and canopy density on the accuracy of X-band IFSAR-derived forest canopy height models, International Journal of Remote Sensing, 29(5), pp. 1495-1510.
Balzter, H., C.S. Rowland and P. Saich, 2007a. Forest Canopy Height and Carbon Estimation at Monks Wood National Nature Reserve, UK, using Dual-Wavelength SAR Interferometry, Remote Sensing of Environment, 108, pp. 224–239.
Balzter, H., A. Luckman, L. Skinner, C. Rowland, and T. Dawson, 2007b. Observations of forest stand top height and mean height from interferometric SAR and LiDAR over a conifer plantation at Thetford Forest, UK, International Journal of Remote Sensing, 28(6), pp. 1173-1197.
Chen, Q., 2010. Retrieving Vegetation Height of Forests and Woodlands Over Mountainous Areas in the Pacific Coast Region Using Satellite Laser Altimetry, Remotes Sensing of Environment, 114, pp. 1610 – 1627.
Izzawati, E. D. Wallington, I. H. Woodhouse, 2006. Forest Height Retrieval from Commercial X-band SAR Products, IEEE Transactions on Geoscience and Remote Sensing, 44, pp. 863–870.
Kellndorfer, J., W. Walker, L. Pierce, C. Dobson, J. A. Fites, C. Hunsaker, J. Vona, and M. C. Clutter, 2004. Vegetation Height Estimation from Shuttle Radar Topography Mission and National Elevation Datasets, Remote Sensing of the Environment, 93, pp. 339–358.
Krieger, G., A. Moreira, H. Fiedler, I. Hanhsek, M. Werner, M. Younis, and M. Zink. 2007. TanDEM-X: A Satellite Formation for High-Resolution SAR Interferometry, IEEE Transactions on Geoscience and Remote Sensing, 45(11), pp. 3317- 3341.
Mercer, B. 2001. Comparing LIDAR and InSAR: What Can You Expect? In: Fritsch/Spiller, eds. Proceedings of the Photogrammetric Week, Stuttgart, Germany, and pp. 2-10.
Moreira, A., G. Krieger, I. Hajnsek, M. Werner, D. Hounam, S. Riegger, and E. Settelmeyer, 2004. TanDEM-X: A TerraSAR-X Add-on Satellite for Single-Pass SAR Interferometry, IGARSS, pp. 1000–1003.
Olmsted, C., 1993. Alaska SAR Facility Scientific SAR User’s Guide, http://www.scribd.com/doc/20867410/Alaska-SAR- Facility-Scienti%EF%AC%81c-SAR-User%E2%80%99s-Guide-by-Coert-Olmsted.
Podobnikar, T., 2009. Methods for Visual Quality Assessment of a Digital Terrain Model, Surveys and Perspectives Integrating Environment and Society, 2(2): 19p.
Sexton, J. O., T. Bax, P. Siqueria. J. Swenson, and S. Hensley, 2009. Forest Ecology and Management, 257, pp. 1136–1147.
Simard M, K. Zhang, V. Rivera-Monroy, M. S. Ross, P. L. Ruiz, E. Castañeda-Moya, R. R. Twilley, and R. Rodriguez, 2006. Mapping Height and Biomass of Mangrove Forests in Everglades National Park with SRTM Elevation Data, Photogrammetric Engineering and Remote Sensing, 72(3), pp.299-311.
Treuhaft R. and P. Siqueira, 2000. Vertical Structure of Vegetated Land Surfaces from Interferometric and Polarimetric Radar, Radio Science, 35(1), pp. 141–177.
Walker, W. S., J. M. Kellndorfer, and L. E. Pierce, 2007. Quality assessment of SRTM C- and X-band interferometric data: Implications for the Retrieval of Vegetation Canopy Height, Remote Sensing of Environment, 106, pp. 428–448.
Woodhouse, I. H., S. Cloude, K. Papathanassiou, and C. Hutchinson, 2003. Evaluating PolInSAR Tree Height and Topography Retrievals in Glen Affric, ESA-ESRIN PolInSAR Workshop, Frascati.