Ž .
Aquaculture 186 2000 45–60
www.elsevier.nlrlocateraqua-online
ž
The impacts of grazing by tilapias Oreochromis
/
niloticus L. on periphyton communities growing on
artificial substrate in cages
Sylvain M.H. Huchette
a, Malcolm C.M. Beveridge
a,),1,
Donald J. Baird
a, Mark Ireland
ba
Institute of Aquaculture, UniÕersity of Stirling, Scotland FK9 4LA, UK
b
CAGES project, CARE Bangladesh, 65, road 7rA, Dhanmondi, Dhaka 1209, Bangladesh
Accepted 18 November 1999
Abstract
This study describes the development of periphytic communities established on artificial
Ž .
substrates in tilapia Oreochromis niloticus cages during a 10-week experiment conducted in the Meghna River, Bangladesh. Qualitative and quantitative characteristics of the periphyton were recorded, including diatom community composition and primary productivity. Fish grazed actively on the periphyton and there was a rapid fall in periphyton biomass following their introduction to
Ž .
the cages. Grazing significantly P-0.05 affected the horizontal and vertical periphyton biomass distribution over time. Tilapia showed only limited feeding selectivity, both animal and plant material being removed to an equal extent, although there was less ingestion of smaller particles.
Ž .
Fish grazing significantly P-0.05 reduced diatom diversity, mean diatom biovolume, the variability in standing periphyton biomass and the proportion of ash. Grazed periphyton communi-ties were younger, healthier and more productive. The significance of these findings for caged production of fish are discussed.q2000 Elsevier Science B.V. All rights reserved.
Keywords: Periphyton; Tilapias; Cages; Bangladesh; Grazing
1. Introduction
Periphyton, the term applied to the community of microorganisms that colonises plants, stones and other substrates in the littoral zone, is exploited in various traditional
)Corresponding author. 1
Permanent address: 46, rue du Vert Touquet, F-59 249 Fromelles, France. 0044-8486r00r$ - see front matterq2000 Elsevier Science B.V. All rights reserved.
Ž .
( ) S.M.H. Huchette et al.rAquaculture 186 2000 45–60
46
Ž .
fisheries that utilize ‘fish attractant devices’ FADs : for example, ‘acadja’ fisheries in
Ž .
West Africa Welcomme, 1972; Legendre et al., 1989 and ‘katha’ fisheries in
Ž .
Bangladesh MacGrory and Williams, 1996 . Laboratory studies by Dempster et al.
Ž1993, 1995. have demonstrated that algal ingestion rates by tilapias ŽCichlidae: .
Tilapiini are much greater when food is presented as a periphytic mat than when presented as plankton. However, attempts to exploit periphyton in aquaculture have given variable results. While the enhancement of periphyton biomass can significantly
Ž
increase fish production in extensive aquaculture systems e.g., Hem and Avit, 1991;
.
Norberg, 1999; Wahab et al., 1999a,b , the strategy seems less effective in more
Ž .
intensive types of tilapia culture Shrestha and Knud-Hansen, 1994 .
Questions thus remain about the viability of periphyton-based aquaculture systems. To some extent, this reflects the lack of knowledge about the periphyton community itself in aquaculture systems; how it responds to grazing, and, therefore, how to optimise management. This study, conducted in cages in the Meghna River, Bangladesh, set out to describe the characteristics and development of the periphyton community growing on artificial substrates established in floating cages used for tilapia culture and to describe the impact of fish grazing on the periphyton structure. Subsequent papers will deal with fish production and economics.
2. Material and methods
2.1. Study site and experimental design
The 10-week study, initiated on 6 March 1997, was conducted at the CARE-Bangla-desh experimental farm on the Meghna River, Baushia Ferry Ghat, 40 km east of Dhaka.
3 Ž 3.
Twelve 2.4 m floating cages 0.9=1.8=1.5 m , constructed from bamboo and fitted with a nylon net bag and top net, were established in a water depth of 3–4.5 m. Water quality at the site was acceptable from a tilapia culture point of view. Readings, made on
Ž .
six occasions during the experimental period, indicated mean "s.d. water temperature s29.5"0.38C; mean Secchi disc values128"5.7 cm; mean pHs7.2"0.1; mean
y1 Ž .
conductivity values128"3mS cm see also Section 2.2 below .
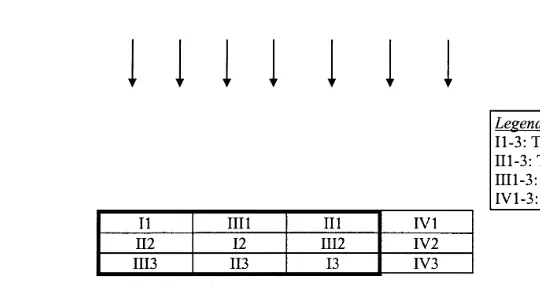
Cages were set out in a randomized block design to facilitate analysis of variance of the fish stomach contents, while the nine cages used to study the periphyton community were established in a latin square design because of the possible influence of wave
Ž . Ž .
action Fig. 1 . Although wave heights were small 3–11 cm , preliminary measure-ments, made by establishing changes in water level against a pole marked in centime-ters, showed significant differences depending upon the distance of the cage from the
Ž .
river bank Fs51.6; ns3; P-0.01 . In order to increase periphyton biomass, 77
Ž 2.
identical clear plastic mineral water bottles mean surface area per cages5.5 m were established in each of the nine cages. This compares with a submerged netting surface area of 9.1 m2. The bottles, which are cheap and widely available, were halved along
( )
S.M.H. Huchette et al.rAquaculture 186 2000 45–60 47
Fig. 1. Map of the experimental cage layout, showing treatments. Arrows indicate the principal wave direction. Cages in Latin square design are highlighted with a thicker black line.
and suspended from ropes strung across the cages. Five treatments were conducted in triplicate:
Ž . 3
Ø Treatment T1: 22 fish 30 g each per m , supplementary feed and added substrate;
Ž . 3
Ø Treatment T2: 22 fish 30 g each per m and added substrate;
Ø Treatment T3: control cages with added substrate only;
Ž . 3
Ø Treatment T4: 22 fish 30 g each per m , supplementary feed and no added substrate.
2.2. Monitoring of fish stocks and enÕironmental conditions
Ž .
Around 25% of fish Oreochromis niloticus in each treatment were sampled every 2
Ž .
weeks in order to determine weights Ohaus portable balance;"0.1 g and total lengths
Žmeasuring board;"1 mm . At final harvest, all fish were weighed and measured and.
the sex was determined.
Ž .
On each fish sampling occasion, water temperature thermometer; "18C , Secchi
Ž .
disc depth, both inside and outside cages, and conductivity Phillips conductivity meter were recorded.
2.3. Periphyton monitoring and sampling
Although dense periphyton communities were readily apparent within 2 weeks, stocking with fish was delayed for a further week to allow the periphyton to develop more fully. Periphyton biomass was determined immediately prior to stocking and at weeks 2, 4 and 7 after stocking. Six samples, one every 6 cm depth from the water surface, were taken from a single bottle at the centre of each cage. For identification
Ž .
purposes and in order to determine periphyton ash-free dry weight AFDW and
Ž 2.
( ) S.M.H. Huchette et al.rAquaculture 186 2000 45–60
48
from both sides of the bottles. Sampling reduced the surface area by 0.5% over the experimental period.
2.4. Periphyton biomass
Samples for AFDW determination were scraped from the sample pieces of plastic
Ž .
bottle and filtered through pre-washed 0.1 l deionised water , pre-weighed filters
ŽWhatman GFrC, 47 mm diameter . The filters were subsequently air-dried, sealed in.
Ž . Ž .
aluminium foil and stored in a cool 10–128C , dark place until processed -6 weeks .
Ž .
Standard methods APHA, 1992 were followed to determine sample AFDW and proportion of ash. Samples were dried to constant weight at 1058C, dry weight was
Ž .
determined Mettler Toledo balance, model AB 204;"0.1 mg , then ashed in a muffle furnace for 2 h at 5508C, and re-weighed to determine ash content.
Samples for chlorophyll-a and phaeopigment determination were taken from the plastic disc samples and filtered as described above. Filters were individually sealed in
Ž .
aluminium foil and immediately frozen Marker et al. 1980 until processed. Samples were transported on ice in a cool box to the laboratory where chlorophyll-a extraction
Ž .
was carried out as described in APHA 1992 . Each filter was introduced to a centrifuge
Ž
tube containing 5 ml 90% alkaline acetone solution 90% acetone and 10% saturated
.
magnesium carbonate solution and carefully ground for 1 min with a glass rod. Five milliliters of the alkaline acetone solution were then added to make 10 ml extract from each filter. The chlorophyll-a and phaeopigment contents were then determined
accord-Ž .
ing to the method described in Wetzel and Likens 1991 .
2.5. QualitatiÕe eÕaluation of periphyton
2.5.1. Identification and bioÕolume
Substrate samples for taxa identification purposes were taken immediately prior to stocking and at week 4 after stocking. Samples were placed in filtered water and Lugol’s
Ž .
iodine solution 1% added for preservation. Prior to analysis, the periphyton was carefully removed from the substrate with a scalpel blade. Algae were identified to
Ž .
Family level where possible, using Belcher and Swale 1976 . Diatoms were counted,
Ž .
sized and identified using both Cox 1996 and publications on Bangladesh microalgae
ŽChokder, 1967; Islam, 1974; Catling et al., 1981; Gafur and Uddin, 1992a,b; Wahab et
.
al., 1999a,b .
The periphyton community in each cage was sampled 1 day prior to stocking and 4 weeks after stocking. Samples for identification were collected from approximately 20 cm below the surface of the water in the centre of the cage. A minimum of 250
Ž .
unit-forming colonies of diatoms i.e., discrete cells or colonies from each sample was
Ž .
counted and identified using a microscope =200 and Sedgwick–Rafter cell. Diatom
Ž .
biovolumes were estimated from Wetzel and Likens 1991 . The mean total volume of the algae present in the periphyton community was then calculated in order to assess changes during the experimental period. The community was described according to
Ž .
( )
S.M.H. Huchette et al.rAquaculture 186 2000 45–60 49 Cluster analysis was carried out on the data of diatom community composition by sample date in order to discriminate by proportion of similarity. Detrended
correspon-Ž .
dence analysis and Kendal rank correlation CANOCO; Hill, 1979; Pen Braack, 1988
Ž
between the main axis and environmental factors i.e., stocking density, temperature,
.
time, sex-ratio, total biomass, light penetration was then performed on the data of periphyton community composition. This was performed on the data before and after stocking in order to identify the main factors determining periphyton community composition among treatments.
2.5.2. Primary productiÕity
Primary productivity of the bottle periphyton communities was determined twice during the experiment: before stocking with fish and approximately 5 weeks later. Experiments were conducted between 0930 and 1430 h to coincide with maximum solar radiation. Two plastic bottles in the middle of each cage were enclosed in Ziplocw
Ž .
plastic bags, as recommended in Aloi 1990 ; the volume of water in each bag being determined by measuring cylinder at the end of each experiment. One bagqbottle was left exposed to sunlight and the other was placed in a plastic box covered by several layers of thick aluminium foil in order to occlude light. Incubation was at a depth
Ž .
coinciding with the mid-point of the plastic bottles i.e., 0.3 m for only 20 min as preliminary experiments had shown oxygen super-saturation occurred in some samples after 30 min. Temperatures varied by -0.28C during incubation. Primary productivity
Ž .
was determined by measuring changes in dissolved oxygen DO concentration. On the
Ž .
first occasion, DO was determined by Winkler’s method APHA, 1992 in the field
Ž .
using a Hach kit model DREL 3500 , while on the second occasion, a YSI Oxygen
Ž .
Meter model 55 was used. Gross and net photosynthesis and respiration were
calcu-Ž .
lated using the equations of Wetzel and Likens 1991 :
Gross photosynthesis mg C m
Ž
y2hy1.
where O , IPB2 sinitial DO concentrations; O , CPB2 sDO concentration after
Ž .
incubation in the clear plastic bag; O , DPB2 sDO after incubation in the dark plastic
Ž
bag; PQsphotosynthetic quotient molecules of O2 liberated during
photosynthe-. Ž
sisrmolecules of CO2 assimilateds1.2 ; RQsrespiratory quotient CO2 liberated
. Ž
during respirationrmolecules of O consumeds2 1.0 ; 0.375sratio carbon–oxygen 12
. Ž . Ž .
mg Cr32 mg O ; ts2 period of incubation h ; Vcsvolume of the clear plastic bag l ;
Ž .
()
S.M.H.
Huchette
et
al.
r
Aquaculture
186
2000
45
–
60
50
Table 1
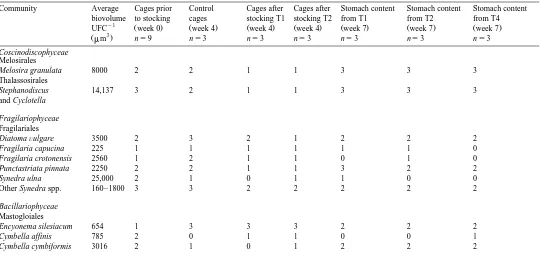
Specific composition and abundance index of the periphytic diatom communities on plastic bottles before and after grazing by tilapia. The table also shows stomach
Ž .
content analyses and the average biovolume of a unit forming colony UFC of each algal species
The abundance index is based on the following criteria : 1sspecies count -1% of the total number of UFC counted, 2sspecies count -10% UFC, 3sspecies count)10% UFC.
Community Average Cages prior Control Cages after Cages after Stomach content Stomach content Stomach content
biovolume to stocking cages stocking T1 stocking T2 from T1 from T2 from T4
y1 Ž . Ž . Ž . Ž . Ž . Ž . Ž .
UFC week 0 week 4 week 4 week 4 week 7 week 7 week 7
3
Žmm . ns9 ns3 ns3 ns3 ns3 ns3 ns3
Coscinodiscophyceae
Melosirales
Melosira granulata 8000 2 2 1 1 3 3 3
Thalassosirales
Stephanodiscus 14,137 3 2 1 1 3 3 3
and Cyclotella
Fragilariophyceae
Fragilariales
DiatomaÕulgare 3500 2 3 2 1 2 2 2
Fragilaria capucina 225 1 1 1 1 1 1 0
Fragilaria crotonensis 2560 1 2 1 1 0 1 0
Punctastriata pinnata 2250 2 2 1 1 3 2 2
Synedra ulna 25,000 2 1 0 1 1 0 0
Other Synedra spp. 160–1800 3 3 2 2 2 2 2
Bacillariophyceae
Mastogloiales
Encyonema silesiacum 654 1 3 3 3 2 2 2
Cymbella affinis 785 2 0 1 1 0 0 1
()
S.M.H.
Huchette
et
al.
r
Aquaculture
186
2000
45
–
60
51
Cymbella cistula 1319 0 1 1 2 0 0 0
Gomphonema spp. 194 2 3 3 3 3 3 3
Roicosphenia curÕata 7200 1 0 0 1 0 0 0
Naviculales
Diadesmis spp. 9000 2 1 0 0 1 1 0
Frustulia rhomboides 7000 0 1 1 0 0 0 0
Gyrosigma spencerii 2094 1 0 0 0 0 1 0
NaÕicula sleÕicensis 2309 1 0 0 0 0 0 0
NaÕicula spp. 141 2 2 2 2 2 2 2
Pinnularia spp. 3675 1 0 0 0 0 0 0
Thalassiophysales
Amphora spp. 589 2 2 3 3 2 2 2
Bacillariales
Bacillaria paradoxa 240 2 1 1 1 0 1 1
Nitzschia spp. 21–1173 3 3 2 3 2 3 2
Rhopalodiales
Epithemia sorex 126 2 0 0 0 0 0 0
Ropalodia gibba 1963 2 3 1 1 0 1 1
Ropalodia gibberula 262 1 0 0 0 0 0 0
Surirellales
Stenopterobia, Sigmatella 895 1 0 0 0 0 0 0
Surirela brebissioni 7069 1 1 0 1 0 1 0
Surirela capronii 339,292 1 0 0 0 0 0 0
( ) S.M.H. Huchette et al.rAquaculture 186 2000 45–60
52
( ) 2.5.3. Autotrophic index AI
The AI is a useful means of describing changes in periphyton communities between
Ž .
sampling dates APHA, 1992 . It was calculated as follows:
AIsBiomass AFDW ,mg m
Ž
.
y2rchlorophyll-a, mg my2Values )200 indicate heterotrophic associations andror the presence of non-viable organic material.
2.6. RemoÕal of periphyton by grazing: stomach contents analysis
Towards the end of the experiment, one fish from each cage was removed and killed and the stomach was removed by dissection. Stomachs were left in 10% formalin solution for 24 h, then transferred to a fixed volume of filtered water, the contents removed and thoroughly dispersed. A 1 ml sub-sample was then transferred by large-bore pipette to a Sedgwick–Rafter cell and a minimum of 150 diatom units were counted and identified. The composition of the stomach diatom community was then compared with that of the plastic bottle periphyton community in order to evaluate grazing selectivity.
3. Results
3.1. Periphyton analysis
3.1.1. Periphyton community composition
The periphyton communities on the plastic bottles and in the fish stomachs comprised micro- and macroorganisms from both animal and plant kingdoms. Attention was focused on the dominant diatom communities, although observations were also made on other periphytic organisms. Freshwater oligochaetes were often observed living on the bottles and, during observation of microalgae under the microscope, zooplankton, such
Ž .
as protozoa Amoebae , Rotifera and coelenterate hydrozoa, were frequently encoun-tered.
Diatoms, identified from both fish stomach contents and substrates, are summarised
Ž
in Table 1. Chlorophyceae Oocystis, Ankistrodesmis, Actinastrum, Pediastrum,
Spir-. Ž .
ogyra, Cladophora and Myxophyceae Anabaena, Nostoc, Tolypothrix represented a relatively high proportion of the periphyton community prior to fish stocking. After stocking, the filamentous algae became significantly reduced and proportionately more diatoms were apparent. After 4 weeks of grazing, the filamentous algae were found to be reduced to very short colony lengths and Ankistrodesmus spp. became abundant, forming bundles in both the cage periphyton communities and in the fish stomach contents.
Ž .
Nanoplankton -2–3 mm diameter , diatoms, algae and, in the cages where feed
Ž .
was given T1, T4 , feed particles, were abundant in the stomachs of all fish.
3.1.2. The diatom communities
( )
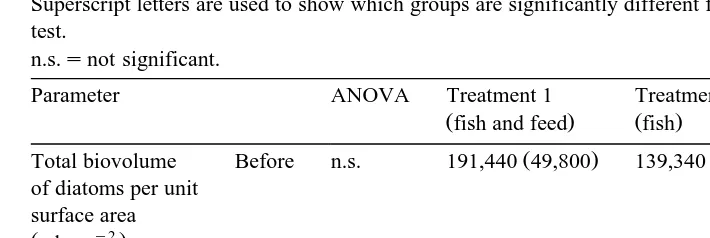
S.M.H. Huchette et al.rAquaculture 186 2000 45–60 53 Table 2
Ž .
Changes in mean biovolume per diatom unit and the total diatom biomass biovolume per unit area "s.d.
Ž . Ž . Ž .
before first line and 28 days after second line, italics stocking of fish O. niloticus
Superscript letters are used to show which groups are significantly different from each other, based on Tukey’s test.
n.s.snot significant.
Parameter ANOVA Treatment 1 Treatment 2 Treatment 3
Žfish and feed. Žfish. Žcontrol.
Ž . Ž . Ž .
Total biovolume Before n.s. 191,440 49,800 139,340 19,340 100,420 31,760 of diatoms per unit
surface area y2 Žml cm .
Ž . Ž . Ž .
After -0.05 15,370 2750 7550 1770 245,960 73,360
Ž . Ž . Ž .
Mean biovolume Before n.s. 4135 965 3509 1280 2706 1252
per diatom unit
a result of fish grazing Table 2 . Table 1 shows differences in diatom composition between treatments and over time. Larger diatom species such as Melosira spp. or Cycotella spp. were more represented in proportion than the smaller ones in the stomach of the fish. They were also less represented in proportion on the grazed substrates. The mean diatom biovolume of grazed substrates was significantly smaller than those of
Ž .
ungrazed substrates Table 2 . Moreover, mean biovolume per diatom unit in the fish stomachs was 4925"2209mm3, compared with values of -2421"455mm3 in the
Ž .
periphyton, and did not vary significantly among treatments P)0.05 .
3.1.3. Diatom community diÕersity
A cluster analysis was first carried out on diatom community composition data of all samples in order to assess species composition differences among treatments. The results are shown in Fig. 2. Four groups can be readily distinguished on the basis that they share less than 40% similarity with each other: the diatom communities on bottles in the cages before stocking, the diatom community on the grazed bottles, the diatom commu-nity recovered from the fish stomachs and the diatom commucommu-nity on ungrazed bottles 4 weeks after the beginning of the experiment. The analysis clearly demonstrates that grazing affects periphyton community diversity. In the control cages, the periphyton community before and after stocking shows only 50% similarity. The biodiversity seems to decrease significantly over time.
( ) S.M.H. Huchette et al.rAquaculture 186 2000 45–60
54
Fig. 2. Cluster analysis showing percentage similarities of diatom species composition from samples from
Ž .
bottles and stomachs of the fish O. niloticus grazing on these communities. Numbers refer to treatment and
Ž .
replicate within treatment e.g., III2 — treatment 3, cage 2 . Sample dates are given alongside community description. Groups are segregated if they show less than 40% similarities with others. The asterisk is used to mark the cages before stocking.
Ž0.489 shows this is a strong trend that can be used with confidence to describe the.
data.
A Kendal rank correlation was carried out between the environmental parameters
Žstocking density, biomass, average weight, Secchi disc values, temperature, amount of
.
( )
S.M.H. Huchette et al.rAquaculture 186 2000 45–60 55
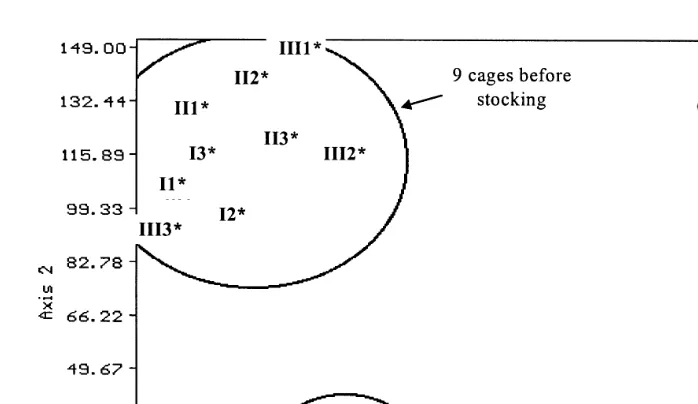
Fig. 3. Graphic representation of the detrended correspondence analysis carried out on the diatom communities established on the plastic bottles in the cages before and after stocking. Numbers refer to treatment and
Ž .
replicate within treatment e.g., III2 — treatment 3, cage 2 . The asterisk is used to mark the cages before stocking.
by the axis. Axis 1, differentiating the stocked cages from the others, was highly correlated with stocked biomass, mean fish weight and stocking density.
The periphytic diatom communities were strongly affected by the presence of fish. Although Axis 1 is also moderately correlated with the amount of feed given, it does not significantly affect the composition of the diatom communities as the treatments cannot be readily segregated from each other. Axis 2 shows a high correlation with time, reflecting the fact that the ungrazed diatom communities change over time. Axis 2 also shows a moderate correlation with temperature, Secchi disc value and fish sex-ratio. However, as with supplementary feed, those effects did not significantly affect diatom community composition.
3.2. Primary productiÕity
The gross carbon production of the grazed periphyton community was significantly
Ž .
lower than that protected from grazing Table 3 . The proportion of photosynthetic activity due to periphytic phytoplankton appeared to remain the same, irrespective of whether grazed or not.
3.3. Chlorophyll-a, phaeopigments, AFDW and ash content
( ) S.M.H. Huchette et al.rAquaculture 186 2000 45–60
56 Table 3
Ž .
Primary production rates including gross carbon production and percentage respiration "s.d., ns3 of the
Ž . Ž
periphyton community in different treatments on two occasions before first line and 28 days after second
. Ž .
line stocking of fish O. niloticus
Superscript letters indicate which groups are significantly different from each other, based on Tukey’s test.
Parameter ANOVA Treatment 1 Treatment 2 Treatment 3
Žfish and feed. Žfish. Žno fish.
Ž . Ž . Ž .
Gross carbon Before n.s. 1.30 0.65 1.95 0.92 1.03 1.00
production y2 y1 Žmg C cm h .
aŽ . aŽ . bŽ .
After P-0.05 1.41 0.95 1.45 0.31 3.30 0.47
Ž . Ž . Ž .
Percentage Before n.s. 72.0 11.9 63.5 19.5 39.9 8.5
respiration
Ž . Ž . Ž .
After n.s. 29.7 23.5 33.8 12.3 32.8 9.6
Ž .
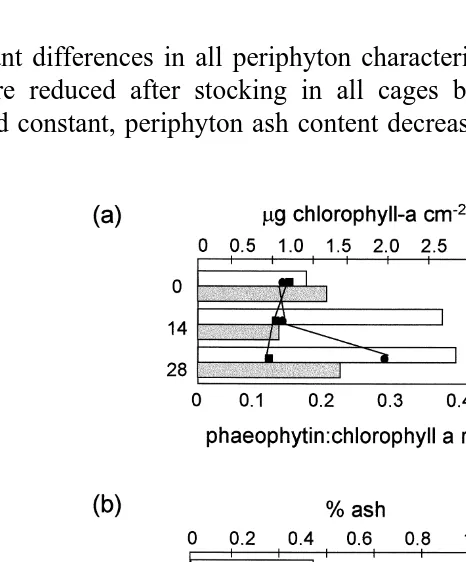
significant differences in all periphyton characteristics Table 4 prior to stocking with fish were reduced after stocking in all cages but those of the controls. While AIs remained constant, periphyton ash content decreased over the experimental period.
Ž . Ž . Ž .
Fig. 4. Development of a chlorophyll-a and phaeophyton, b ash-free dry weight AFDW and proportion of
Ž . Ž .
( )
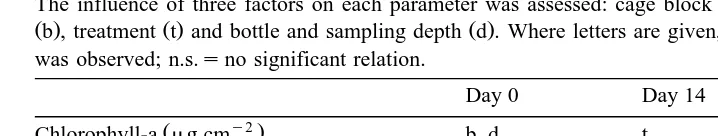
S.M.H. Huchette et al.rAquaculture 186 2000 45–60 57 Table 4
Multifactor analysis of variance of five parameters assessing the periphyton qualities in the cages on three
Ž .
occasions during the experiment ns162
Ž .
The influence of three factors on each parameter was assessed: cage block distance from shore; see Fig. 1
Ž .b , treatment t and bottle and sampling depth d . Where letters are given, a significant relation PŽ . Ž . Ž -0.01.
Autotrophic index defined in text d n.s. n.s.
Ž .
The ratio of oxygen respired to gross oxygen production Table 3 was used to assess the importance of organisms other than algae in the periphyton community. The ratio did not vary significantly among treatments, suggesting that the communities comprised similar proportions of primary producer to primary consumer, whether grazed or not. Therefore, the removal of animals from the periphyton community by grazing appeared to occur in the same proportion as the removal of phytoplankton.
Ž .
Periphyton chlorophyll and AFDW changed over time Table 4 . Prior to stocking, variations in biomass were the same, irrespective of block distribution, treatment or depth, and may be explained by differences in such environmental variables as exposure, current, light or nutrients. After stocking, variation in biomass distribution fell due to treatment effects. Periphyton characteristics showed an increasing difference in variance between treatments over time. The variance in the control cages increased whilst that in the cages stocked with fish remained the same.
4. Discussion
The periphyton diatom communities were observed to evolve over time, with marked changes in species abundance. Initially, the diatom communities on the bottles in the control treatment cages were dominated by Stephanodiscus spp., Cyclotella spp. and Nitzschia spp. After 4 weeks, these species represented less than 10% of the community by number, the community then being dominated by E. silesiacum, Gomphonema parÕulum and R. gibba. Recent studies of periphyton-based aquaculture in ponds in
Ž .
Bangladesh by Wahab et al. 1999a,b found similar patterns of evolution among the algal component of the phytoplankton community.
Fish grazing, however, had an even greater impact on periphyton community composition than time. Total diatom biovolume per unit substrate area significantly reduced over time, the smaller diatoms increasing in abundance, while the larger
Ž .
diatoms decreased Table 2 . The spectrum of algal species recovered from fish
Ž .
( ) S.M.H. Huchette et al.rAquaculture 186 2000 45–60
58
Ž .
found in the periphyton Table 1 , suggesting selective grazing by the fish. The composition of diatoms found in the tilapia stomachs was unaffected by supplementary
Ž .
feeding or added substrates Fig. 2 . The composition was also similar to that found by
Ž .
Getachew 1993 in Nile tilapia stomachs in Ethiopian lakes, suggesting that the substrates in the cages in the present trial provided appropriate food for this species.
The diatom community on the bottles prior to stocking showed the greatest species diversity. Four weeks after stocking the treatment cages, diversity had decreased, although it remained unchanged in the control cages. In pond-based periphyton trials,
Ž .
Wahab et al. 1999a,b found little evidence of changes in periphyton diversity at the genus level, presumably because grazing intensity was less because of the much higher amounts of periphyton substrate provided in relation to fish biomass. Diatom species diversity in the fish stomachs in cages both with and without substrate was higher than on the plastic bottles. Nanoplankton were found in the fish stomachs, but not in the periphyton samples. Thus, the caged tilapias were probably ingesting algae from sources other than the plastic bottle and we may suppose that the other sources may be the cage
Ž .
nets and the algae obtained from filtering activity Fig. 2 . In studies of indigenous
Ž .
cyprinids stocked in ponds with substrates and periphyton, Wahab et al. 1999a,b also found food items other than periphyton present in the stomachs.
The ash content of grazed periphyton community samples was lower than that of
Ž .
ungrazed Fig. 4 . The variation in ash content of the periphyton may also have been linked to the concentrations of suspended silt in the water column, confirmed by increasing Secchi disc readings. The AFDW of the grazed periphyton decreased throughout the experiment, suggesting that the fish were removing all growth increments in periphyton standing biomass and this is supported by the fact that the biomass of the
Ž .
ungrazed periphyton communities remained significantly higher over time Fig. 4 . The chlorophyll-a values showed similar trends to those observed in AFDW data
ŽFig. 4 . However, chlorophyll-a content is also a measure of productivity. Chlorophyll-a.
quality was assessed by the proportion of phaeopigment present, the phaeopigments being degradation products of chlorophyll-a and more abundant in senescent algae
ŽWetzel and Likens, 1991 . After 2 weeks, ungrazed periphyton contained at least three.
times more chlorophyll than grazed periphyton, suggesting higher productivity. How-ever, when left ungrazed for longer time, the proportion of phaeopigments increased significantly. Grazed periphyton chlorophyll-a levels remained constant throughout the experiment, while the proportion of phaeopigment decreased steadily, suggesting an
Ž .
increase in production per unit biomass PrB ratio and a rejuvenation of periphyton cells.
Ž .
The AI showed no significant difference between treatments Fig. 4 . The AI was found to vary significantly with sampling depth prior to stocking the fish, but differences disappeared after stocking. AI values remained around 300, suggesting a highly hetero-trophic community and confirming conclusions that the fish graze on both plants and animals.
( )
S.M.H. Huchette et al.rAquaculture 186 2000 45–60 59 can be maximised under a given set of environmental conditions. Productivity per unit
Ž .
substrate area is highest at intermediate grazing levels Lamberti and Moore, 1984 . However, grazing may result in a change in species composition towards less nutritious types. Future work should focus on how to maximise the rate of production of nutritious food. Alternative substrates should be tested: the use of rougher substrates may help prevent over-grazing. The energy and protein content and digestibility of periphytic material should be investigated. Finally, increasing the surface of substrates in cages would reduce grazing pressure per unit surface area. In a recent study conducted in Lake
Ž . Ž .
Kariba, Zimbabwe, Norberg 1999 estimated only marginal 1% increases in growth
Ž
and production of caged tilapias mean weight 95 g; mixed population of O. mortimeri wTrewavas , O. niloticus and Tilapia rendalli Boulengerx w x. attributable to periphyton growing on the nets. It nevertheless remains to be demonstrated whether periphyton grazing is a significant and cost-effective means of increasing food supply for produc-tion of tilapia fry and fingerling stages in cages.
Acknowledgements
We thank the DFID Aquaculture Research Programme for making available the funds
Ž .
for the present study and EC INCO PAISA Project ERB 3514 PL 961860 under whose auspices data analyses were completed. We thank the staff of CARE-Bangladesh CAGES project, and DFID, Bangladesh, for their cooperation and technical assistance throughout the trial period. Special thanks are due to Narunnabi and the technical staff of the experimental farm. We are grateful to the staff at the Faculty of Fisheries, BAU, for providing access to their laboratory facilities. Discussions with Marc Verdegem, University of Wageningen, Jon Norberg, University of Stockholm, and our colleague Trevor Telfer, proved useful.
References
Aloi, J.E., 1990. A critical review of recent freshwater periphyton field methods. Can. J. Fish. Aquat. Sci. 47, 656–670.
APHA, 1992. Standard Methods for the Examination of Water and Wastewater. 22nd edn. American Public Health Association, Washington.
Belcher, H., Swale, E., 1976. A Beginner’s Guide to Freshwater Algae. Institute of Terrestrial Ecology, Natural Environment Research Council, London.
Catling, H.D., Martinez, M.R., Islam, Z., 1981. Survey of algae associated with deepwater rice in Bangladesh. Cryptogam.: Algol. 11, 109–121.
Chokder, A.H., 1967. Fresh water algae of East Pakistan. Agric. Pak. 18, 231–260.
Cox, E.J., 1996. Identification of freshwater diatoms from live material. Chapman & Hall, London. Dempster, P., Baird, D.J., Beveridge, M.C.M., 1995. Can fish survive by filter-feeding on microparticles?
Energy balance in tilapia grazing on algal suspensions. J. Fish Biol. 47, 7–17.
Ž .
Dempster, P.W., Beveridge, M.C.M., Baird, D.J., 1993. Herbivory in the tilapia Oreochromis niloticus L. : a comparison of feeding rates on periphyton and phytoplankton. J. Fish Biol. 43, 385–392.
Gafur, M.A., Uddin, M., 1992a. Algal flora of Chittagong university campus: II. Cyanophyceae. Science 16
( ) S.M.H. Huchette et al.rAquaculture 186 2000 45–60
60
Gafur, M.A., Uddin, M., 1992b. Algal flora of Chittagong university campus: I. Chlorophyceae. Science 16
Ž .2 , 17–25, Chittagong University Studies, Part II.
Getachew, T., 1993. The composition and nutritional status of the diet of Oreochromis niloticus in Lake Chamo, Ethiopia. J. Fish Biol. 43, 865–874.
Guiral, D., Arfi, R., Da, K.P., Konan-Brou, A.A., 1993. Communautes, biomasses et productions algales au´
Ž .
sein d’un recif artificiel´ acadja en milieu lagunaire tropical. Revue d’Hydrobiologie Tropical 26, 219–228.
Ž .
Hem, S., Avit, J.L.B., 1991. In: First results on ‘acadja-enclos’ bamboo reefs used as an extensive
Ž .
aquaculture system, Cote d’Ivoire West Africa . Proceedings of the Fifth International Conference on Aquatic Habitat Enhancement, Long Beach, California, 3–7 November 1991. p. 17.
Hill, M.O., 1979. DECORANA — a FORTRAN Program for detrended correspondence analysis and reciprocal averaging. Ecology and Systematics, Cornell University, New York.
Islam, A.K.M.N., 1974. Preliminary studies on the food of some fish. Dacca University Studies 12, 47–51. Lamberti, G.A., Moore, J.W., 1984. Aquatic insects as primary consumers. In: Resh, V.H., Rosenberg, D.M.
ŽEds. , The Ecology of Aquatic Insects. Praeger Scientific, New York, pp. 164–195..
Legendre, M., Hem, S., Cisse, A., 1989. Suitability of brackish water tilapia species from Ivory Coast for lagoon aquaculture: II. Growth and rearing methods. Aquatic Living Resources 2, 81–89.
MacGrory, J., Williams, D., 1996. Katha Fishing: Economics, Access Patterns and Potential Conflicts with Fish Cage Culture. CARE-Bangladesh, Dhaka, Bangladesh.
Marker, A.F.H., Nusch, E.A., Rai, H., Riemann, B., 1980. The measurement of photosynthetic pigments in freshwaters and standardization of methods: conclusions and recommendations. Archiv fur Hydrobiologie Beihtrag 14, 91–106.
Norberg, J., 1999. Periphyton fouling as a marginal energy source in tropical tilapia cage farming. Aquacult. Res. 30, 427–430.
Ž .
Pen Braack, C.J.F., 1988. Partial canonical correspondence analysis. In: Bock, H.H. Ed. , Classification and Related Methods of Data Analysis. North Holland, Amsterdam.
Shrestha, M.K., Knud-Hansen, C.F., 1994. Increasing attached microorganism biomass as a management
Ž .
strategy for Nile tilapia Oreochromis niloticus production. Aquacult. Eng. 13, 101–108.
Wahab, M.A., Azim, M.E., Ali, M.H., Beveridge, M.C.M., Khan, S., 1999a. The potential of periphyton-based culture of a native major carp calbaush, Labeo calbasu Hamilton. Aquacult. Res. 30, 409–420. Wahab, M.A., Mannan, M.A., Huda, M.A., Azim, M.E., Tollervey, A., Beveridge, M.C.M., 1999b. Effects of
Ž
periphyton grown on bamboo substrates on growth and production of Indian major carp rohu Labeo
.
rohita Ham. . Bangladesh J. Fish Resour. 3, 1–10.
Welcomme, R.L., 1972. An evaluation of the acadja methods of fishing as practiced in the coastal lagoons of
Ž .
Dahomey West Africa . J. Fish Biol. 4, 39–45.