Sources and sinks of ammonia within an oilseed rape canopy
Eiko Nemitz
a,b,∗, Mark A. Sutton
a, Andreas Gut
c,
Roberto San José
d, Søren Husted
e, Jan K. Schjoerring
eaCentre for Ecology and Hydrology (CEH), Edinburgh Research Station, Bush Estate, Penicuik, Midlothian EH26 0QB, UK bUniversity of Manchester Institute of Science and Technology (UMIST), PO Box 88, Manchester M60 1QD, UK
cInstitute for Environmental Protection and Agriculture (FAL/IUL), 3003 Liebefeld-Bern, Switzerland dPolytechnical University of Madrid (UPM), Institute for Computer Sciences, Madrid, Spain eCentre for Ecology and Environment, Royal Veterinary and Agricultural University (RVAU),
Thorvaldsensvey 40, Frederiksberg C, Copenhagen, Denmark
Received 1 February 1999; received in revised form 19 May 2000; accepted 20 June 2000
Abstract
Within-canopy profiles of ammonia (NH3) and measurements of the canopy turbulence characteristics were used to calculate
the vertical source/sink density profile of NH3and sensible heat in a mature oilseed rape (Brassica napus) canopy. For the
analysis, the inverse Lagrangian technique (ILT) based on localized near-field theory was used. Turbulence was measured with a standard ultrasonic anemometer, which, although not ideal for in-canopy work, is estimated to lead to a parameterization of the normalized standard deviation of the vertical wind component(σw/u∗), which is±11% accurate for heights >0.16 m
during the day.
The NH3 profiles in the canopy consistently show largest concentrations at the ground caused by NH3 release from
decomposing litter leaves on the ground surface with values of up to 150 ng m−2s−1 predicted by the ILT. The inverse
Lagrangian source/sink analysis performs well for both sensible heat and NH3, although it proves to be sensitive to the
choice of the source/sink layers and becomes uncertain at the ground. Despite the large estimated ground level emission (26 g NH3-N ha−1per day), the analysis indicates that for the runs considered all NH3is recaptured by the lowest 0.7 m of
the 1.38 m tall canopy, and that the bi-directional net exchange with the atmosphere is governed by the top 0.5 m, leading to a net emission from the canopy of 12 g NH3-N ha−1per day. Since measurements of apoplastic [NH4+] and pH indicate that
no significant stomatal emission from foliage should have occurred, this suggests that the siliques were a further source of NH3. © 2000 Elsevier Science B.V. All rights reserved.
Keywords: Ammonia exchange; Inverse Lagrangian technique; Localized near-field theory; Brassica napus; Canopy layer turbulence; Within-canopy profiles; Source/sink distribution
∗Corresponding author. Present address: Centre for Ecology
and Hydrology (CEH), Edinburgh Research Station, Bush Estate, Penicuik, Midlothian EH26 0QB, UK. Tel.:+44-131-445-4343; fax:+44-131-445-3943.
E-mail address: [email protected] (E. Nemitz).
1. Introduction
Ammonia has been recognized as one of the major atmospheric pollutants with impacts on atmospheric chemistry, soil acidification and eutrophication of ecosystems, as discussed in detail elsewhere (Pear-son and Stewart, 1993; Sutton et al., 1993a). In
386 E. Nemitz et al. / Agricultural and Forest Meteorology 105 (2000) 385–404 quantifying the net exchange with different ecosystem
types it is an important pre-requisite to improve the mechanistic understanding of the exchange processes as well as to identify the main pathways of NH3 exchange. Earlier studies have shown the NH3 exchange above agricultural crops such as wheat and barley to be bi-directional, with absorption through leaf stomata and deposition to water films on the leaf cuticle (e.g. Sutton et al., 1995). Periods of day-time emission usually originate from an ammonium concentration ([NH4+]) in the apoplastic intercellu-lar fluid (Farquhar et al., 1980; Sutton et al., 1995). Knowledge of the physical sites of NH3exchange and the vertical distribution of sources and sinks within the plant canopy can greatly assist the characterization of the main pathways necessary for the development of generalized resistance models (Baldocchi et al., 1987; Sutton et al., 1995; Nemitz et al., 2000a).
The mechanisms of NH3 exchange were studied during the North Berwick experiment carried out over oilseed rape (Brassica napus) in June 1995 as part of the EC ‘EXAMINE’ project. Both the set-up and ob-jectives of the experiment were described by Sutton et al. (2000a), whereas the NH3fluxes were reported by Sutton et al. (2000b). As a component of this study, this paper examines the within-canopy cycling pro-cesses of NH3in an oilseed rape canopy. The vertical distribution of sources and sinks within the canopy is derived from direct measurements of both the NH3 concentration profile and the turbulence within the canopy, using the inverse Lagrangian technique (ILT) by Raupach (1989a). Since the different height-layers may be identified with characteristic plant parts (leaf litter, senescent and live leaves, seed cases), this allows their role in the net exchange to be quantified, together with the origin of NH3emission frequently found dur-ing the campaign. The results were incorporated into multi-layer resistance models, which could be used then to quantify component fluxes during conditions when in-canopy profiles were not measured (Nemitz et al., 2000a; Sutton et al., 2000a). For this integrated field campaign, source/sink distributions can be com-pared with independent plant-physiological estimates of the stomatal emission potential, derived from ex-tractions of the apoplastic fluid at different heights (Husted et al., 2000).
In a pioneering study, Denmead et al. (1976) de-rived source- and sink-densities of NH3 within a
grass-clover canopy from concentration profiles, using the simplification that the transport within canopies is purely diffusive. However, more recent research has led to a quantification of non-diffusive transport mechanisms within plant canopies (Finnigan, 1979; Raupach, 1987; Denmead, 1995). Raupach (1989a,b) has incorporated these effects into an ILT based on the ‘localized near-field’ (LNF) theory. This technique is employed here to derive the diffusion matrix that relates the (one-dimensional) scalar field of 4–14 mea-sured concentrations (χi) in the canopy to that of the source (or sink if negative) densities (Sj). Diffusion within the plant canopy needs to be described based on the parameterization of the standard deviation of the vertical wind component (σw) and the Lagrangian time-scale (TL). Whereas the latter was taken from existing parameterizations (Raupach, 1989a), the first was obtained from turbulence measurements at different heights in the plant canopy.
In the following section of this paper, the ILT is out-lined with a detailed description of its implementation in Appendix A. The paper continues with a descrip-tion of the measurements of NH3concentrations and canopy turbulence including quality assessment of the turbulence data. The results of the turbulence mea-surements and example profiles of NH3are then pre-sented, before the ILT is first applied to sensible heat (as a performance test) and finally to NH3. Uncertain-ties in both the measurements and the applicability of the ILT are discussed, together with the implications of the findings for the quantification of NH3exchange over oilseed rape.
2. Theory of the inverse Lagrangian technique using ‘localized near-field theory’
concentrations can be related to each other by a dispersion matrix (D), which consists of the matrix elements Dij that describe the contribution of source layer zSj to the concentration at zχi. In vector for-mat, this relationship can be written as a linear (n,
m)-system:
χ−χ
ref=DS (1)
In the simple case ofm=n, this linear system can be solved for concentrations (forward problem) or source strengths (inverse problem), whereas form < nan ap-proximation method can be used to find the best fitting values of Sj (see Appendix A). The dispersion ma-trix can be formed according to any transport theory that can be appropriately applied to plant canopies. Raupach (1987) showed that only a part of the concen-trations measured within canopies is the result of dif-fusive transport and follows the classical flux–gradient relationship that is applied to derive the net exchange above canopies
Fχ(z)= −KH(z, L) ∂χ
∂z (2)
Here Fχ is the flux of tracer χ, z the height and
KHthe turbulent eddy diffusivity, which is a function of height and thermal stratification, expressed by the Monin–Obukhov length (L). In canopies, where the length scale of the turbulent transport is of the or-der of hcor larger, the transfer is determined through persistent coherent (non-diffusive) eddy motions as well as through diffusive transport by eddies small in comparison with hc. Following Raupach (1989a), this ‘near-field’ effect of persistence dominates as long as the travel time of a released entrained property is smaller than the Lagrangian integral time-scale (TL). Hence in plant canopies, pure Eulerian (fixed-point) diffusive theory, as applied by Denmead et al. (1976), must be expected to lead to erroneous results. More ac-curate results are obtained using numerical Lagrangian (fluid following) stochastic dispersion models which track the motion of small quantities of the entrained property, visualized as ‘marked particles’ (e.g. Flesch and Wilson, 1992). Raupach (1989a,b) presented an analytical approximation to the Lagrangian approach, which is applied here.
The probability to find a ‘marked particle’ at zχi is subject to both a persistence governed ‘near-field contribution’ (χnear) and a diffusion governed
‘far-field contribution’ (χfar) so that the total concen-tration (χi) can be written as the sum of both
χi =χinear+χ far
i (3)
For the far-field, the classical flux–gradient relation-ship of Eq. (2) is a close approximation if the usual conditions (extensive horizontal homogeneity and sta-tionarity) are fulfilled. The integration of Eq. (2) be-tween the limitszχi andzref yields an expression for the far-field contribution:
The height dependent flux Fχ(z) can be calculated as the integral over the source and sink layers:
Fχ(zχi )= Z zχi
0
S(z)dz (5)
and the eddy diffusivity (KH) within the canopy is given by
KH =σw2TL (6)
Raupach (1989b) derived a ‘near-field kernel function’ of a variable (ς) which represents the non-diffusive ‘near-field’ contribution to the concentration as
kn(ς ) = −0.39894 ln(1−exp(−|ς|))
−0.15623 exp(−|ς|) (7)
Using this function, it can be shown that the near-field concentration is given by
388 E. Nemitz et al. / Agricultural and Forest Meteorology 105 (2000) 385–404 van den Hurk and McNaughton, 1995). Raupach’s
LNF theory has been successfully applied to fluxes of CO2and water vapour (Denmead, 1995; Katul et al., 1997).
Apart from the concentration profile, a description of the turbulence characteristics in the oilseed rape had to be obtained. Naturally, the Lagrangian time-scale (TL) cannot be measured by one instrument fixed in space and here existing parameterizations had to be used. Below the canopy height, Raupach (1989a) sug-gested a height constant parameterization of TL = 0.3hc/u∗, where u∗ is the friction velocity as
mea-sured well above the canopy. Since it appears that no parameterizations of the standard deviation of the ver-tical wind component (σw) have been presented in the literature, that are readily applicable or at least trans-ferable to oilseed rape canopies, σw(z) was directly measured in the rape canopy.
3. Methods
3.1. Measurements of gas concentrations within the canopy
The ammonia concentrations were measured with two independent techniques, continuous wet denuder systems (‘AMANDA’, ECN, Petten, NL; see Wyers et al., 1993) and filter-packs, which are described in more detail by Sutton et al. (2000b). Twice during the main 3-week campaign (14–15 and 21–22 June), four of the six denuder inlets were placed at heights of 0.04, 0.2, 0.5 and 1 m above ground within the oilseed rape canopy (hc = 1.38 m), whereas two additional inlets were used to measure the net flux above the canopy (1.68 and 3.32 m above the ground). Although the AMANDA systems represent the state-of-the-art of high precision NH3 air concentration measurements, the use of two separate conductivity cells to analyse the collection solution of the six denuder inlets on-line, made it necessary to cross calibrate the two three-point systems and to apply correction factors where neces-sary.
For individual runs (approximately 2 h) three-stage 90 mm filter-packs were used to yield the NH3 concentration at another up to 10 heights. Seven-teen within-canopy filter-pack runs were carried out during on 14 June (12:00–20:00 GMT), 15 June
(05:00–20:00 GMT), 19 June (14:00–20:30 GMT) and 21 June (12:00 GMT) to 22 June (14:00 GMT). The filter-packs contained a PTFE particle filter, a basic filter for capturing HCl and HNO3 as well as an H3PO4 impregnated filter for capturing NH3(see also Nemitz et al., 2000b).
For one 7-day run, 40 passive NH3 samplers (Blatter et al., 1992) were buried 0.02 m deep into the soil and long-term canopy profiles were measured at three heights within the canopy (0.02, 0.64 and 1.32 m). The concentration at each height was obtained at two different locations with sets of four passive samplers that were placed in a common housing with a membrane at the bottom. The passive samplers in the ground were individually covered by membranes to prevent intruding soil from reducing the diffusion distance. The passive samplers themselves consist of a pool of 0.5 mM HCl with 20% ethyleneglycol, which is separated from a 7.0 mm diffusion path by a polypropylene membrane. Analysis of the passive samplers was carried out on a flow injection anal-yser (FIA) using the method by Genfa and Dasgupta (1989).
3.2. Measurements of profiles of turbulence and temperature:time series analysis
The adequacy of the turbulence measuring system was estimated by the assessment of the power spec-tra of the vertical wind component for the measure-ment at different heights. Data conditioning included coordinate rotation such that the arithmetic means of the vertical (w) and lateral (v) wind components van-ished, linear detrending of 214 data points (approxi-mately 13 min) and windowing using a Welch window (e.g. Stull, 1988). Discrete energy spectra were calcu-lated from overlapping 13 min periods by ‘fast Fourier transform’ (Press et al., 1989) and subsequent energy spectra were averaged. The energy spectra were exam-ined and the variance of the vertical wind component (σw2) calculated as the sum of the discrete values.
To assess the performance of the ILT with an en-tity easier to measure than NH3, a temperature profile was recorded on 22 June at four heights within the canopy using standard K-type thermocouples and at two heights above the canopy, using ultra-fine 0.3 mm E-type thermocouples to minimize radiative heating (Campbell Scientific, Loughborough, UK).
4. Results and interpretation
4.1. The turbulence in an oilseed rape canopy
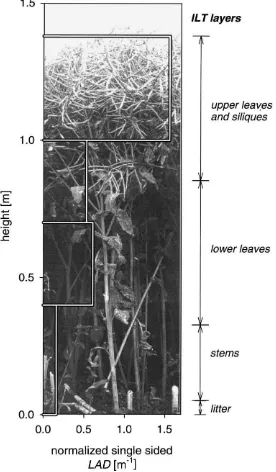
The cross-section through the canopy as well as the normalized single sided leaf area density (LAD) are presented in Fig. 1. The siliques (seed cases) of the up-per part of the canopy were interwoven with each other and formed a dense and rigid structure. In contrast, the lowest part of the canopy consisted of virtually leafless stems and the leaf area index declined rapidly towards the ground. Hence the profile ofσw/u∗should
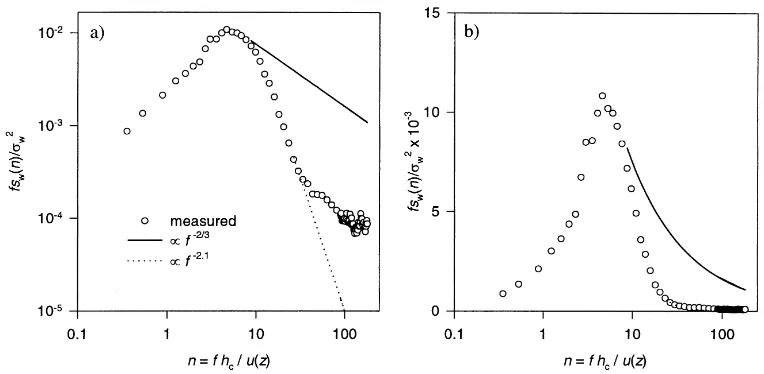
be expected to differ significantly from that of cereal crops (e.g. Raupach, 1989b). Fig. 2 shows the power spectral density (PSD) of the vertical wind component (sw(n)) as a function of non-dimensional frequency (n), normalized by the natural frequency (f) andσw2. The power spectra show the expected behaviour: 1. As expected from similarity theory (e.g. Stull,
1988), above the canopy, PSD is proportional to f−2/3. For heights below hc the slope becomes increasingly steeper forn > 0.8, consistent with energy dissipation in the dense canopy.
2. Up to a height ofz/ hc=0.7 the peak frequencies (np) scaled by hc are fairly constant (not shown),
while the value np was at 0.36 smaller than the value of 0.45±0.05 reported by Kaimal and Finni-gan (1994), probably due to an underestimation of
u(hc), which was not measured directly, but derived from extrapolation of the wind profile above the canopy.
3. The spectra obtained close to the ground (z=0.26 and 0.45 m) become flatter for high frequencies. Considering the low wind speed and variance of the measurements at the bottom heights (typical values: u(z)=0.15 m s−1,σ2
w=0.003 m2s−2), here mea-surements must be expected to be affected by the limited resolution of the analogue-to-digital con-verter of the ultrasonic anemometer (0.02 m s−1). Despite the very reasonable shape of the power spectra, it is possible that the steep roll-off of the spectra within the canopy was partly due to spatial averaging of small eddies, associated with high fre-quencies, over the large sampling volume of the stan-dard ultrasonic anemometer used during this study (Kaimal, 1968). Conversely, white noise could have contributed to the flat spectra measured at the bot-tom of the canopy, although the expected linearity in
f was not observed. A sensitivity analysis can help
es-timating the maximum effects of both errors. For this purpose a−23 line was fitted to the maximum of the PSD and subsequent summing over the area under the curve should lead to an upper estimate of the vari-ance which was typically 10% (max. 15%) larger than the unmodified value. Similarly, a lower limit can be found by eliminating possible white noise by extrap-olation of the actually measured slope towards higher frequencies (Fig. 3). This procedure led to values that were reduced by mainly less than 1% (4% for lowest height).
Possibly due to the inhomogeneity of the canopy, as well as effects of thermal stratification, the relative standard deviation of the valuesσw/u∗for subsequent
measuring intervals at one height was typically 11%. It is therefore concluded that over the height range of the measurements the error was in general within 11%, and possibly much less, because the deviation from the−23 line can probably be attributed partly to real damping effects.
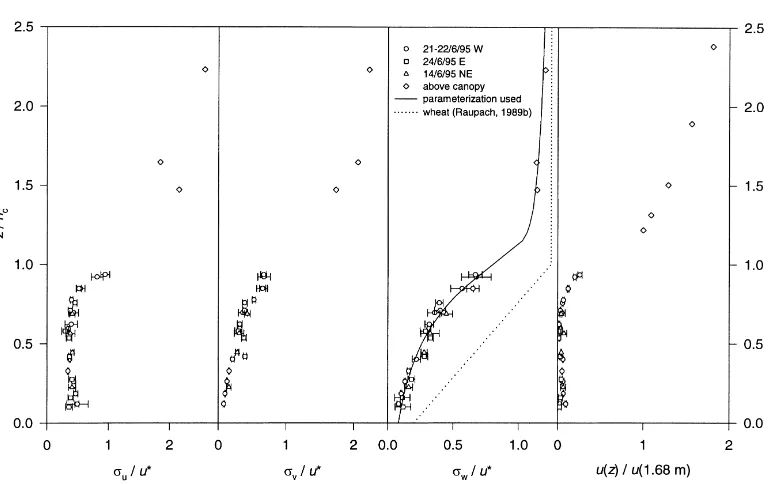
The measured profiles ofσu,σv and σw normal-ized by u∗ are presented in Fig. 4, together with the
390 E. Nemitz et al. / Agricultural and Forest Meteorology 105 (2000) 385–404
Fig. 1. Photograph of the cross-section through the oilseed rape canopy and normalized single sided LAD as measured for three different leaf layers and as estimated from Gammelvind et al. (1996) for the siliques. The total single sided leaf area index amounts to 5.3.
Although slight systematic differences can be found between the measurements at the different locations and different wind directions, the agreement is reason-ably good.
Probably owing to the density of the rape canopy, the decrease of σw/u∗ just below the canopy height
Fig. 2. The PSD of the vertical wind component (w), sw(n) measured at different heights in the canopy. sw(n) is normalized by the total
variance (σw2) as a function of n, which is the frequency (f) normalized by the canopy height (hc) and the wind speed (u(hc)).
(1989b) proposed for wheat (dotted line in Fig. 4). The values ofσw showed good linearity with u∗ over the
time periods the ultrasonic anemometer was placed at a particular height within the canopy (data not shown). The quality of the turbulence parameterization can in-directly be assessed by the performance of the ILT and of resistance models using a within-canopy resistance based onσw(Nemitz et al., 2000a).
Fig. 3. Extrapolation of the normalized PSD(fsw(n)/σw2)measured atz=0.82 m by an f−2/3 proportionality to obtain an upper (+14%)
and an f−2.1proportionality to obtain a lower estimate (−0.4%) for the variance ofw: (a) the logarithmic plot shows the fitting procedure;
(b) on the linear presentation the surface area under the curve is proportional to the contribution to the variance.
4.2. Sources and sinks of sensible heat within the canopy
392 E. Nemitz et al. / Agricultural and Forest Meteorology 105 (2000) 385–404
Fig. 4. Profiles of the standard deviations of the three wind components (σu,σv and σw), normalized by the friction velocity (u∗), as
well as of the wind speed (u(z)), normalized with the wind speed at the lowest measurement height above the canopy (u(1.68 m)), within the oilseed rape canopy as measured at three different days and locations. Differences might be caused by spatial inhomogeneities in the canopy or differences in wind direction (indicated in the legend). The values above the canopy represent means of several days and error bars are standard deviations of 5–40 13 min runs. The solid line shows the parameterization ofσw/u∗used for the ILT and the dotted line
represents the parameterization suggested for wheat (Raupach, 1989b).
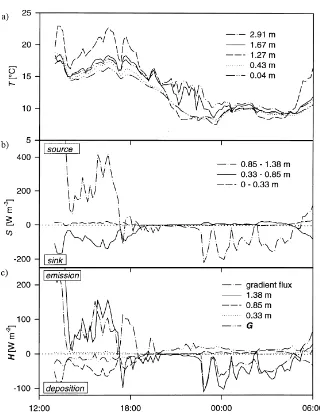
litter leaves, and the performance of the ILT must be expected to be poorest close to the ground. As a perfor-mance test, the ILT was therefore applied to temper-ature profiles measured within the canopy in order to obtain the vertical source/sink distribution of sensible heat. Fig. 5 shows the temperature measured at three heights within and two heights above the canopy, to-gether with the source/sink strengths of three canopy layers and the flux at the top of each layer.
During daytime, radiative heating of the canopy from above led to the temperature being highest at the top part of the canopy and decreasing towards both ground and atmosphere. With sunset (20:00 GMT) the above-canopy gradient reversed and radiative cooling was strongest in the top layer of the canopy, whereas heat stored in the canopy and released from the ground led to slightly higher temperatures at lower canopy layers. This is also reflected in the source/sink distri-bution: the top layer was a source during daytime and a sink at night; the middle layer became a sink during daytime, which can be explained by heat storage and
by plant transpiration (transformation of sensible into latent heat). The lowest part of the canopy was vir-tually inactive with some emission periods, while the flux at the top of the lowest layer (Fig. 5c) was much smaller than the ground heat flux measured with the Bowen ratio system (G). Despite the limited number of measurement heights, the sensible heat flux predicted by the ILT at the top of the canopy agrees well with the flux measured by the micrometeorological method, also shown in Fig. 5c (Sutton et al., 2000b). Devia-tions were found around 18:00 GMT, possibly due to processes that were confined to a shallow height layer at the top of the canopy and therefore not resolved by the ILT. Even with the small number of input heights the ILT can reproduce the main features of the flux above the canopy.
4.3. Within-canopy profiles of NH3
Fig. 5. (a) Temperature (T) as measured at three heights within and two heights above the plant canopy for 21–22 June 1995. (b) Source/sink strengths (S) for three canopy layers. (c) The sensible heat flux (H) for the top of the source/sink layers, the ground flux according to the ground heat flux and heat flux (G) calculated from the Bowen ratio system. Also shown is the flux according to the aerodynamic gradient method (gradient–flux). The three source/sink height layers were chosen as to represent the stems, the leaves and the siliques (see Fig. 1a).
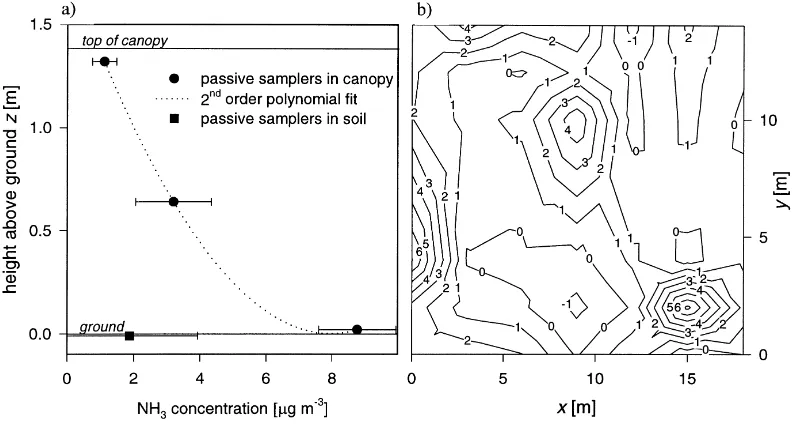
averaged over the period from 14 June to 21 June 1995. The results of the passive samplers placed within the soil, at a depth of about 0.02 m, are presented in Fig. 6b. The NH3 concentration measured within the top layer of the soil was smaller than the one just above the ground at all the sites measured, indicating that the NH3 originated from the decomposing leaf litter on the ground surface and that the measured average
con-centration at−0.02 m of 1.8mg m−3was more proba-bly caused by downward diffusion. This also explains the high scatter in the ground concentration, which is likely to be caused by the variability of the soil per-meability and possibly the spatial ‘patchiness’ of the litter distribution.
394 E. Nemitz et al. / Agricultural and Forest Meteorology 105 (2000) 385–404
Fig. 6. Average NH3 concentrations as measured by the passive samplers 14–21 June 1995. (a) In-canopy profile at three heights and
average value for the samplers in the soil. Error bars show standard errors ofn=7–8 replicates in the canopy andn=40 in the ground. (b) Concentration (mg m−3) contours of an arbitrarily chosen 18 m×14 m plot as derived from 40 IUL passive samplers atz= −0.02 m
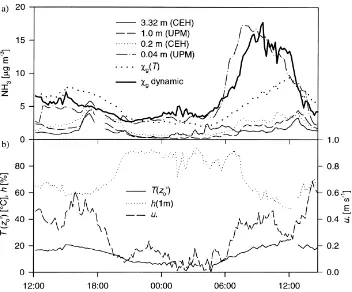
in the ground (negative concentrations arise from variations in the blanks). systems at 0.04, 0.20 and 1.00 m within the canopy, as well as above the canopy at 3.32 m. Micrometeoro-logical information about this period is given in Fig. 7b. For most of the time, the concentration at the low-est height was by far the larglow-est, increasing with tem-perature on 15 June, indicating a flux away from the ground surface. The concentration at 0.20 m was the second largest, except for the period between 04:00 and 07:00 GMT, when the concentrations above the canopy rose. Before 06:00 this rise could have been caused by advection, while between 06:00 and 07:00 GMT the emission gradient above the canopy together with a lower concentration at 1 m, suggested a source at the very top of the canopy.
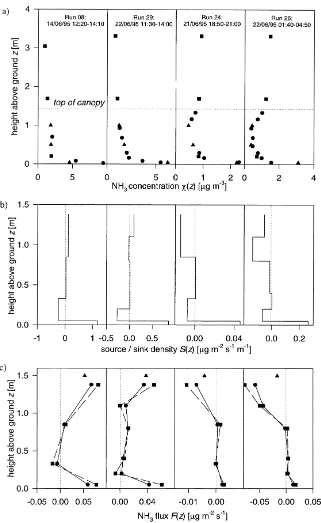
Additional profiles of single runs including both filter-packs and denuders are presented in Fig. 9 in more vertical detail with up to 14 heights. Whereas there was net emission of NH3during the daytime runs (a) and (b), the runs (c) and (d) represent nighttime NH3deposition situations.
4.4. Sources and sinks of NH3within the canopy The ILT was applied to two daily cycles of AMANDA measurements and 16 runs of combined
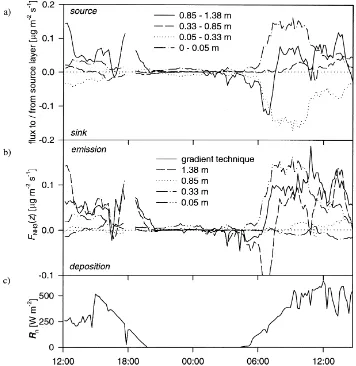
filter-pack and AMANDA measurements. Fig. 7 shows some of the input concentrations for 14−15 June 1995, together with the theoretical NH3 gas concentrations (χg) in equilibrium with the [NH4+] concentrations of the water pool in the litter leaves, using a constant [NH4+] of 16.2 mM and a pH of 5.25, the averages of all values measured by Husted et al. (2000). The source/sink strength and flux pro-files predicted by the ILT are shown in Fig. 8. The lowest canopy layer that contained the ground litter leaves acted as a continuous source, which was much larger during day than during nighttime (see Section 4.5). The next (stem-) layer appeared to adsorb most of the NH3 emitted from below; negative values of the flux at the top of this layer (0.33 m) were probably not real but errors due to the limited resolution of the model. The layer of the lower leaves (0.33–0.85 m) showed some emission during daytime, whereas the main emission originated from the upper leaves or the siliques, which was correlated with the net radiation (RRRn) and can be attributed to stomatal exchange with plant tissue.
Fig. 7. (a) High temporal resolution daily cycle of the NH3 concentration as measured by the AMANDA analysers of CEH and UPM at
three heights within and one height above the canopy on 14–15 June 1995. Also shown for comparison are the NH3 gas concentration
in equilibrium with the leaf litter tissue [NH4+] concentration, calculated as a function of temperature (T) only (χg(T)) as well as in a
dynamic approach (χgdynamic). (b) Micrometeorological conditions during this period T(z0′): temperature at the canopy height; h: relative
humidity; u∗: friction velocity.
with the aerodynamic gradient method (Sutton et al., 2000b) is encouraging. Although both techniques use the same values of u∗ and the NH3 concentration at zref=1.68 m, the function of both parameters is very different in each framework, and hence the two meth-ods must be taken as mainly independent. The agree-ment between the two techniques is similar to that between micrometeorological flux systems (Sutton et al., 2000b). The main period with poor agreement is from 06:00 to 07:00 GMT, when net emission was measured by the micrometeorological method, whereas the ILT still predicted deposition. A morn-ing emission peak coincidmorn-ing with the sunrise has been found in other studies and this phenomenon has been attributed to the release of NH3 in combination with the evaporation of dew and water layers from the leaf cuticle (e.g. Sutton et al., 1998). This
morn-ing emission appears to be related to the increase in solar radiation in the morning. Since canopies heat up from the top (compare Section 4.2), the evaporation started in the topmost layer, which was outside the range of the within-canopy measurements and there-fore not taken into account in the ILT. By contrast, the increase inχrefas a consequence of this emission (Fig. 7a) may have caused the ILT method to predict enhanced deposition. Once the NH3 originated from lower layers in the canopy (after 07:30 GMT), the emission was contained in the within-canopy profile. An alternative explanation for the poor agreement in the early morning would be the persistence of nighttime free convection in the canopy, which is not treated in the ILT (see Section 4.6).
396 E. Nemitz et al. / Agricultural and Forest Meteorology 105 (2000) 385–404
Fig. 8. Results of the inverse Lagrangian source/sink analysis performed for 14–15 June 1995 on the data presented in Fig. 7: (a) fluxes from (>0) or into (<0) the four source/sink layers as defined in Fig. 1; (b) the integrated flux (FNH3) at the top of each layer; (c) the net
radiation (RRRn).
10 filter-packs. Also shown are the source/sink densi-ties in the different layers (Fig. 9b) and the resulting flux profiles (Fig. 9c). For example, two daytime runs (Runs 8 and 29) and two nighttime runs (Runs 24 and 26) are presented, and the fluxes as measured with the aerodynamic gradient technique are also indi-cated. Depending on the number of measuring points and quality of the measurements, different numbers of source/sink layers were chosen. In this case the choice of the height layers did not affect the results as much as during the analysis of the daily cycle mea-sured at only five heights with the AMANDA systems (Figs. 7 and 8). All runs showed a large emission at
398 E. Nemitz et al. / Agricultural and Forest Meteorology 105 (2000) 385–404 stratification not treated by the ILT. Moreover, the ILT
often produces negative fluxes at about 0.3 m, which are probably an artefact caused by errors in the tur-bulence parameterization of the lowest canopy layers.
4.5. Ground level emission of NH3
A short series of chamber measurements was car-ried out in the field, using two AMANDA denud-ers and a simple stirred dynamic cuvette to further investigate the emission of NH3 from decomposing oilseed rape litter. The ground level emissions of typi-cally 10–50 ng m−2s−1measured with the cuvette sys-tem were smaller than predicted by the ILT (up to 150 ng m−2s−1). This may be due to (i) the impact of the cuvette or (ii) the spatial variability of the leaf lit-ter emission. Aflit-ter removing all litlit-ter leaves from the chamber the measured flux virtually dropped to zero, which can be taken as a further indication that soil emission was not significant. In contrast, increasing the mass of leaves in the chamber by factor 3.3 led to a rise in the emission flux by factor 4.1. Although the mineralization rate of plant litter incorporated into soils has been investigated in a number of studies (e.g. Nicolardot et al., 1995), little is known about processes within detached leaves lying on the ground surface. Schjørring et al. (1998) have shown that [NH4+] pro-duction by mineralization is tightly linked to degrada-tion of chlorophyll and to the degradadegrada-tion of soluble proteins in senescent leaves. The NH3gas concentra-tion at the surface of the litter leaves (χg) must be expected to be in equilibrium with the [NH4+] and pH of the decomposing leaf litter tissue, where little is known about the compartmentation of the water in these leaves. It must be assumed that [NH4+] is regu-lated by the water content of the litter, mineralization and nitrification rates as well as the amount of [NH4+] released to the atmosphere as NH3. These processes were implemented here in a first dynamic model adapt-ing: (a) the mineralization and nitrification rates of Dawson (1977) and (b) the response of the leaf water content to relative humidity (h) proposed by van Hove and Adema (1996). The values ofχgpredicted by this model (‘χg dynamic’ in Fig. 7a) matched concentra-tions measured near the ground much more closely than the only temperature dependentχg(T) in Fig. 7a. In addition, preliminary controlled chamber measure-ments carried out under lab conditions have shown the
NH3 emission from decomposing B. napus leaves to increase with humidity (Nemitz et al., 2000a).
4.6. Uncertainties associated with the inverse Lagrangian technique
This section discusses the main uncertainties ex-pected to affect the performance of the ILT.
4.6.1. Concentration measurements
At atmospheric concentrations, NH3is still difficult to measure and the use of three independent analysers (filter-packs and two AMANDA systems) is bound to lead to some differences in concentrations, although cross checks were carried out and, where necessary, systematic differences (±20%) between systems were corrected.
4.6.2. Parameterization ofσw/u∗near the ground
During daytime the parameterization ofσw/u∗was
estimated to be accurate to ±11% over the height range of the measurements (Section 4.1). However, turbulence could not be measured directly close to the ground. For z < 0.16 m, the so-called ‘unresolved basal layer’ (Wilson and Flesch, 1993), parameteri-zations ofσw had to be estimated by extrapolation. The lowest 0.05 m layer of the rape canopy is a strong source and measurements of NH3concentrations were carried out close to the ground. Table 1 shows the flux at different heights in the canopy for various parame-terizations ofσw below the measurement range (z < 0.2 m). Different parameterizations ofσwresult in dif-ferent flux profiles, in particular, in very difdif-ferent esti-mates of the ground level emission. By contrast, the ef-fect on the net flux is small and mid-canopy fluxes van-ish in all scenarios. Acknowledging that Fig. 4 makes a lower limit ofσw≥0.2u∗unlikely, case 4 in Table 1
may nevertheless be taken as a scenario that reflects the small possibility of the in-canopy turbulence being systematically underestimated by the anemometer.
4.6.3. Conceptual limitations of the ILT
Table 1
The NH3 fluxes (F) at the top of the four source layers (0.05, 0.33, 0.85 and 1.38 m), estimated by the ILT, as a function of the
parameterization for the normalized standard deviation of the vertical wind component(σw/u∗(z))chosen for the lowest 0.2 m of the canopya
Case Additional conditions for turbulence parameterization F(0.05 m) F(0.33 m) F(0.85 m) F(1.38 m)
1 Original parameterization; see Run 8, Fig. 9 59.5 −6.6 8.6 63.2
2 TLdecreasing exponentially (Raupach et al., 1992) 29.8 −6.3 9.6 77.1
3 σw/u∗≥0.1 63.7 −7.6 9.7 66.3
4 σw/u∗≥0.2 172.9 −6.0 9.1 67.5
5 σw/u∗→0.05 forz→0 42.5 −2.9 6.3 65.2
6 σw/u∗→0 forz→0 8.8 10.4 −4.4 75.0
7 Aerodynamic gradient technique 52.7
aAll runs are based on the parameterization according to the solid line in Fig. 4 and a Lagrangian time-scale (T
L) that is constant over
the height range of the canopy (Raupach, 1989a), with the additional condition given in the second column. Fluxes are given in ng m−2s−1. where turbulence is lowest. During free convectionσw
scales with a velocity (w∗) that is related to the
sensi-ble heat flux rather than with u∗(Jacobs et al., 1994).
Indeed, there was evidence that, for small values of
u∗, the linearity ofσw in u∗ might not hold. For
sta-ble nighttime runs, the disagreement between ILT and micrometeorological method was larger than between the ILT with and without ‘near-field’ contribution, in-dicating that in-canopy stability effects on the net flux might be more important than the near-field contri-bution itself (Fig. 9c). Hence in the current form the ILT should only be applied to nighttime conditions if the effect of turbulence (parameterized by u∗) is much
larger than that of free convection.
Closely related is the simplification that the ILT is based on a Gaussian distribution of the turbulent pa-rameters (Raupach, 1989a). Within plant canopies and especially close to the ground, free convection and in-termittency of the turbulence lead to skewness in tur-bulent parameters. Intermittency and non-Gaussianity appear to be unimportant for source-concentration relationships (Sawford, 1993; Flesch and Wilson, 1992), but since model validation studies have been restricted to mid-canopy sources, it is possible that the effect is larger for a ground-level source. A contri-bution of free convection to the vertical transport near the ground would have the same effect as larger val-ues ofσw (Table 1, cases 3 and 4), and its inclusion in the modelling would therefore lead to a prediction of larger leaf litter emission.
As a net result, while the magnitude of the leaf litter emission derived with the ILT is highly uncertain, the net flux above the canopy appears to be stable. At present there is no available alternative concept that could be applied more reliably.
4.6.4. Number of input values
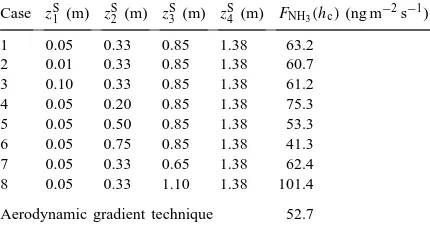
A further error is induced by the number of input values and the resolution of the measurements. Some exchange processes, such as the desorption of NH3 by top leaves, probably take place in a very shallow height range, which might not be resolved by the mea-sured profile. Also, the need to implement the ILT as finite sums, results in a sensitivity to the choice of the heights zSj, especially when only few input con-centrations are used. Table 2 shows the NH3 flux at the top of the canopy calculated from the same input concentrations at eight heights using different values ofzSj. Since in the present analysis, Sj is expected to be constant over the whole height layer j, thezSj were chosen as to represent physical plant parts (e.g. leaf litter, stems, lower leaves, upper leaves and siliques — compare Fig. 1). Thus good results were achieved without choosing the heights arbitrarily.
Table 2
The values of the net flux of NH3 (FNH3) at the canopy height
(hc) calculated from the same input values using different values
of the source layers(zS
j). The data are taken from Fig. 9, Run 8
and case 1 represents the standard values ofzjS
400 E. Nemitz et al. / Agricultural and Forest Meteorology 105 (2000) 385–404 5. Discussion
Within-canopy profiles and canopy cycling pro-cesses of NH3have been investigated in a very limited number of studies (Denmead et al., 1976; Lemon and van Houtte, 1980; Harper et al., 1987; Sutton et al., 1993b; Meixner et al., 1996). In accordance with the concept that NH3 emissions above cereal crops often originate from NH3 concentrations within the substomatal cavity (e.g. Farquhar et al., 1980), emis-sion profiles of NH3within canopies often show the largest concentration at mid-canopy, at the height of the greatest leaf density (Sharpe and Harper, 1995; Meixner et al., 1996; Sutton et al., 1996). In canopies of grass-clover pasture as well as soybeans and quackgrass NH3emissions have been observed, while within-canopy profiles showed the highest concentra-tions at ground level (Denmead et al., 1976; Lemon and van Houtte, 1980; Sutton et al., 1993b). This has been attributed to leaf litter decomposition and NH3 emission from the soil. In contrast, deposition profiles (e.g. during nighttime when the stomata are closed) often show concentration minima at mid-canopy (Sutton et al., 1996), owing to the depletion of NH3by cuticular adsorption at the height of maximum LAD. Low turbulence allows NH3 concentrations to build up above the ground, even if the ground level emission of NH3is very small, and counter-gradient–fluxes are also possible (Denmead and Bradley, 1985).
The oilseed rape canopy showed the largest NH3 concentration at the ground surface. This was found to be caused by N mineralization from fallen leaf lit-ter that led to NH3 release of up to 150 ng m−2s−1, depending on humidity, temperature and turbulence. A major contribution of soil emission could be ruled out on grounds of NH3 concentration measurements within the soil as well as chamber measurements over bare soil. Under these conditions the net exchange can-not be expected to be purely governed by stomatal and cuticular exchange, and here the source/sink analysis offers further insight in the exchange process and the contribution of ground level emission.
The ILT based on the LNF theory developed by Raupach (1989a,b) proved to be a useful tool for the source/sink analysis for both heat and NH3. For both entities the net flux above the canopy as derived by the ILT agrees well with the micrometeorological method. However, the analysis turns out to be
sen-sitive to the choice of the source/sink layers as well as the parameterization of the turbulence close the ground surface, which could not be measured directly but had been estimated by extrapolation. The effect of the turbulence close to the ground on the estimation of the leaf litter emission is especially pronounced in the present case, since due to the leaf litter emission, the NH3 gradient is particularly large in the lowest part of the canopy. Abovez=0.2 m and during day-time the accuracy of the profile of σw/u∗, although
measured with a standard ultrasonic anemometer that is not ideal for measurements in canopies as dense as oilseed rape, is expected to be within±11%. This is similar to the accuracy at which NH3concentrations can be measured. Hereσw was only obtained as an average over daytime conditions. Especially at night, the performance of the ILT might be substantially improved if σw could be parameterized as a func-tion of stability, and scaled withw∗ rather than u∗ at
night. Similarly, estimates and measurements of the turbulence characteristics of canopy layers very close to the ground (z/ hc<0.1) need to be improved. The profiles of the standard deviations of the different wind components showed a sharper decline in the top canopy than measurements in other plant canopies (e.g. Raupach, 1989b; Kaimal and Finnigan, 1994), which is probably due to the large LAD and the rigid mesh formed by the silique layer (Fig. 1).
canopy originated from the top layer above 0.85 m (12 g ha−1 per day). Therefore, the N loss from the plant as gaseous NH3was more than balanced by up-take from NH3emitted by decomposing leaves. Fol-lowing the discussion of errors, the actual magnitude of the ground level emission, however, is rather un-certain (see Table 1). Nemitz et al. (2000a) have de-veloped and applied a range of resistance models to the NH3surface exchange with the B. napus canopy at North Berwick. A three-layer resistance model, dif-ferentiating between litter leaves, foliage and siliques, is required to reproduce the source/sink distribution reported here.
Both the continuous measurements of the net NH3 exchange above the canopy (Sutton et al., 2000b) and the modelling study (Nemitz et al., 2000a) show sig-nificant NH3emissions during some windy nights. Un-fortunately, no in-canopy profiles were measured dur-ing these particular periods, but it can be assumed that here the NH3 emitted by the leaf litter did penetrate through the canopy due to increased turbulent mixing. Since at present the apoplastic liquid extraction can-not be applied to B. napus siliques, no [NH4+] mea-surements could be carried out on the siliques them-selves. More recent measurements by Husted (1997) have shown the bulk tissue [NH4+] concentration of the siliques to be 3–5 times the value of attached leaves. Emission of NH3by cuticular desorption as ob-served by Sutton et al. (1998) can contribute to a part of the emission in the morning hours, when dew and water films evaporate, but it is unlikely to be the main process over the whole day. Both apoplastic [NH4+] and pH from bioassay as well as the ILT modelling in-dicate that the low canopy acted as a sink for the leaf litter emission. Unless the apoplastic measurements significantly underestimate leaf compensation points, these results point to the siliques being the main source of the measured daytime net NH3emission above the canopy.
6. Concluding remarks
The present study is the first application of the ILT to estimate the source/sink distribution of NH3 within a plant canopy. The net flux above the oilseed rape canopy at North Berwick predicted by the ILT agreed well with the micrometeorological
measure-ments during daytime for both sensible heat and NH3, but nighttime deposition of NH3was underestimated. The source distribution predicted by the ILT indicates that significant NH3 emission from leaf litter at the ground surface occurred, but the absolute magnitude is currently rather uncertain. During daytime the litter emission was almost certainly fully recaptured by the canopy, while the net emission originated from the top of the canopy, probably from the siliques.
Some uncertainties of the ILT remain: to improve the performance of the ILT at the ground surface and at nighttime it will be necessary to derive parameteri-zations of the standard deviation of the vertical wind component (σw) (i) close to the ground and (ii) for the full range of in-canopy stabilities, especially for the free convection regime. In addition, more mea-surement heights would be needed to desensitize the technique with respect to the choice of the height lay-ers. However, this only affected the prediction of the source distribution, while the net flux remained stable.
Acknowledgements
The authors gratefully acknowledge financial sup-port from the EU projects EXAMINE (EV5V-CT94-0426) and GRAMINAE (CT98-0722), as well as the UK Department of the Environment, Transport and the Regions (DETR; contracts EPG 1/3/28 and 1/3/94). Some filter-packs were kindly loaned by J. Colls, Uni-versity of Nottingham, UK, and access to the field was provided by Mr. J. Grant-Suttie. We also thank O.T. Denmead and M.R. Raupach for giving us the oppor-tunity to compare our first implementation of the ILT with their original version, and C. Milford, K.J. Har-greaves and F. Harvey for help in the field.
Appendix A. An implementation of the inverse Lagrangian technique
Since Raupach (1989a,b) presented his novel tech-nique to infer the source/sink distribution of tracers within plant canopies from measurements of vertical profiles of concentrations (χ) and turbulence (σw,
402 E. Nemitz et al. / Agricultural and Forest Meteorology 105 (2000) 385–404 how the presented integrals may be turned into finite
sums, a fact that might deter the mathematically less confident reader. It is therefore helpful to outline a practical way to implement the ILT, and in particular how to calculate the diffusion matrixD=(δi,j)(m,n) of Eq. (1), which is here repeated in non-vector format:
It is assumed that continuous parameterizations for σw(z) and TL(z) have been found and that the height divisions for concentrations (zχi ) and source/sink lay-ers (zSj) are taken as defined above withzS0 =0 and 1zSj = zSj −zSj−1(j =1, . . . , m). Note that, unlike by Raupach (1989a,b), the values of1zj are incorpo-rated intoδi ,jand that the ground flux (Fg) is not dealt with explicitly. In general Fgcan be incorporated into the source/sink density of the lowest source layer as in the case of the leaf litter in the oilseed rape canopy. In order to limit the uncertainties caused by the small number of layers and to account for the strong height dependence of σw, TL, KH and kn, each source/sink layer is sub-divided into r sub-layers zSjl(j =1, . . . , n;l =1, . . . , r), wherezSjl is defined as
zSjl=zSj−1+l11zSj, 11zSj =
zSj−zSj−1
r (A.2)
To obtain a similar resolution the distance between a concentration height (zχi ) and zref = zn+1 is
Eq. (8) can be directly turned into a finite sum to yield an expression for the matrix elements of the near-field contribution (αij):
αij =1zSj
In order to evaluate the expression for the far-field contribution to the concentration (Eq. (4))Fχ(ziχ)has to be substituted according to Eq. (5). This substitution leads to a double integral which can be evaluated to yield the matrix elements of the far-field contribution (βi ,j) as
Adding the expressions for the near- and far-field con-tributions according to Eqs. (3), (4) and (8) and sorting them for the dependency on Sj yields
χi−χ (zref)=
Hence it is established that the matrix elementsδi ,j of Eq. (A.1) are given by
m
Note that the summations in Eqs. (A.5) and (A.6) can be calculated more accurately using numerical integra-tion procedures such as Simpson’s rule or the Trape-zoidal rule (e.g. Press et al., 1989).
References
Baldocchi, D.D., Hicks, B.B., Camara, P., 1987. A canopy stomatal resistance model for gaseous deposition to vegetated surfaces. Atmos. Environ. 21, 91–101.
Blatter, A., Fahrni, M., Neftel, A., 1992. A new generation of NH3-passive samplers. In: Allegrini, I. (Ed.), CEC Air Pollution
Research Report 41. Development of Analytical Techniques for Atmospheric Pollutants. E. Guyot SA, Brussels, pp. 171–176. Dawson, G.A., 1977. Atmospheric ammonia from undisturbed
land. J. Geophys. Res. 82, 3125–3133.
Denmead, O.T., 1995. Novel micrometeorological techniques. Phil. Trans. R. Soc. London A 351, 383–396.
Denmead, O.T., Bradley, E.F., 1985. Flux–gradient relationships in a forest canopy. In: Hutchison, B.A., Hicks, B.B. (Eds.), The Forest–Atmosphere Interaction. Reidel, Dordrecht, pp. 421–442. Denmead, O.T., Freney, J.R., Simpson, J.R., 1976. A closed ammonia cycle within a plant canopy. Soil Biol. Biochem. 8, 161–164.
Farquhar, G.D., Firth, P.M., Wetselaar, R., Weir, B., 1980. On the gaseous exchange of ammonia between leaves and the environment: determination of the ammonia compensation point. Plant Physiol. 66, 710–714.
Finnigan, J.J., 1979. Turbulence in waving wheat. I. Mean statistics and honami. II. Structure of momentum transfer. Boundary-Layer Meteorol. 16, 181–236.
Flesch, T.K., Wilson, J.D., 1992. A two-dimensional trajectory-simulation model for non-Gaussian, inhomogeneous turbulence within plant canopies. Boundary-Layer Meteorol. 61 (4), 349–374.
Gammelvind, L.H., Schjørring, J.K., Mogensen, V.O., Jensen, C.R., Bock, J.G.H., 1996. Photosynthesis in leaves and siliques of winter oilseed rape (Brassica napus L.). Plant and Soil 186, 227–236.
Gardiner, B.G., 1994. Wind and wind forces in a plantation spruce forest. Boundary-Layer Meteorol. 67, 161–186.
Genfa, Z., Dasgupta, P.K., 1989. Fluorometric measurement of aqueous ammonium ion in a flow injection system. Anal. Chem. 61, 408–412.
Harper, L.A., Sharpe, R.R., Langdale, G.W., Giddens, J.E., 1987. Nitrogen cycling in a wheat crop: soil, plant and aerial nitrogen transport. Agron. J. 79, 965–973.
Husted, S., 1997. Physiological mechanisms controlling the exchange of ammonia between plants and the atmosphere. Ph.D. Thesis. Plant Nutrition Laboratory, The Royal Veterinary and Agricultural University, Copenhagen, Denmark.
Husted, S., Schjørring, J.K., Nielsen, K.H., Nemitz, E., Sutton, M.A., 2000. Stomatal compensation points for ammonia in oilseed rape plants under field conditions. Agric. For. Meteorol. (Special issue on ammonia fluxes with oilseed rape), this issue.
Jacobs, A.F.G., van Boxel, J.H., El-Kilani, R.M.M., 1994. Nighttime free convection characteristics within a plant canopy. Boundary-Layer Meteorol. 71, 375–391.
Kaimal, J.C., 1968. The effect of line averaging on the spectra of temperature and heat-flux. Quart. J. R. Meteorol. Soc. 94, 149–155.
Kaimal, J.C., Finnigan, J.J., 1994. Atmospheric Boundary Layer Flows. Oxford University Press, Oxford, 289 pp.
Katul, G., Oren, R., Ellsworth, D., Hsieh, C.-I., Phillips, N., Lewin, K., 1997. A Lagrangian dispersion model for predicting CO2
sources, sinks and fluxes in a uniform loblolly pine (Pinus taeda L.) stand. J. Geophys. Res. 102, 9309–9321.
Lemon, E., van Houtte, R., 1980. Ammonia exchange at the land surface. Agron. J. 72, 876–883.
Meixner, F.X., Wyers, P.G., Neftel, A., 1996. Bi-directional exchange of ammonia over cereals. In: Borrell, P.M., Borell, P., Kelly, K., Cavitaš, T., Seiler, W. (Eds.), Proceedings of the EUROTRAC’96. Computer Mechanics Publications, Southampton, pp. 129–135.
Nemitz, E., Sutton, M.A., Schjoerring, J.K., Husted, S., Wyers, G.P., 2000a. Resistance modelling of ammonia exchange above oilseed rape. Agric. For. Meteorol. 105, 405–425.
Nemitz, E., Sutton, M.A., Wyers, G.P., Otjes, R.P., Schjoerring, J.K., Gallagher, M.W., Parrington, J., Fowler, D., Choularton, T.W., 2000b. Surface/atmosphere exchange and chemical interactions of gases and aerosol over oilseed rape. Agric. For. Meteorol. 105, 427–445.
Nicolardot, B., Lagacherie, B., Cheneby, D., Mariotti, M., 1995. Decomposition of 15N-labelled catch-crop residues in
soil: evaluation of N mineralization and plant-N uptake potentials under controlled conditions. Eur. J. Soil Sci. 46, 115–123.
Pearson, J., Stewart, G.R., 1993. The deposition of atmospheric ammonia and its effect on plants (Tansley Review No. 56). New Phytologist 125, 283–305.
Press, W.H., Flannery, B.P., Teukolsky, S.A., Vetterling, W.T., 1989. Numerical Recipes in Pascal — The Art of Scientific Computing. Cambridge University Press, Cambridge, 759 pp.
Raupach, M.R., 1987. A Lagrangian analysis of scalar transfer in vegetation canopies. Quart. J. R. Meteorol. Soc. 113, 107–120.
Raupach, M.R., 1989a. Applying Lagrangian fluid mechanics to infer scalar source distributions from concentration profiles in plant canopies. Agric. For. Meteorol. 47, 85–108.
404 E. Nemitz et al. / Agricultural and Forest Meteorology 105 (2000) 385–404 Raupach, M.R., Denmead, O.T., Dunin, F.X., 1992. Challenges in
linking atmospheric CO2 concentrations to fluxes at local and
regional scales. Aust. J. Bot. 40, 697–716.
Sawford, B.L., 1993. Recent developments in the Lagrangian stochastic theory of turbulent dispersion. Boundary-Layer Meteorol. 62 (1–4), 197–215.
Schjørring, J.K., Husted, S., Mattsson, M., 1998. Physiological parameters controlling plant–atmosophere ammonia exchange. Atmos. Environ. 32, 491–498.
Sharpe, R.R., Harper, L.A., 1995. Soil, plant and atmospheric conditions as they relate to ammonia volatilization. Fert. Res. 42, 149–158.
Stull, R.B., 1988. An Introduction into Boundary Layer Meteorology. Kluwer Academic Publishers, Dordrecht, 666 pp. Sutton, M.A., Pitcairn, C.E.R., Fowler, D., 1993a. The exchange of ammonia between the atmosphere and plant communities. Adv. Ecol. Res. 24, 301–393.
Sutton, M.A., Fowler, D., Moncrieff, J.B., Storeton-West, R.L., 1993b. The exchange of atmospheric ammonia with vegetated surfaces. II. Fertilized vegetation. Quart. J. R. Meteorol. Soc. 119, 1023–1045.
Sutton, M.A., Burkhardt, J.K., Guerin, D., Fowler, D., 1995. Measurements and modelling of ammonia exchange over arable croplands. In: Heij, G.J., Erismann, J.W. (Eds.), Acid Rain Research: Do We Have Enough Answers? Elsevier, Amsterdam, pp. 71–80.
Sutton, M.A., Nemitz, E., Fowler, D., Wyers, G.P., Otjes, R., San José, R., Moreno, J., Schjørring, J.K., Husted, S., Meixner, F.X., Ammann, Ch., Neftel, A., Gut, A., 1996. The EXAMINE project: exchange of atmospheric ammonia with European
ecosystems. In: Borrell, P.M., Borell, P., Kelly, K., Cavitaš, T., Seiler, W. (Eds.), Proceedings of the EUROTRAC’96. Computer Mechanics Publications, Southampton, pp. 155–161. Sutton, M.A., Burkhardt, J.K., Guerin, D., Nemitz, E., Fowler,
D., 1998. Development of resistance models to describe measurements of bi-directional ammonia surface atmosphere exchange. Atmos. Environ. 32, 473–480.
Sutton, M.A., Nemitz, E., Fowler, D., Wyers, G.P., Otjes, R.P., Schjoerring, J.K., Husted, S., Nielsen, K.H., San José, R., Moreno, J., Gallagher, M.W., Gut, A., 2000a. Fluxes of ammonia over oilseed rape: overview of the EXAMINE experiment. Agric. For. Meteorol. 105, 327–349.
Sutton, M.A., Nemitz, E., Fowler, D., San José, R., Moreno, J., Wyers, G.P., Schjørring, J.K., Husted, S., 2000b. Micrometeorological measurements of ammonia fluxes over oilseed rape during two vegetation periods. Agric. For. Meteorol. 105, 351–369.
van den Hurk, B.J.J.M., McNaughton, K.G., 1995. Implementation of near-field dispersion in a simple two-layer surface resistance model. J. Hydrol. 166, 293–311.
van Hove, L.W.A., Adema, E.H., 1996. The effective thickness of water films on leaves (Short communication). Atmos. Environ. 30, 2933–2936.
Wilson, J.D., Flesch, T.K., 1993. Flow boundaries in random-flight dispersion models: enforcing the well-mixed condition. J. Appl. Meteorol. 32 (11), 1695–1707.