Water use patterns and agronomic performance for some cropping
systems with and without fallow crops in a semi-arid environment of
northwest China
Li Fengrui
a,∗, Zhao Songling
a, G.T. Geballe
baState Key Laboratory of Arid Agroecology, Lanzhou University, Lanzhou Gansu province 730000, PR China bSchool of Forestry and Environmental Studies, Yale University, 205 Prospect Street, New Haven, CT 06511, USA
Received 28 January 1999; received in revised form 12 July 1999; accepted 8 November 1999
Abstract
Winter wheat (Triticum aestivum L.) monoculture, characterized by a 2–3 month summer fallow (from the wheat harvest in early July to sowing in late September), not only lowers the overall precipitation-use efficiency because of the large amount of water evaporated from the bare soil during the fallow period but also has a high risk of the erosive action of rainstorms. To develop effective cropping systems as alternatives for farmers, thirty-two 3-year crop rotation systems with and without fallow crops were established and their water use pattern, agronomic performance and soil conservation characteristics were evaluated in a semi-arid region of northwest China. Compared with wheat monoculture, the 16 rotations without fallow crops produced more grain yield and greater water-use efficiency. Among the 16 rotations with fallow crops, seven patterns were significantly greater in grain yield and five patterns were significantly higher in water-use efficiency than wheat monoculture. Cropping systems showed a marked increase in evapotranspiration when fallow crops were added to the rotation largely because of better utilization of seasonal precipitation. On average, the 16 rotations with fallow crops utilized 17 and 27% more precipitation than the 16 rotations without fallow crops and wheat monoculture. The use of the fallow crops did not greatly influence the quantity of water stored in the soil for use by the subsequent wheat crop because their growth depends only on growing-season precipitation. From a perspective of soil conservation and productivity improvement, it appears highly viable to cultivate winter wheat followed by a 2–3 month fallow crop in 1 year and a summer crop cultivation in the next. This system allows the soil to be covered during both easily-eroded rainy periods but lies bare 6 months every 2 years. As most of this 6-month period is winter, not only is soil evaporation reduced but also the danger of erosion is low. © 2000 Elsevier Science B.V. All rights reserved.
Keywords: Wheat monoculture; Rotation system; Fallow crop; Agronomic performance; Water use patterns; Soil conservation requirement; NW China
∗Corresponding author. Present address: Center for Arid
Agroe-cological Economics, Gansu Academy of Social Sciences, 9 Jiankang Road, Anning District, Lanzhou 730070, Gansu province, PR China.
E-mail address: [email protected] (L. Fengrui)
1. Introduction
In China’s semi-arid loess region, soil erosion and limited water availability are two major constraints to sustainable crop production. This region is strongly governed by the monsoon climate. Not only is
fall often inadequate but also over 60% of annual pre-cipitation occurs in the 3 months between July and September, often in the form of intense thunderstorms which cause tremendous amounts of erosion. Hence the problem for agricultural production is not so much the absolute scarcity of rainfall but rather its uneven seasonal distribution (Li, 1998).
In the prevailing rainfed farming system, winter wheat (Triticum aestivum L.) monoculture is a com-mon practice. This practice is characterized by a 2–3 month summer fallow (from the wheat harvest in end of June or early July through to sowing in late September) and is generally considered to increase soil water storage that is available for use by the subsequent crops. However, it often lowers the over-all precipitation-use efficiency because of the large amount of water evaporated from the bare soil during the fallow period (Gao and Zhang, 1992; Zhu et al., 1994). The reason is that the fallow period closely parallels the rainy season and lies in the height of summer-time in the region, thereby having a high evaporative demand under high rainfall and temper-ature. Moreover, the soil lies bare during the fallow period and will be at risk to the erosive action of heavy rainstorms. So severe soil erosion during this period is also a great threat to sustainable production. Another negative effect of wheat monoculture on crop production stems from pest, weed and disease infes-tation (Hanley and Ridgman, 1978; Al-Fakhry, 1990; Cook, 1990; Gao and Zhang, 1992; Zhang, 1992). It is widely recognized that the practices of crop rotation are among most effective methods for alleviating ero-sion, improving the water availability and maintaining high yields (Follett and Stewart, 1985; Williams and Renard, 1985; Wang, 1989; Francis and Clegg, 1990; Amir et al., 1991; Caporali and Onnis, 1992; Liu and Liu, 1992; Shan, 1993). However, the successful im-plementation of crop rotation practices hinges upon certain environmental (e.g. geographic, climatic and edaphic), technological and socio-economic factors. Particularly, environmental factors almost completely dictate the crop and its management selection. In semi-arid climates, choosing proper crop types and cultivars is of great importance to the development of effective cropping systems and management prac-tices. This choice often entails taking into account not only crop productivity and water-use efficiency but also the time of sowing, duration of the growth cycle,
growth property of seedlings and soil conservation requirements. On the other hand, a successful crop rotation system is not only a profitable agricultural system but also a beneficial soil conservation tool.
As part of a long-term research effort aimed at establishing a sustainable rainfed farming system in the semi-arid and sub-humid regions of northwest China, this paper presents a detailed study on the water use patterns and agronomic performance for some cropping systems with and without fallow crops in a semi-arid environment. The objectives of this study were to: (1) determine the grain and above-ground biomass production and water-use efficiency of individual crops grown in the rotation; (2) analyze the seasonal and inter-annual patterns of soil water storage and utilization as well as water stress for the four major rotation crops such as winter wheat, corn, potato and millet; (3) determine the grain and aboveground biomass production and water-use effi-ciency for different rotation systems and evaluate the capacities of the rotation systems with and without fallow crops to utilize soil water storage in conjunc-tion with seasonal precipitaconjunc-tion; (4) establish whether the introduction of fallow crops into the wheat mono-culture significantly influences the quantity of water stored in the soil that will be used by the subsequent wheat crop; and (5) discuss the characteristics of soil conservation for different rotation systems.
2. Materials and methods
2.1. Study site description
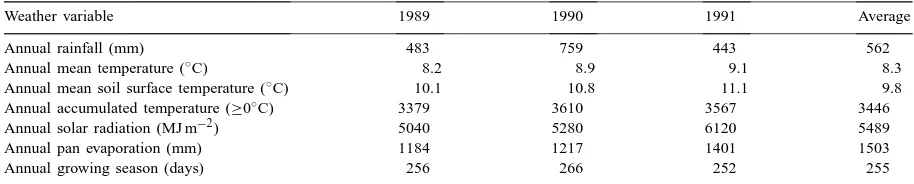
Table 1
Weather conditions for the three major years of experiment in comparison with the average values for the 40 years, 1948−1988
Weather variable 1989 1990 1991 Average
Annual rainfall (mm) 483 759 443 562
Annual mean temperature (◦
C) 8.2 8.9 9.1 8.3
Annual mean soil surface temperature (◦
C) 10.1 10.8 11.1 9.8
Annual accumulated temperature (≥0◦
C) 3379 3610 3567 3446
Annual solar radiation (MJ m−2) 5040 5280 6120 5489
Annual pan evaporation (mm) 1184 1217 1401 1503
Annual growing season (days) 256 266 252 255
months are 21.3◦C and −5.3◦C, respectively. Aver-age annual solar radiation is 5489 MJ m−2. The mean length of the annual growing season is 255 days.
The field work took place during the years 1988−1991. Table 1 summarizes weather conditions for the 3 years 1989, 1990 and 1991. Compared with the average values for the 40-year period 1948–1988, there was low rainfall (483 mm) and low solar radia-tion (5040 MJ m−2) in 1989, high rainfall (759 mm) and high mean temperature (8.9◦C) in 1990 and low rainfall (443 mm) and high mean temperature (9.1◦C) in 1991. Averaged over the 3 years, annual precipitation, mean temperature, solar radiation and length of the growing season were 562 mm, 8.8◦C, 5480 MJ m−2 and 255 days, respectively, being close to the average values for the 40 years.
2.2. Experimental design and treatments
Eight principal crops of the region were chosen as rotation crops, including winter wheat (Triticum aes-tivm L., cv. ‘Xifeng No. 16’), corn (Zea mays L., cv. ‘Zhongdan No. 2’), potato (Solanum tuberosum L., cv. ‘Tainshu No. 1’), millet (Penisetum glaucum (L.) R. Brown, cv. ‘Changnon No. 1’), sorghum (Sorghum bi-color (L.) Moench, cv. ‘Jinzhong No. 405’), soybean (Glycine max (L.) Merr., cv. ‘Jindou No. 2’), winter rapeseed (Brassica napus L., a local cultivar) and flax (Linum usitatissimum L., cv. ‘Tianya No. 1’). Three early-maturing crop species such as broomcorn mil-let (Panicum miliaceum, a local cultivar), soybean (cv. ‘Bayueza’) and annual common vetch (Vicia sativa L.) were used as the summer fallow crops.
According to 3-year crop rotation schemes, all crops were grown in sequence at a fixed seeding rate
(slightly higher than that employed by local farm-ers). Wheat was sown annually in late September, with 180 kg ha−1 and harvested in the end of June or early July. Corn was sown annually in late April, with 30 kg ha−1 and harvested between 18 and 25 September. Potato was sown annually in late April, with 600 kg ha−1 and harvested between 15 and 25 September. Millet was sown annually in early May, with 22.5 kg ha−1 and harvested in late September. Rapeseed was sown in late September in 1989, with 30 kg ha−1 and harvested in early July. Sorghum was sown in late April in 1990 and 1991, with 37.5 kg ha−1 and harvested in late September. Soybean was sown in late April in 1990 and 1991, with 60 kg ha−1and har-vested in late September. Flax was sown in late April in 1990 and 1991, with 60 kg ha−1and harvested in mid September. The fallow crops were sown in the stand-ing wheat and rapeseed residue immediately after the wheat and rapeseed harvest, and harvested between 15 and 25 September, with a seeding rate of 75 kg ha−1 in soybean, 37.5 kg ha−1 in broomcorn millet and 90 kg ha−1 in common vetch (cutting for forage). Thirty-two 3-year crop rotation systems were estab-lished on sixty-four 3.5 m×10 m plots with a 1.2 m space between plots. Plots were arranged as a random-ized complete block with two replicates. The 32 rota-tion systems were divided into two groups: one with fallow crops (e.g. W+CV−Sg−C (wheat+common vetch−sorghum−corn)) and the other without fallow crops (e.g. C−P−W (corn−potato−wheat)). Wheat monoculture served as the experiment control. Wheat had been grown in the study plots before the experi-ment.
exten-sively applied to the experiment plots once a year before planting. Apart from this, a moderate amount of chemical fertilizer was applied according to soil test recommendations: fertilizer N (urea) at a rate of 86 kg ha−1 and fertilizer P (superphosphate) at a rate of 54 kg ha−1. No potassium was applied. The fallow crops were fertilized with N (urea) at a rate of 69 kg ha−1in broomcorn millet and P (superphos-phate) at a rate of 33 kg ha−1 in both soybean and common vetch. Other field management practices were identical to those employed by local farmers.
2.3. Measurements
Throughout the experiment, all crops were har-vested manually to determine grain yield and above-ground biomass production (grain yield plus crop residue). For each rotation system, grain and biomass yields were determined for each crop. Soil water con-tent was monitored in the following depths: 0−0.1, 0.1−0.2, 0.2−0.3, 0.3−0.5, 0.5−0.75, 0.75−1.0, 1.0−1.5 and 1.5−2.0 m for each plot at 10-day in-tervals with a neutron moisture meter throughout the experiment period. Soil bulk densities in these layers were measured twice: one at the beginning and another at the end of the experiment using sam-ples obtained with an auger. Precipitation data were recorded at the meteorological station in the study site. A more detailed description of the experimental design and treatments is given by Li and Gao (1994).
2.4. Data analysis
Actual evapotranspiration (ET) for each crop, de-fined as the amount of precipitation for the period be-tween sowing and harvesting the particular crop plus or minus the change in soil water storage in the 2 m soil profile, was computed by the soil water balance equa-tion (Xin, 1986; Zhu and Niu, 1987). Runoff was es-timated using a simple model proposed by Forest (see Lhomme, 1991). According to one study in the same region (Xin and Zhao, 1992), the maximum penetra-tion of rainfall in a non-cropped field in a wet year is about 2.5 m but less than 2 m in a cropped field. Hence, percolation loss below 2 m can be assumed negligi-ble. Studies have indicated that the amount of water obtained by crops from the movement of groundwater
upwards approaches zero when the level of ground-water is below 4 m (Zhang, 1980; Yuan, 1984). There-fore, this variable was also assumed negligible because the groundwater level in the study area is below 10 m. Water-use efficiency (WUE), expressed as grain yield or biomass production per unit ET, was first calcu-lated for each crop, then the value for each rotation system was determined based on data of individual crops. To analyze quantitatively the seasonal variation in soil water storage and utilization, the relative de-gree of utilization of soil water storage for crops was determined using the following formula:
RDU=
where RDU is the relative degree of utilization of soil water storage, SWSs is the amount of soil water stor-age at sowing and SWSh is the amount of soil water storage at harvest. The numerator (i.e. SWSs−SWSh) of the equation would allow the estimation of the net soil water storage consumed by crops within a partic-ular time interval.
In addition, the Dunnett-type test of Levy (1975) was employed to determine the differences between the experimental control and other rotation systems. Simple linear regression analysis was used to deter-mine the relationships between evapotranspiration and growing-season precipitation.
3. Results and discussion
3.1. Yield, ET and WUE of individual crops in the rotation
Table 2
Yield, evapotranspiration (ET) and water-use efficiency (WUE) for crops grown in the rotation systems (the value for each crop is an average over two replicates)
Crop SWS at sowing SWS at harvest ET Growing-season Yield WUE
(mm, 2 m) (mm, 2 m) (mm) rainfall (mm) (Mg ha−1) (kg m−3)
Grain Biomass Grain Biomass Eight rotation crops
Winter wheat
1988–1989 464 365 390 291 3.27 9.06 0.84 2.32
1989–1990 446 397 445 396 5.39 14.89 1.21 3.76
1990–1991 478 408 471 401 3.04 8.35 0.65 1.77
Mean 463 390 435 363 3.90 10.77 0.90 2.62
Winter rapeseed
1988–1989 460 354 470 364 1.45 3.28 0.31 0.70
Corn
1989 388 346 403 361 9.29 18.83 2.31 4.67
1990 397 446 475 524 5.99 12.43 1.26 2.62
1991 379 342 365 328 7.30 14.13 2.00 3.87
Mean 388 378 414 404 7.53 15.13 1.86 3.72
Potatoa
1989 402 421 310 329 7.48 9.93 2.41 3.20
1990 425 441 508 524 8.42 10.04 1.66 1.98
1991 379 388 320 329 4.85 6.52 1.52 2.04
Mean 402 417 379 394 6.91 8.83 1.86 2.41
Millet
1989 372 357 319 304 6.67 13.33 2.09 4.18
1990 380 433 488 541 3.66 12.11 0.75 2.48
1991 363 340 325 302 4.73 12.49 1.45 3.84
Mean 372 377 377 382 5.02 12.64 1.43 3.50
Sorghum
1990 372 444 551 623 8.47 17.79 1.54 3.23
1991 425 411 366 352 5.83 15.91 1.59 4.35
Mean 399 428 459 488 7.15 16.85 1.57 3.79
Soybean
1990 342 432 434 524 2.46 5.68 0.57 1.31
1991 360 363 316 319 1.31 3.62 0.41 1.15
Mean 351 398 375 422 1.88 4.65 0.49 1.23
Flax
1990 402 434 313 345 1.35 6.60 0.43 2.11
1991 413 423 281 291 1.42 4.20 0.51 1.49
Mean 408 429 297 318 1.39 5.40 0.47 1.80
Three fallow crops Common vetch
1989 425 452 186 213 2.76 1.48
1990 395 445 222 272 4.41 1.99
1991 409 421 121 133 3.36 2.78
Mean 410 439 176 206 3.51 2.08
Broomcorn millet
1989 383 425 150 192 1.49 5.90 0.99 3.93
1990 402 446 211 255 1.83 6.22 0.87 2.95
Mean 393 436 181 224 1.66 6.06 0.93 3.44
Soybean
1990 395 445 214 264 2.38 6.33 1.11 2.96
were 0.90 kg m−3for wheat and 1.86 kg m−3for corn. By comparison, the wheat value was lower than the value (1.48 kg m−3) reported by Zhu et al. (1994) in a sub-humid region of north China but the corn value was very close to the value (1.94 kg m−3) reported by Zhu et al. (1994). These data compare favourably with values reported by other researchers. Musick and Porter (1990) found WUE values for autumn-planted irrigated wheat ranging from 1.0 to 1.2 kg m−3, but they also cited a number of studies reporting values from 1.4 to 1.6 kg m−3. Rhoades and Bennett (1990) reviewed studies on corn and reported values of 1.2 kg m−3 for Bushland, TX, 1.7 kg m−3 for Davis, CA and 1.9 kg m−3for the southern Negev region of Israel. The WUE values for wheat from the present study are in the low range of the values reported in the literature, but the WUE values for corn are in the upper range of reported values.
In a rainfed cultivation, the water for evapotranspi-ration is furnished partly by growing-season precipi-tation and partly from soil water stored before sowing. However, the relative contribution of soil water stor-age to evapotranspiration (defined as the percentstor-age of soil water consumed by crops relative to evapo-transpiration) varied significantly among years. For wheat, the relative contribution was 25, 11 and 15% for the three cropped seasons, respectively, with an average of 17%. The relative contribution also varied appreciably among crops, particularly between win-ter and summer crops. Soil wawin-ter storage decreased during the wheat growing season, although soil water content remained relatively stable during the winter months (mid-November to the end of March) because of temperatures <0◦C, low soil evaporation and the wheat plant being dormant during the period. On av-erage, about 83% of the water consumed by wheat was derived from growing-season precipitation and the remainder from pre-sowing soil water storage. In contrast, soil water storage tended to increase during the summer crop growing seasons. For corn, the av-erage growing-season precipitation over the 3 years was 404 mm and actual ET was 414 mm, with only 3% of the water consumed by corn being derived from pre-sowing soil water storage. For potato and millet, the average growing-season precipitation over the 3 years was 394 and 382 mm and actual ET was only 379 and 377 mm. Hence, the water consumed by these two crops was furnished completely by
growing-season precipitation. This was also the case for the fallow crops. Because the growing periods of the fallow crops closely paralleled the rainy sea-son (July through September), their growth depends only on growing-period precipitation. In the case of broomcorn millet, growing-period precipitation was 192 and 255 mm in 1989 and 1990 and actual ET was 150 and 211 mm in the respective years. Con-sequently, soil water storage in both years increased by 42 and 44 mm which was available for use by the subsequent crops.
The above result was supported by the outcome of regression analysis on the relationship between ET and growing-season precipitation (P). A non-linear re-lationship existed between ET and P for wheat (ET= 241.64×1.0016P, R2=0.96), suggesting that vari-ation in ET was not only associated with growing-season precipitation but also related to pre-sowing soil water storage. A close positive linear rela-tionship was found between ET and P for corn, potato and millet (ET=118.72+0.6784P, R2=0.87; ET= −33.22+1.0315P, R2=0.99; ET=90.18+ 0.7350P, R2=0.98, respectively), indicating that these crops depend mainly on growing-season precipitation.
3.2. Seasonal and inter-annual patterns of soil water storage and utilization
The relative degree of utilization of soil water stor-age (RDU) varied significantly in the dry and wet years (Table 3). For wheat, the RDU values in the 0−0.5, 0.5−1.0 and 1.0−2.0 m layers were 81, 44 and 26% in the dry year and 54, 39 and 17% in the wet year at the minimum soil water content. The dry year RDU increased by 50% (0−0.5 m), 14% (0.5−1.0 m) and 51% (1.0−2.0 m) compared with the wet year.
Table 3
Seasonal patterns of soil water storage and utilization in different soil layers (m) for the four rotation crops in a representative dry (1989) and wet (1990) yeara
Wheat Corn Potato Millet
0−0.5 0.5−1 1−2.0 0−0.5 0.5−1 1−2.0 0−0.5 0.5−1 1−2.0 0−0.5 0.5−1 1−2.0 SWS at sowing
Dry year 140 116 214 135 127 215 145 135 246 144 134 236
Wet year 142 130 220 150 144 261 146 139 235 143 139 246
At minimum soil water content Dry year
SWS (mm) 26 65 158 53 88 201 55 119 267 90 137 257
RDU (%) 81.4 44.0 26.2 60.7 30.7 6.5 62.1 11.9 – 37.5 – –
Wet year
SWS (mm) 65 80 182 129 131 254 116 137 267 114 145 266
RDU (%) 54.2 38.5 17.3 14.0 9.0 2.7 20.5 1.4 – 20.3 – –
At harvest Dry year
SWS(mm) 29 66 162 88 104 197 116 137 265 128 146 266
RDU (%) 79.3 43.1 24.3 34.8 18.1 8.4 20.0 – – 11.1 – –
Wet year
SWS (mm) 95 113 194 139 135 252 141 138 265 145 142 261
RDU (%) 33.1 13.1 11.8 7.3 6.3 3.4 3.4 0.7 – – – –
aSWS, soil water storage; RDU, relative degree of utilization of soil water storage.
0.5−1.0 m layers and millet depleted only 38% of soil water stored in the 0−0.5 m layer. These data suggest that the water-consuming depth for wheat is deeper than 1 m, whereas the main water-consuming depth is in the 1 m zone for corn and potato and in the 0.5 m soil profile for millet. Studies have shown that winter wheat roots reach to 0.36 m in December, 0.83 m in January, 1.6 m in March and 1.9 m in April (Zhu, Niu and Zhao, unpublished data), as was also found in the present study.
The calculated RDU values at harvest time were significantly lower than at the minimum soil water content in both dry and wet years. The difference was most pronounced in the three summer crops. This is because the summer crops were grown during the pe-riod of high precipitation which occurred in the late part of the growing season, thus resulting in increased soil water storage at harvest time. For this reason, it is not possible to characterize the real status of soil water utilization for these crops simply by using the RDU values calculated at harvest time as an index. A feasi-ble approach for assessing the capacity of the summer crops to utilize soil water storage is to use a comple-mentary set of indices, i.e. not only considering the
RDU values calculated at harvest time but also con-sidering the RDU values calculated at the minimum soil water content.
3.3. Spatial and temporal variation in water stress
Table 4
Onset, duration and end of the water stress period in different soil layers for the four rotation crops in a representative dry (1989) and wet year (1990)
Layer (m) Dry year Wet year Duration (days) Emergence of minimum soil water content
Onset End Onset End Dry year Wet year Dry year Wet year
Wheat
0.0−0.5 17 May 13 July 8 May 26 June 58 50 Mid-June Late-May
0.5−1.0 24 May 16 July 24 May 6 June 54 14 Late-June Mid-May
1.0−2.0 8 June 14 July None None 37 None Early-July Early-June
Corn
0.0−0.5 10 June 14 August None None 66 None Early-August Early-July 0.5−1.0 5 August 22 August None None 18 None Mid-August Mid-August
1.0−2.0 None None None None None None Late-August Late-August
Potato
0.0−0.5 15 June 9 August None None 56 None Early-July Early-July
0.5−1.0 None None None None None None Early-August Mid-July
1.0−2.0 None None None None None None Late-August Late-May
Millet
0.0−0.5 7 June 2 August None None 57 None Mid-July Early-July
0.5−1.0 None None None None None Mid-August Early-June
1.0−2.0 None None None None None None Late-August Late-May
moderate deficit (with soil water content ranging from 40 and 49% of the field water-holding capacity), se-vere deficit (with soil water content ranging from 30 to 39% of the field water-holding capacity) and ex-treme deficit (with soil water content below 30% of the field water-holding capacity). For wheat, water stress was observed not only in the dry year but also in the wet year. In the dry year, water stress in the 0−0.5, 0.5−1.0 and 1.0−2.0 m layers emerged respectively on 17, 24 May and 8 June and ended on 13, 16 and 18 July, lasting for about 58, 54 and 37 days. In the wet year, water stress occurred from 8 May to 26 June in the 0−0.5 m layer and from 24 May to 6 June in the 0.5−1.0 m layer, lasting for about 50 and 14 days. For the three summer crops, water stress occurred only in the dry year. The periods of water stress took place from 10 June to 14 August in the 0−0.5 m layer and from 5 to 22 August in the 0.5−1.0 m layer for corn and from early June to early August in the 0−0.5 m layer for potato and millet.
Winter wheat experienced the most severe water stress among four crops. At sowing, soil water content in all three layers remained above 60% of the field water-holding capacity for any crop in either the dry or the wet year. At the minimum soil water content, soil
water content in the 0−0.5, 0.5−1.0 and 1.0−2.0 m layers for wheat was at extreme, moderate and slight deficit, respectively, in the dry year and at moderate and slight deficit in the 0−0.5 and 0.5−1.0 m lay-ers in the wet year. At this time, however, only in the dry year was soil water content in the 0−0.5 and 0.5−1.0 m layers at severe and slight deficit for corn and soil water content in the 0−0.5 m layer at severe deficit for potato and millet. At harvest, only in the dry year was soil water content in the 0−0.5, 0.5−1.0 and 1.0−2.0 m layers at extreme, moderate and slight deficit for wheat, but not for the other crops.
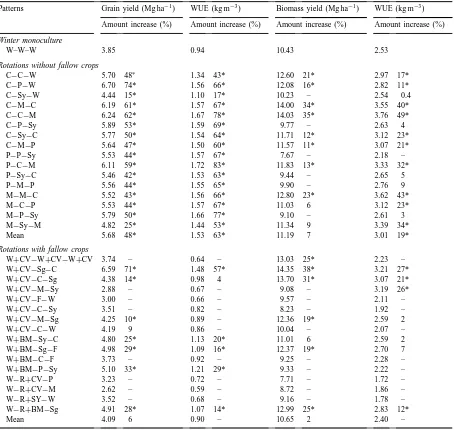
3.4. Agronomic performance and water use patterns for different rotation systems
evapotranspira-Table 5
Average annual grain and biomass yields and water-use efficiency (WUE) for different rotation systems in comparison with wheat monoculture (W−W−W)a
Patterns Grain yield (Mg ha−1) WUE (kg m−3) Biomass yield (Mg ha−1) WUE (kg m−3)
Amount increase (%) Amount increase (%) Amount increase (%) Amount increase (%) Winter monoculture
W–W–W 3.85 0.94 10.43 2.53
Rotations without fallow crops
C−C−W 5.70 48∗
1.34 43* 12.60 21* 2.97 17*
C−P−W 6.70 74* 1.56 66* 12.08 16* 2.82 11*
C−Sy−W 4.44 15* 1.10 17* 10.23 – 2.54 0.4
C−M−C 6.19 61* 1.57 67* 14.00 34* 3.55 40*
C−C−M 6.24 62* 1.67 78* 14.03 35* 3.76 49*
C−P−Sy 5.89 53* 1.59 69* 9.77 – 2.63 4
C−Sy−C 5.77 50* 1.54 64* 11.71 12* 3.12 23*
C−M−P 5.64 47* 1.50 60* 11.57 11* 3.07 21*
P−P−Sy 5.53 44* 1.57 67* 7.67 – 2.18 –
P−C−M 6.11 59* 1.72 83* 11.83 13* 3.33 32*
P−Sy−C 5.46 42* 1.53 63* 9.44 – 2.65 5
P−M−P 5.56 44* 1.55 65* 9.90 – 2.76 9
M−M−C 5.52 43* 1.56 66* 12.80 23* 3.62 43*
M−C−P 5.53 44* 1.57 67* 11.03 6 3.12 23*
M−P−Sy 5.79 50* 1.66 77* 9.10 – 2.61 3
M−Sy−M 4.82 25* 1.44 53* 11.34 9 3.39 34*
Mean 5.68 48* 1.53 63* 11.19 7 3.01 19*
Rotations with fallow crops
W+CV−W+CV−W+CV 3.74 – 0.64 – 13.03 25* 2.23 –
W+CV−Sg−C 6.59 71* 1.48 57* 14.35 38* 3.21 27*
W+CV−C−Sg 4.38 14* 0.98 4 13.70 31* 3.07 21*
W+CV−M−Sy 2.88 – 0.67 – 9.08 – 3.19 26*
W+CV−F−W 3.00 – 0.66 – 9.57 – 2.11 –
W+CV−C−Sy 3.51 – 0.82 – 8.23 – 1.92 –
W+CV−M−Sg 4.25 10* 0.89 – 12.36 19* 2.59 2
W+CV−C−W 4.19 9 0.86 – 10.04 – 2.07 –
W+BM−Sy−C 4.80 25* 1.13 20* 11.01 6 2.59 2
W+BM−Sg−F 4.98 29* 1.09 16* 12.37 19* 2.70 7
W+BM−C−F 3.73 – 0.92 – 9.25 – 2.28 –
W+BM−P−Sy 5.10 33* 1.21 29* 9.33 – 2.22 –
W−R+CV−P 3.23 – 0.72 – 7.71 – 1.72 –
W−R+CV−M 2.62 – 0.59 – 8.72 – 1.86 –
W−R+SY−W 3.52 – 0.68 – 9.16 – 1.78 –
W−R+BM−Sg 4.91 28* 1.07 14* 12.99 25* 2.83 12*
Mean 4.09 6 0.90 – 10.65 2 2.40 –
∗
Significance of differences compared with wheat monoculture at p<0.05.
aW− wheat; C−corn; P− potato; M− millet; Sg− sorghum; Sy− soybean; F−flax; R− rapeseed; CV−common vetch; BM−
broomcorn millet; SY−soybean.
tion when the fallow crops were added to the rotation largely because of better utilization of seasonal precip-itation. On average, the 16 rotations with fallow crops utilized 17 and 27% more precipitation than the 16 rotations without fallow crops and wheat monoculture (Table 6).
Table 6
Water use characteristics of different rotation systems in comparison with wheat monoculturea
Evapotranspiration Growing-season Soil water Precipitation-use (mm) rainfall (mm) supply (mm, 2 m) efficiency (%) Wheat monoculture
(W−W−W) 1235 1018 217 60.4
Rotations without fallow crops
C−C−W 1272 1209 63 71.8
C−P−W 1284 1026 258 60.9
C−Sy−W 1220 1209 11 71.8
C−M−C 1181 1123 58 66.6
C−C−M 1119 1102 17 65.4
C−P−Sy 1112 1107 5 65.7
C−Sy−C 1124 1122 2 66.6
C−M−P 1129 1118 11 66.4
P−P−Sy 1057 1077 −20 63.9
P−C−M 1065 1072 −7 63.6
P−Sy−C 1070 1092 −22 64.8
P−M−P 1075 1088 −13 64.6
M−M−C 1061 1074 −13 63.7
M−C−P 1060 1068 −8 63.4
M−P−Sy 1048 1058 −10 62.8
M−Sy−M 1004 1053 −49 62.5
Mean 1118 1100 65.3
Rotations with fallow crops
W+CV−W+CV−W+CV 1754 1627 127 96.6
W+CV−Sg−C 1339 1268 69 75.3
W+CV−C−Sg 1338 1290 48 76.6
W+CV−M−Sy 1289 1253 36 74.4
W+CV−F−W 1360 1296 136 76.9
W+CV−C−Sy 1284 1253 31 74.4
W+CV−M−Sg 1431 1397 34 82.9
W+CV−C−W 1457 1354 103 80.4
W+BM−Sy−C 1274 1246 27 73.9
W+BM−Sg−F 1372 1397 −25 82.9
W+BM−C−F 1219 1208 11 71.7
W+BM−P−Sy 1261 1231 30 73.1
W−R+CV−P 1341 1173 168 69.6
W−R+CV−M 1336 1158 178 68.7
W−R+SY−W 1545 1320 225 78.3
W−R+BM−Sg 1376 1179 197 70.0
Mean 1374 1291 76.6
a%, as the percentage of growing-season precipitation as annual precipitation.
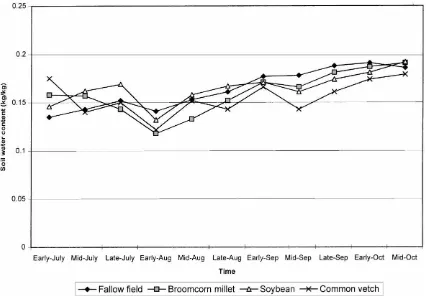
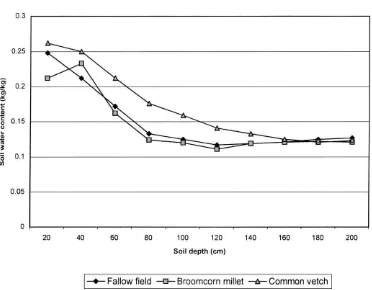
fallow crop fields during the period July to September (Fig. 1). In 1989, a dry year, no significant difference in soil water content at 2 m depth was found between the bare soil and the fallow crop fields at 5 weeks after the cultivation of fallow crops. Even soil water content at 1.2 m depth was slightly higher in the com-mon vetch field than the bare soil at this time (Fig. 2). At the harvest of fallow crops, soil water content at
Fig. 1. Comparison of variation in soil water content at 1 m depth between the bare soil (no fallow crop) and the fallow crop fields during the period July through September in 1990, a wet year.
the total water consumption by the bare soil was very close to the fallow crop fields as a result of very high soil evaporation. Also, the cultivation of fallow crops did not significantly influence the grain production of the subsequent crop. Direct experiment evidence in support of the above finding was that no significant difference in annual grain yield existed between the wheat monoculture (W–W–W) and the wheat plus fal-low crop pattern (W+CV–W+CV–W+CV). The an-nual grain yield of the former was 3.85 Mg ha−1, only slightly greater than that (3.75 Mg ha−1) of the lat-ter, whereas the annual biomass production of the for-mer was 10.43 Mg ha−1, being 25% lower than that (13.03 Mg ha−1) of the latter. Al-Fakhry (1990) re-viewed studies and reported that it is feasible to culti-vate forage, oil crops and pulses as break crops in ce-real monoculture in areas with annual rainfall of over 500 mm, in line with the present study.
3.5. Soil conservation characteristics of different rotation systems
Fig. 2. Comparison of water content in different soil layers between the bare soil (no fallow crop) and the fallow crop fields at five weeks after the planting of fallow crops (mid-August) in 1989, a dry year.
period, thus achieving an year-round plant coverage of the ground. The problem, however, is that produc-tivity of this cropping system often fluctuates up and down because of a poor match between water supply and wheat demand. It appears highly feasible in terms of soil conservation and productivity improvement to cultivate winter wheat followed by a 2–3 month fal-low crop in 1 year and a summer crop cultivation in the next. In this system, the soil is covered during both easily-eroded rainy periods but lies bare about 6 months every 2 years. As most of this 6-month period is winter with low precipitation (snow) and tempera-ture<0◦C, not only is soil evaporation very low but also the risk of erosion is much less.
4. Summary
The study showed that: (1) The relative degree of utilization of soil water storage was greatest in wheat,
Fig. 3. Comparison of water content in different soil layers between the bare soil (no fallow crop) and the fallow crop fields at the harvest of fallow crops (late-September) in 1989, a dry year.
However, the success of this practice is likely to hinge upon (i) the choice of appropriate types and cultivars of fallow crops which must have a short growth cycle and growth property of fast seedling emergence so as to achieve complete cover rapidly and (ii) the need to maintain the nutrient availability for crops by an an-nual supply of both fertilizers and farmyard manure. (4) In terms of soil conservation and productivity improvement, it appears highly feasible to cultivate winter wheat followed by a 2–3 month fallow crop in 1 year and a summer crop cultivation in the next. This system allows the soil to be covered during both easily-eroded rainy periods but lies bare about 6 months every 2 years. As most of this 6-month period is winter with low precipitation (snow) and tempera-ture<0◦C, not only is soil evaporation very low but also the risk of erosion is much less.
Acknowledgements
The authors are grateful to Mrs. Gao Chongyue, Zhang Xiaohu and Li Juncheng in the Qingyang Loess
Plateau Agricultural Experimental Station for their help in conducting the field experiments. Thanks are also expressed to the Ministry of Agriculture of PR China and Gansu Provincial Bureau of the Environ-mental Protection for providing financial support for this study.
References
Al-Fakhry, A.K., 1990. Studies on fallow and the possible alternatives in rainfed region of North Iraq. In: Unger, P.W, Sneed, T.V., Jordan, W.R., Jensen, R. (Eds.), Challenges in Dryland Agriculture. Texas Agricultural Experiment Station, College Station, Texas, pp. 147–149.
Amir, J., Krikun, J., Orion, D., Putter, J., Klitman, S., 1991. Wheat production in an arid environment 1. Water use efficiency, as affected by management practices. Field Crops Res. 27, 351– 364.
Caporali, F., Onnis, A., 1992. Validity of rotation as an effective agro-ecological principle for a sustainable agriculture. Agric. Ecosyst. Environ. 41, 101–113.
Follett, R.F., Stewart, B.A., 1985. Soil Erosion and Crop Productivity. Soil Science Society of America, Madison, Wisconsin.
Francis, C.A., Clegg, M.D., 1990. Crop rotation in sustainable agricultural systems. In: Edwards et al., C.A. (Eds.), Sustainable Agricultural Systems. Soil and Water Conservation Society, Ankeny, IA, pp. 107–122.
Gao Chongyue, Zhang Xiaohu, 1992. Practical significance of multiple cropping in the Loess Plateau regions of China. In: Ren, Jizhou (Ed.), Proceedings of the International Conference on Agroecosystems in the Loess Plateau. Gansu Science and Technology Press, Lanzhou, pp. 198–204.
Hanley, F., Ridgman, W.J., 1978. Some effects of growing winter wheat continuously. J. Agric. Sci. Cambridge 90, 517–521. Levy, K.J., 1975. Comparing variances of several treatments with
a control. Educ. Psychol. Meas. 35, 793–796.
Lhomme, J.P., 1991. A simple modelling of crop water balance for agrometeorological application. Ecol. Modelling 57, 11– 25.
Li, Fengrui, Gao, Chongyue, 1994. An overall evaluation of the effectiveness of soil and water conservation for some rotation systems with fallow crops in a semi-arid loess region of eastern Gansu. Chinese J. Ecol. 3, 51–55.
Li S., 1992. On Harnessing Sloping Lands in Priority Areas of Soil Erosion at the Middle Reaches of the Yellow River. Gansu Science and Technology Press, Lanzhou.
Liu, Zhihan, Liu, Donghai, 1992. An important approach to improving crop productivity in dryland farming systems in the Loess Plateau. In: Ren, Jizhou (Ed.), Proceedings of the International Conference on Agroecosystems in the Loess Plateau. Gansu Science & Technology Press, Lanzhou, pp. 162–166.
Li Fengrui, 1998. Studies on Arid Agricultural Ecosystems. Shanxi Science and Technology Press, Xian.
Musick, J.T., Porter, K.B., 1990. Wheat. In: Stewart, B.A., Nielsen, D.R. (Eds.), Irrigation of Agricultural Crops, Agronomy 30. American Society of Agronomy, Crop Science Society of America, and Soil Science Society of America, Madison, WI, pp. 598–638.
Pu, Jinyong, 1992. Changes in soil water storage and cumulative water consumption for autumn-planted rainfed winter wheat
and the relationships between yield and evapotranspiration in eastern Gansu. Gansu Meteorol. 4, 22–24.
Rhoades, F.M., Bennett, J.M., 1990. Corn. In: Stewart, B.A., Nielsen, D.R. (Eds.), Irrigation of Agricultural Crops. Agronomy 30. American Society of Agronomy, Crop Science Society of America, and Soil Science Society of America, Madison, WI, pp. 569–637.
Shan, Lun, 1993. Theory and practices of dryland agriculture in the Loess Plateau of China. Science Press, Beijing.
Xin, Naiquan, 1986. Calculation of evapotranspiration for croplands using the soil water balance equation in semiarid areas. Agric. Res. Arid Regions 2, 33–40.
Xin, Naiquan, Zhao, Jubao, 1992. Water Status and Its Controlling Techniques in Rainfed Croplands. Agricultural Publishing House, Beijing.
Wang, Lixiang, 1989. A way to exploiting precipitation production potential of rainfed crops in semi-arid and sub-humid regions of northwest China. Chinese J. Natural Resourc. 4 (1), 24–28. Williams, J.R., Renard, K.G., 1985. Soil Erosion and Crop Productivity. In: Follett, R.F., Stewart, B.A. (Eds.), Am. Soc. Agron., Madison, Wisconsin, pp. 67–103.
Yuan, Yuzhi, 1984. An agrometeorological evaluation of precipitation resources in semi-arid and sub-humid regions of central China. J. Meteorol. 42 (4), 440–447.
Yu, Huning, 1992. Eco-physiological effects of winter wheat and the discrimination of drought severity under different soil water regimes. In: Xie, Xianqun, Yu, Huning (Eds.), Relationships between Crops and Water. China Science and Technology Press, Beijing, pp. 142–150.
Zhang, Nairang, 1980. Evaluation of groundwater resources in Hebei province, central China. Haihe Sci. Technol. 8, 45–53. Zhang, Zihe, 1992. Grassland agriculture and its technological
systems. In: Ren, Jizhou (Ed.), Proceedings of the International Conference on Agroecosystems in the Loess Plateau. Gansu Science and Technology Press, Lanzhou, pp. 37–42. Zhu, Zixi, Niu, Xianzeng, 1987. An analysis of the amount and law
of water consumption for winter wheat. Meteorology Monthly Beijing 13 (2), 29–32.