Free-air CO
2
enrichment (FACE): blower effects on wheat
canopy microclimate and plant development
P.J. Pinter
a,∗Jr., B.A. Kimball
a, G.W. Wall
a, R.L. LaMorte
a, D.J. Hunsaker
a,
F.J. Adamsen
a, K.F.A. Frumau
b, H.F. Vugts
b, G.R. Hendrey
c, K.F. Lewin
c,
J. Nagy
c, H.B. Johnson
d, F. Wechsung
e, S.W. Leavitt
f, T.L. Thompson
g,
A.D. Matthias
g, T.J. Brooks
haU.S. Water Conservation Laboratory, USDA, Agricultural Research Service,
4331 East Broadway Road, Phoenix, AZ 85040, USA
bVrije Universiteit, Amsterdam, Netherlands cBrookhaven National Laboratory, Upton, Long Island, NY, USA
dGrassland Soil and Water Research Laboratory, USDA, Agricultural Research Service, Temple, TX, USA ePotsdam Institute for Climate Impact Research, Potsdam, Germany
fLaboratory of Tree Ring Research, University of Arizona, Tucson, AZ, USA gDepartment of Soil, Water, and Environmental Science, University of Arizona, Tucson, AZ, USA
hMaricopa Agricultural Center, University of Arizona, Maricopa, AZ, USA
Received 1 November 1999; received in revised form 22 March 2000; accepted 24 March 2000
Abstract
Free-air carbon dioxide enrichment (FACE) provides a realistic, cost-effective method for evaluating the effects of supra-ambient CO2concentrations on growth, development, yield, and water use of agricultural crops and natural ecosystems with
very few of the problems normally associated with glasshouse or chamber type research. There are no walls interfering with incident radiation and no artificial constraints on rooting depth. With current FACE technology, CO2enriched air is injected
around the perimeter of circular plots and natural wind disperses the CO2across the experimental area. Under stable,
night-time wind conditions found in FACE wheat experiments at Maricopa, Arizona, the blowers used to inject CO2exerted subtle
effects on the microclimate in a manner analogous to wind machines used for orchard frost protection. Plots equipped with blowers had nighttime foliage and air temperatures that averaged 0.6–1.0◦C warmer than controls without blowers. A
sec-ondary effect of these elevated temperatures was that plots equipped with blowers displayed differences in dew duration (time that leaves were wet was reduced 30%), plant development (anthesis occurred 4 days earlier), and senescence [as measured with the normalized difference vegetation index (NDVI)]. Natural wind and turbulence appear to overcome the blower effect during daytime treatments and on some nights. Aerial thermal imagery (8–12mm) acquired during the 1998 FACE
experi-ment with grain sorghum provided additional evidence of the blower effect on canopy temperatures. Since increased plant tissue temperatures also occur when elevated CO2induces partial stomatal closure and reduces transpiration, not all instances of
∗Corresponding author. Tel.:+1-602-379-4356;
fax:+1-602-379-4355.
E-mail address: [email protected] (P.J. Pinter Jr.)
canopy temperature elevation in CO2enriched plots can be ascribed solely to the presence of blowers. It is concluded that
proper controls for FACE facilities should have similar air flows to those used in the FACE plots. Advantages and disadvantages to nighttime CO2enrichment are discussed. © 2000 Elsevier Science B.V. All rights reserved.
Keywords: Wheat; Triticum aestivum; Carbon dioxide; Climate change; Microclimate; Canopy temperatures; Canopy reflectance; Leaf wetness
1. Introduction
Free-air carbon dioxide enrichment (FACE) was developed to expose plants to elevated levels of CO2 under natural field conditions while minimizing the microenvironmental and climatic artifacts often asso-ciated with open-top chambers or glasshouse culture (Hendrey, 1993; Hendrey et al., 1993; Dugas and Pinter, 1994). This new technology has made it pos-sible to make realistic assessments of the effects of anticipated, 21st century atmospheric CO2 concentra-tions on yields of agricultural crops growing in large scale production fields (Pinter et al., 1996; Kimball et al., 1997a). Performance metrics have shown that the FACE facility provides very good tempo-ral and spatial control of CO2 concentrations and is a cost-effective means for large scale fumigation experiments (Kimball, 1992; Nagy et al., 1994). Carbon isotope studies have likewise confirmed that the plants actually ‘see’ the intended exposure con-centrations over the entire season (S.W. Leavitt and H.B. Johnson, unpublished data).
Strategies for CO2 exposure and the sophistica-tion of ambient CO2control plots have evolved over the years as FACE was applied to different ecosys-tems and as experimental objectives changed. As is usually the case in application of any new technol-ogy, changes were also made as more was learned about system behavior under different environmental conditions. For example, in cotton experiments con-ducted from 1987 through 1991, the FACE plots had blowers to promote uniform mixing of the CO2with the air entering the plots, and enrichment was only done during daylight hours. Control plots were not equipped with blowers because studies had shown that the CO2-rich air injected into the plots from the vertical standpipes was essentially dissipated within 2 m from the injection ports (Lipfert et al., 1992) and did not intrude upon experimental zones where plant observations were taken. Dummy plastic mani-folds and standpipes (without blowers) were added to
Control plots in 1990 and 1991, to make early season microclimate (e.g. windbreak) and visual clues to migrating pests more similar to the FACE plots.
In 1992, when the focus of the agricultural FACE project shifted to spring wheat (Kimball et al., 1995, 1999; Pinter et al., 1996), emerging evidence that ele-vated CO2could inhibit plant respiration (e.g. Reuveni and Gale, 1985; Amthor, 1991; Bunce and Caulfield, 1991; Bunce, 1992) led to a decision to apply CO2 enrichment on a 24-h basis. During the first 2 years of FACE experimentation in wheat (1992–1993 and 1993–1994), Control plots had dummy plastic mani-folds and standpipes but were not equipped with blow-ers. However, with the new 24-h protocol, CO2levels of FACE plots remained near the intended 550mmol mol−1 set point while CO2 in Control plots would occasionally soar to 800 or 1000mmol mol−1during calm periods at night. Workers taking measurements in the field early in the morning and around sundown also noticed more dew in the Control plots than in FACE plots.
Thus, we began to suspect that the gas injection was inducing microturbulence into the boundary layer above the canopy at night in the FACE plots. If that were true, there would be a temperature perturbation that could explain the nighttime differences in CO2 concentrations between FACE and Control plots and the crepuscular dew phenomena. Likewise, a temper-ature difference might provide an alternative expla-nation for a major portion of what appeared to be CO2-related differences in wheat crop development and end-of-season maturity as reported by Kimball et al. (1995) and Pinter et al. (1996).
distance from the FACE and Blower plots to better understand the ‘blower effects’. These plots were referred to as Ambient plots and were functionally equivalent to the Control plots from the two earlier wheat experiments. They were equipped with dummy plastic manifolds and vertical release pipes but re-ceived neither extra CO2 nor forced air movement. The purpose of this paper is to compare microcli-mate and plant responses among the FACE, Control, Blower, and Ambient plots. This information should be useful when designing future FACE experiments.
2. Methods
2.1. Location and general description of experiment
Experiments were conducted during four growing seasons in a 10-ha field located at the University of Arizona Maricopa Agricultural Center (MAC), Maricopa, Arizona, USA. A hard red spring wheat,
Triticum aestivum L cv Yecora Rojo, which is
pho-toperiod insensitive and does not require vernaliza-tion, was sown in mid-December, emerged between 1 and 3 January, and was harvested in late May or early June of each year. The soil was classified as a reclaimed Trix clay loam (fine-loamy, mixed (calcare-ous), hyperthermic Typic Torrifluvents). Application of water and fertilizer was accomplished via subsur-face drip irrigation.
2.2. FACE plot hardware and operational control of CO2
The FACE technique was used to enrich the air in circular plots within a wheat field similar to prior experiments in cotton (Hendrey, 1993; Hendrey et al., 1993; Wall and Kimball, 1993; Mauney et al., 1994; Dugas and Pinter, 1994; Wechsung et al., 1995; Kimball et al., 1995, 1999; Pinter et al., 1996; Hunsaker et al., 1996). Briefly, four replicate, 25 m diameter toroidal plenums (rings) constructed from 0.305 m diameter plastic pipe were placed in the field shortly after planting. The center-to-center spacing between rings was∼90 m (Wall and Kimball, 1993). Each ring had 2.5-m-high vertical stand pipes with individual valves spaced about every 2.5 m around the periphery (Wall and Kimball, 1993; Lewin et al.,
1994). Air enriched with CO2was blown at a rate of 40 m3 air min−1 into the plenum and exited through tri-directional jets in the stand pipes at elevations near the top of the crop canopy.
The amount of CO2 released into the FACE plots was based on feedback from CO2concentrations and wind speeds measured near the center of each plenum. Wind direction was used to open valves on stand pipes on the upwind side, so that CO2-enriched air flowed across the plots no matter which way the wind blew. At wind speeds below the 0.4 m s−1detection threshold of the anemometers, CO2-enriched air was released from alternate standpipes around the rings. The CO2 flow rates were updated every second, and the choice of which vertical pipes to release from was updated every 4 s. Analysis of daytime data from the FACE cotton experiments showed the 1-min-average CO2 concen-trations remained within 10% of the desired set point 90% of the time (Nagy et al., 1994).
2.3. FACE (elevated CO2) plots
The FACE treatment was applied continuously from emergence to maturity during all four exper-imental years. During the first two seasons (1992– 1993 and 1993–1994), the target CO2 set point was a constant 550mmol mol−1 both day and night. For the second two seasons (1995–1996 and 1996–1997) the FACE plots were enriched to a nom-inal 200mmol mol−1 above ambient levels.1 This resulted in average CO2concentrations for the FACE plots of ca. 548mmol mol−1 during daylight hours and ca. 598mmol mol−1at night.
1 Ambient CO
2concentrations averaged 360mmol mol−1during
daylight hours but varied widely based on time of day, wind-speed, soil moisture, and other environmental factors. A separate sequential sampling system was used to measure CO2
concen-tration in each FACE and Blower plot as well as from the two Ambient plots. The minimum value from among the most recent observations of the four Blower and two Ambient plots was se-lected as the background ambient level against which to reference the 200mmol mol−1enrichment in the FACE plots. Selecting the
minimum value, generally resulted in choosing the signal from the most upwind plot, thereby avoiding signal contamination by the supplemental CO2 added to the FACE plots. However, since
the mixing of the air layers during calm nighttime conditions had the effect of reducing CO2 concentrations at the canopy level in
2.4. Control plots (1992–1993 & 1993–1994)
For the initial two seasons of the FACE wheat project, the control treatments (i.e. background or am-bient CO2 plots) were equipped with dummy plastic manifolds and standpipes. There were no blowers and no attempt to mimic the air flow conditions associated with the FACE plots.
2.5. Blower plots (1995–1996 & 1996–1997)
During the second 2 years of the experiments, an air injection system was installed in the control plots (hereafter called ‘Blower’ plots) to provide air move-ment similar to that of the FACE plots (Kimball et al., 1999). The Blower plots had toroidal plenums like the FACE plots, but they only had half the num-ber of stand pipes. There were no valves on the pipes. Thus, the blower supplied air continuously to all the pipes, and the release locations were not changed in response to changing wind direction as was done in the FACE treatment plots. This strategy was justified because the air flow from the blower appeared to be affecting microclimate and CO2concentrations under low wind speed conditions when the FACE plots were being operated in the mode of releasing CO2-enriched air from every other vertical pipe.
2.6. Ambient plots (1995–1996)
In addition to the four Blower and the four FACE plots, two ‘Ambient’ plots were established in the field for the 1995–1996 experiment. They had no me-chanical air movement and no CO2 enrichment, and thus were very similar to the Control plots in years 1992–1993 and 1993–1994 (e.g. Wall and Kimball, 1993). Both Ambient plots were intentionally posi-tioned in the far northwest corner of the field, as far as possible (∼90 m) from microclimatic disturbances that might result from the regular Blower and FACE plots of Replicate 1 (see Fig. 1 of Kimball et al., 1999). They had similar plastic pipes and walkways, and except for having no CO2enrichment or blowers, they were treated the same as the Blower and FACE plots. In retrospect, we discovered that the Ambient plots were positioned in an area of the field where overall conditions (perhaps initial soil fertility or
water holding characteristics) were more favorable and yield potentials were higher. In the following analysis, we present air and canopy temperatures and dew durations from the Ambient plots. We exclude supporting data on plant phenology, grain yield, and senescence because those data may have been biased by the field’s inherent spatial variability.
2.7. Micrometeorological observations
mean Tf in a method analogous to a growing degree day computation.
Presence or absence of dew (‘leaf wetness duration’) was measured during the 1995–1996 sea-son with printed circuit card sensors (Model 237-L, Campbell Scientific, Logan, UT) in plots equipped with IRTs. The sensors were painted with a gray la-tex paint (Gillespie and Kidd, 1978) to improve their performance. They were mounted at an angle of 45◦ below horizontal and oriented toward the northwest. For the first 3 months they were close to the soil surface, but then it was realized that dirt and insect deposits were affecting their output. Beginning on 4 April 1996, they were raised to the top of the canopy and cleaned weekly with distilled water. Spurious data and observations acquired when the sensors were obviously contaminated were excluded from the analysis.
Air temperatures were measured with a sin-gle, shielded fine-wire (0.12 mm diameter) copper– constantan thermocouple at 10 cm above the wheat canopies (as well as other heights) near the center of each IRT-equipped plot. Thermocouple height was adjusted weekly. All sensor outputs were scanned every minute using data logging systems (Models CR7 and CR21X, Campbell Scientific, Logan, UT), and 15-min averages were recorded, as well as the 1-min observations for the IRTs.
2.8. Maize plant survival
As part of a separate carbon isotope discrimination study, 20 dwarf maize plants (Zea mays ssp. mays L. cv Gaspe and Morden) were transplanted into 1.1 m×0.3 m mini-plots in each of the main experi-ment subplots during late January in 1994. Several cold nights followed, killing many of the frost sen-sitive maize plants. Counts comparing survival of maize plants in Control and FACE plots were made on 10 February 1994.
2.9. Wheat plant phenology
The developmental age of the wheat canopy was determined from plants sampled from each subplot at 7–10 day intervals throughout each season. Main stems were assigned growth stages according to the
Zadoks’ scale of plant development (Zadoks et al., 1974; Bauer et al., 1983). Dates when plants reached the midpoint of select stages (tillering, stem elonga-tion, booting, heading, anthesis, milk development, soft dough, and ripening) were computed via linear in-terpolation and then averaged for all replicates within a treatment combination.
2.10. NDVI of wheat canopies
Frequent measurements of canopy reflectance fac-tors provided a continuous record of green biomass accumulation and a practical method for quanti-fying end-of-season senescence (viz. Idso et al., 1980) associated with crop maturity. Data were ac-quired in red (0.61–0.68mm) and near-infrared (NIR, 0.79–0.89mm) wavelengths using a handheld ra-diometer (Model 100BX, Exotech, Gaithersburg, MD) equipped with 15◦ field-of-view optics. Twenty-four nadir measurements were taken along a transect in a 6 m×3 m area that was later harvested for final yield. Reflectance factors were computed as ratios of directional canopy radiances to time interpolated, hemispheric irradiances inferred from frequent mea-surements of a BaSO4 reference panel that was calibrated in terms of its bidirectional reflectance properties (Jackson et al., 1992). Data were obtained 2–5 times per week at a morning time period corre-sponding to a solar zenith angle of 57◦.2 The nor-malized difference vegetation index was computed as: NDVI=(NIR−Red)/(NIR+Red). Comparisons of NDVI were made between FACE and Control plots during the first 2 years of the experiment and between FACE and Blower plots in the second 2 years.
3. Results
3.1. Foliage and air temperatures
Daytime Tf in the FACE plots averaged 0.6◦C warmer than the Blower plots for much of the grow-ing season [a CO2-induced stomatal closure effect
2 Canopy reflectance factors are directional, being dependent
Fig. 1. Diurnal trajectory of foliage temperature differences (◦C) measured with stationary IRTs during the FACE Wheat experiment in 1995–1996. Data are average differences (±1 S.E.) observed at 15-m intervals over 71 days for which good data were available from 6 February 1996 (tillering) through 29 April 1996 (∼soft dough). Contrasts are shown between plots equipped with blowers but having different CO2 treatments (FACE minus Blower) and
between plots at the same CO2 concentration with and without
blowers (Blower minus Ambient).
(see Garcia et al., 1998)], while nighttime differences between FACE and Blower were small (Fig. 1). By contrast, Tf in the Ambient plots remained ca. 1◦C cooler than the Blower plots during the night with only a small difference during the day. Long term differences in Ta at+10 cm (Fig. 2) displayed trends that were similar to Tf although the absolute differ-ences were slightly less. In a separate, short-term study (results not shown here), Ta was also mea-sured along a transect crossing the boundary between a blower-equipped FACE plot and the surrounding wheat canopy. During calm periods, we observed a discontinuity in Ta at the edge of the plots, adding to the evidence that blowers altered microclimate.
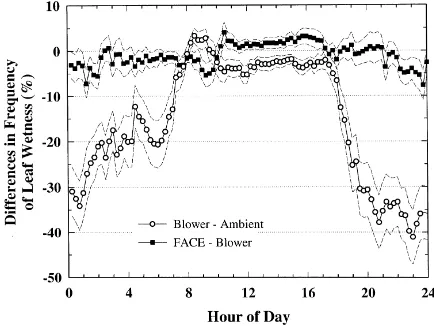
3.2. Leaf wetness
Not unexpectedly, we observed striking differences in the leaf wetness parameter measured in each of the treatments (Fig. 3). Slightly lower temperatures in plots without blowers resulted in earlier evening dew formation and longer persistence in the morning. At night the Ambient plots were wet 30% longer than the Blower plots, while there was little difference between
Fig. 2. Diurnal trajectory of air temperature differences (◦C, mean±1 S.E.) measured at+10 cm above the canopy using shaded, fine-wire thermocouples from late January until late April dur-ing the FACE Wheat experiment in 1995–1996. Contrasts are shown between plots equipped with blowers but having different CO2treatments (FACE minus Blower) and between plots at
ambi-ent CO2 concentrations with and without blowers (Blower minus
Ambient).
Fig. 3. Differences in the frequency of leaf wetness measured with Campbell Scientific, Inc. printed circuit card sensors during 15 min intervals over 73 days for which good data were available from 6 February 1996 (tillering) through 7 May 1996 (soft dough). Data are average percentage differences of the time when leaves were wet (±1 S.E.). Contrasts are shown between plots equipped with blowers but having different CO2 treatments (FACE minus
Blower) and between plots at the same CO2 concentration with
Fig. 4. Percent survival of dwarf maize plants (Z. mays ssp. mays cv Gaspe and cv Morden)≈2 weeks after transplanting into Control (ambient CO2, no blower) and FACE plots (550mmol CO2mol−1,
with blower) during the 1993–1994 FACE Wheat experiment. Data are mean survival of plants (±1 S.E.). There were four replicates of 20 plants in each treatment combination.
Blower and FACE plots. Although not observed in our experiments, we believe that such differences in the time that leaves are wet have the potential to influence the incidence of plant diseases and affect arthropod infestations.
3.3. Maize plant survival
We observed a significant (p≤0.05) difference in survival of maize plants that was dependent on pres-ence or abspres-ence of blowers (Fig. 4). In Control plots (without blowers), 68% of the plants were killed by cold temperatures that occurred shortly after they were transplanted. Mortality was only 22% among maize transplanted into the FACE plots. The difference in survival between plants in wet and dry irrigation treat-ments was not statistically different.
3.4. Wheat plant phenology
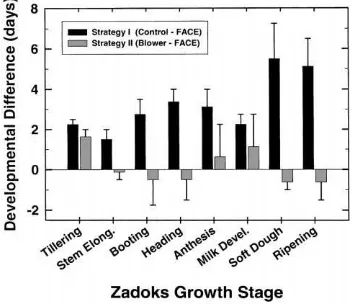
Developmental differences between plants that were grown under different blower configurations were apparent to researchers and project visitors alike, especially at times of heading, anthesis, and maturity. Seeking to quantify these differences, we interpolated the phenological data from the frequent plant sam-ples and estimated the date when the plants in each plot reached the midpoint of each of eight
princi-pal growth stages from tillering to ripening (Zadoks et al., 1974; Bauer et al., 1983). We then computed the difference in chronological time required to reach a specific growth stage between plots with and without blowers (i.e. Control minus FACE for 1992–1993 and 1993–1994) and also between plots having blowers but exposed to either ambient or elevated CO2levels (i.e. Blower minus FACE for 1995–1996 and 1996–1997). This comparison revealed that amply watered and fertilized plants reached each growth stage from 2 to 5 days sooner when grown in a blower-equipped plot, while the CO2 treatment by itself appeared to have minimal effect on developmental rates (Fig. 5). Paired ‘t’ tests showed the average differences in phenol-ogy between FACE and Control during 1992–1993 and 1993–1994 were relatively large and highly significant (p≤0.001) under both irrigation regimes (Table 1). Developmental differences between FACE and Blower treatments during 1995–1996 and 1996–1997 were <0.5 days and only under deficit
Fig. 5. Differences in time (days±1 S.E.) required for plants to reach specified growth stages when exposed to different ‘control’ strategies during the FACE wheat experiment. Strategy I, em-ployed during the first two seasons (1992–1993 and 1993–1994), shows the difference between Control and FACE response when controls were not equipped with blowers. A positive value for Strategy I indicates that plants in CO2-enriched, blower-equipped
plots had an accelerated development compared with plots having neither CO2enrichment nor blowers. Strategy II, used during the
1995–1996 and 1996–1997 seasons, shows the time difference be-tween response of plants in Blower and those in FACE when both treatments were equipped with blowers. Small values for Strategy II suggest little effect of CO2by itself on plant development. Only
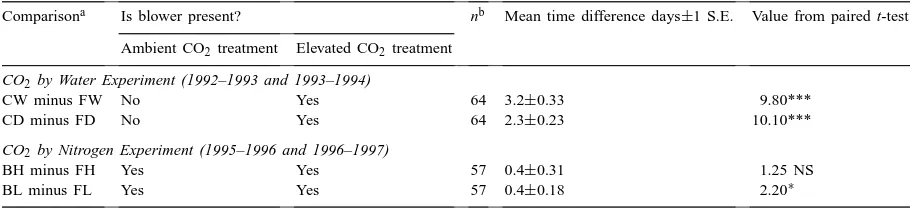
Table 1
Mean differences in the time required to reach each of eight primary growth stages (tillering→ripening) between different Blower and CO2configurations used during the FACE Wheat experiments at Maricopa, AZ
Comparisona Is blower present? nb Mean time difference days±1 S.E. Value from paired t-test
Ambient CO2 treatment Elevated CO2 treatment
CO2by Water Experiment (1992–1993 and 1993–1994)
CW minus FW No Yes 64 3.2±0.33 9.80***
CD minus FD No Yes 64 2.3±0.23 10.10***
CO2by Nitrogen Experiment (1995–1996 and 1996–1997)
BH minus FH Yes Yes 57 0.4±0.31 1.25 NS
BL minus FL Yes Yes 57 0.4±0.18 2.20∗
∗, ***Significant at the 0.05 or 0.001 probability levels, respectively.
aTreatment abbreviations: C, Control; B, Blower; F, FACE; W, Wet (ample) irrigation; D, Dry (deficit) irrigation; H, High (ample)
nitrogen; L, Low (deficit) nitrogen.
bRefers to the total number of paired observations. Only three replicates were available for t-test comparisons during most of the
1996–1997 experiment.
nitrogen conditions were the differences between CO2treatments statistically significant (p≤0.05).
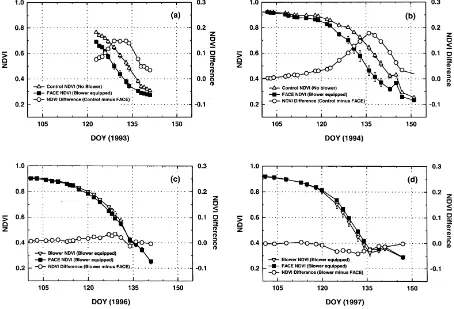
3.5. Rates of canopy senescence
Plant canopies in the FACE treatment changed from completely green to yellow and then brown ca. 1 week before plants in the Control treatments during the 1992–1993 and 1993–1994 experiments. This was ap-parent visually and was also evident in the tempo-ral trends of NDVI, which in this case were used to quantify post-anthesis changes in whole canopy greenness (Fig. 6a and b). However, NDVI differences were not detected between Blower and FACE plots in 1995–1996 or 1996–1997 (Fig. 6c and d), suggesting that canopy senescence, like stage of growth, might be a microclimatic artifact associated with the pres-ence of blowers rather than a developmental response to CO2.
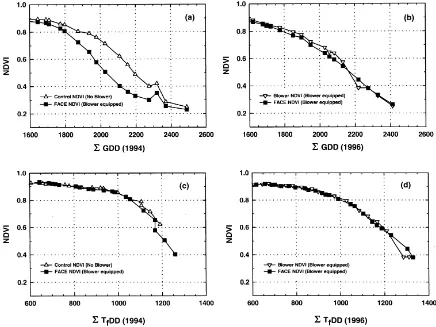
3.6. NDVI versus cumulative plant temperatures
Further evidence linking blowers to accelerated phenology comes from a set of graphs showing NDVI as a function of developmental time (i.e. ac-cumulated temperatures instead of chronological time). The NDVI from FACE and Control treatments in1993–1994 (Fig. 7a), and FACE and Blower treat-ments in 1995–1996 (Fig. 7b) are plotted versus the
traditional cumulative growing degree-day parame-ter (6GDD), computed as the average of maximum and minimum daily air temperatures (with a base temperature=0◦C) from a nearby meteorological sta-tion (AZMET, Brown, 1989). The data of Fig. 7a show approximately a 100 GDD separation between plots with and without blowers which is roughly equivalent to the time separation shown earlier in Fig. 6a and b. When however, the ordinate axis was changed from6GDD to a cumulative thermal index derived from the IRT temperatures of plant tissues in each plot (i.e. the foliage temperature degree-day index,6TfDD), the once separate, NDVI senescence curves from Control and FACE (Fig. 7a) fused to-gether into a single trend line (Fig. 7c). Because Blower and FACE treatments had similar foliage tem-peratures, their NDVI senescence curves remained coincident when plotted versus6TfDD (Fig. 7d). In as much as temperature is generally conceded to have a dominant, controlling effect on wheat plant devel-opmental rates, we interpret this as causal evidence that the blowers accelerated plant maturity indirectly by increasing plant tissue temperatures.
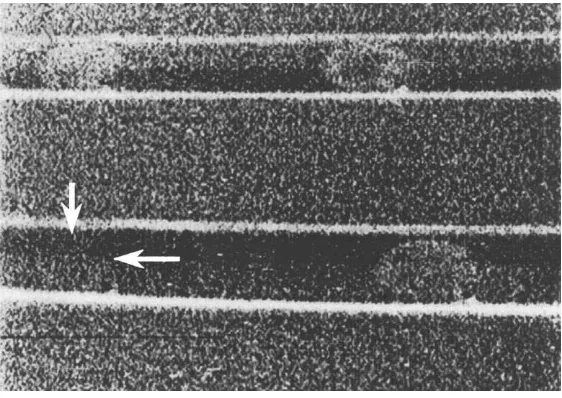
3.7. Thermal images from the 1998 FACE project in grain sorghum
Fig. 6. Time-based trajectories of the normalized difference vegetation index (NDVI; mean±1 S.E.) and NDVI difference measured throughout the grain filling period during 4 years of FACE Wheat experiments at Maricopa, AZ. Only data from plots with optimum management (i.e. ample water and N treatments) and also having IRTs are shown. Abbreviation: DOY, day of year.
FACE apparatus and present those findings here be-cause of their relevance to documenting the spatial extent of the blower perturbation in an agricultural crop. The image shown in Fig. 8 was obtained just before dawn on 19 November during the 1998 FACE Sorghum experiment. It was acquired using a ther-mal scanner (Model 760, Inframetrics, Billerica, MA) deployed on a helicopter flown at≈150 m above the canopy. This oblique view of the east half of the ex-perimental field (∼5 ha in size) shows relative plant canopy temperatures (8–12mm, uncorrected for sur-face emissivity) with warmer values represented as lighter shades of gray. The image includes four exper-imental rings (2 FACE and 2 blower-equipped Control plots) within the field of view of the scanner. Three
Fig. 7. Temperature-based trajectories of the normalized difference vegetation index (NDVI; mean±1 S.E.) measured throughout the grain filling period during the 1993–1994 and 1995–1996 FACE Wheat experiments at Maricopa, AZ. (a) and (b) show NDVI as a function of growing degree-days (6GDD) based on air temperature (◦C) measured at a nearby agricultural meteorological station and accumulated
from emergence. (c) and (d) show NDVI as a function of a foliage temperature (◦C) degree-day index (6T
fDD) measured using stationary
IRTs within each plot and accumulated from late January through the end of the growing season. As soon as the FACE plots matured, CO2enrichment was halted and the IRT data loggers were turned off. As a result, the NDVI of (c) and (d) does not fall to the low values
seen in (a) and (b). Direct comparisons between6GDD and6TfDD are not valid due to different starting dates for the accumulation and
the fact that IRTs were out of service 1 day each week while they were rotated to new field locations. Only data from plots with optimum management (i.e. ample water and N treatments) are shown.
4. Discussion
4.1. Blower effects on microclimate
We observed a measurable effect of FACE blow-ers on canopy microclimate that was most evident at night when wind speeds were typically low and at-mospheric stability near the ground was high. In our study, plants growing in blower-equipped plots were
Fig. 8. Thermal image obtained at 0551 h on 19 November 1998 in the FACE Sorghum field. Canopy cover is∼100%. Clockwise from the upper left corner are FACE rep 2, Control rep 2, and FACE rep 1. The blower fans were turned off in Control rep 1 which is located in the lower left corner but cannot be seen in this image (arrows). Lighter shades of gray represent warmer surfaces. Bold horizontal stripes are irrigation ditches.
in microclimate can have important biological conse-quences when a temperature threshold is crossed. This was illustrated by the differential survival of maize plants following the frost events of 1994 (Fig. 4). Of course, maize is more susceptible to low temperatures than wheat, and no overt effects of the cold were ob-served on survival of the wheat plants.
Researchers at the loblolly pine FACE site in the Duke Forest found a slight increase in mean wind speed within the tree canopy that was associated with the FACE apparatus, but were unable to detect any change in mean air temperatures (He et al., 1996). There are substantial differences in stand geometry and apparatus configuration (the ratio of FACE ring diameter to canopy height in the forest site was 3:1 compared to 10:1 for the FACE wheat site) as well as differences in nighttime wind and radiative cool-ing patterns that could possibly account for dissim-ilarities in micrometeorology between the two sites. The cup-type anemometers we used in our study pre-cluded three-dimensional analysis of wind speeds in the FACE wheat project, but the foliage temperatures and other data presented in this report provide a defini-tive, season-long record of microclimate perturbation.
4.2. Blower effects on wheat development, maturity, and grain yields
What about CO2 effects on grain yield of wheat? We originally reported only a 10% increase in yield for wheat exposed to CO2at 550mmol mol−1and sup-plied with adequate water and nutrients, suggesting that plants in the Control treatment had additional op-portunity to ‘catch up’ with the sink-limited FACE plants. We now believe that this figure was probably an underestimate of the true CO2 effect that might have been observed during the first two seasons had the controls been properly equipped with blowers and the grain filling duration of both CO2treatments been similar. In fact, during the 1995–1996 and 1996–1997 experiments, grain yields for adequately fertilized and well-watered wheat showed a 15% increase associ-ated with a nominal+200mmol mol−1CO2elevation. This translates into a CO2enhancement (β) factor of
∼28% for a doubling of atmospheric CO2 concentra-tions,3 an increase which compares favorably with the 33% average for agricultural crops reported by Kim-ball (1983).
4.3. Why use blowers?
Given the microclimatic disturbances associated with the use of blowers in FACE experiments, the question arises as to why blowers are used in the design. In early studies using the free-air gas en-richment concept, large fluctuations in the experi-mental gas concentration were frequently observed (Shinn and Allen, 1985). There was some concern that plants would respond to rapid fluctuations in at-mospheric CO2 concentrations differently from the slower changes typically observed in nature. Hendrey et al. (1997) found this to be true for CO2 concen-tration fluctuations lasting more than 1 min. It was determined that dilution of CO2 prior to its release into the plant canopy could reduce the magnitude of CO2 fluctuations within the arrays (Hendrey et al., 1992). The momentum provided by the blower also improved the spatial distribution of CO2 under low wind conditions. Other FACE approaches that elimi-nate blowers and emit pure CO2 at the perimeter of the plots are now in use. However, these designs are reported to have more inherent variation in CO2
con-3For this extrapolation we are assuming a linear increase in the
CO2effect on yield and 720mmol mol−1 for a doubling of CO2
{[(720−360)/360]/[(550−360)/360]}*15%=28% increase.
centrations and more difficulty maintaining a target concentration than designs using blowers, especially under calm wind conditions.
4.4. Analogies to orchard wind machines
In retrospect, blower effects on nighttime microcli-mate of FACE plots under stable air conditions might have been anticipated. Air movement warmed the Blower plots at night, just like wind machines that citrus growers have used for frost protection since the 1950s (e.g. Baker, 1955; Brooks et al., 1961). In a typical citrus installation, large fans are mounted above the orchard on 10-m-tall masts. They rotate completely every 4–5 min, so that a plume of dis-turbed air sweeps over the trees in a large circle, disrupting the layer of cold air that has settled near the ground and mixing in warmer air from above. Such wind machines only provide frost protection when the ambient air is still enough for cool temperature layers to form near the orchard canopy. They do not work under windy conditions. Typically, fans with 100 Hp (75 kW) motors protect 4 ha (Blank and Ven-ner, 1995), which amounts to 1.8 W m−2 of external energy supplied to the system. Although the geometry and jet configuration of a FACE ring are very dif-ferent from an orchard wind machine, 2 Hp (1.5 kW) blowers supply energy to 25 m-diameter rings, which amounts to 3.0 W m−2, i.e. more energy than the cit-rus growers use to disturb the microclimate of their orchards deliberately on frosty nights.
4.5. Nighttime CO2enrichment?
These observations of blower effects on FACE ring microclimate raise the issue of whether or not to en-rich the apparatus with CO2 at night. Indeed, some of the FACE sites around the world presently restrict their operation to daylight hours only.4 As already mentioned, reports exist in the literature and continue to be published (see Drake et al., 1999) about the pos-sible effects of elevated CO2on respiration (although none of several investigators were able to detect any effect of elevated CO2on the dark respiration of wheat
4 The Carbon Dioxide Information Analysis Center (CDIAC) in
in any of the 4 years of experiments described in the present paper). Despite these reports, there are sev-eral reasons why enrichment at night might be ques-tionable. (1) Blower-induced temperature artifacts can have a far larger effect on plant biology than the ef-fect caused by CO2alone. (2) Blower-equipped plots might not be truly representative of outside field CO2 conditions during nights when the air is extremely sta-ble. (3) The CO2concentrations of the air are relatively high at night anyway, so the increment added by the FACE experiment is relatively smaller and may fall in the domain of diminishing returns on affecting plant processes. (4) Plant growth models have routines that attempt to simulate the turbulent transfer of mass and energy by the wind, and if the blowers are affecting this transport more than natural wind at night, then the data can not easily be used for such validation. (5) The effects of elevated CO2 at night on dark respiration probably are small compared the daily carbon budget. (6) Lastly, the expense of enriching at night is high, adding 25–30% to the CO2costs for the experiments. This dilemma about whether or not to enrich at night is not unique to FACE experiments. Researchers using open-top chambers also need to consider, for example, whether increased evaporation due to air movement in their chambers is sufficiently objectionable that they should stop operation at night. However, with such systems researchers usually recognize that the walls are already changing the microclimate considerably whether the blowers are on or off, so they often elect to operate them at night anyway (e.g. Kimball et al., 1997b).
5. Conclusions
The FACE technique approaches natural condi-tions more closely than open-top chambers or other means of exposing plants to elevated CO2. Important advantages include an unmodified light environment, unrestricted rooting volume, and large experimental areas. Nevertheless, the blowers used to inject CO2 in an agricultural field in the Arizona desert warmed the canopy by ca. 1◦C during the night, and they also decreased the duration of time that the leaves were wet from dew. These differences in microclimate, although small, can be cumulative and were demon-strated to affect plant development. Therefore, it is
recommended that control plots for FACE experi-ments should be configured and operated similarly to the FACE enrichment plots, especially if they are to be run on a 24-h per day basis.
Considering the potential for errors discussed above, investigators using FACE may reasonably choose one of two operating strategies. The first is to run the system only during daytime in order to avoid microclimate effects potentially associated with nighttime operation and to reduce operating costs sig-nificantly. With this strategy, one accepts a potential for error due to the lack of inhibition of respiration at night. The second is to operate 24 h per day, but accept the higher operating costs and a potential for microclimate disturbance at night that in some cir-cumstances can be biologically significant. Since the major photosynthetic and stomatal effects of CO2 occur during daytime, it seems that possibility for microclimate disruption at night may introduce the larger error. Even accepting this potential error, the FACE approach remains the best way to create con-ditions that are representative of agricultural fields in a future high-CO2world.
Acknowledgements
obtained by Mr. Tom Clarke. We acknowledge the cooperation of Dr. Roy Rauschkolb (deceased) and his staff (Dr. Bob Roth and Mr. Pat Murphree) at The University of Arizona Maricopa Agricultural Center. The FACE apparatus was furnished by Brookhaven National Laboratory. This work contributes to the Global Change and Terrestrial Ecosystems (GCTE) Core Research Programme, which is part of the Inter-national Geosphere–Biosphere Programme (IGBP).
References
Amthor, J.S., 1991. Respiration in a future, higher-CO2world Cell
Environ. 14, 13–20.
Baker Jr., G.A., 1955. Mean airflow and heat transport patterns generated by wind machines with applications to frost protection. Trans. Am. Geophys. Union 36, 954–962. Bauer, A., Smika, D., Black, A., 1983. Correlation of five wheat
growth stage scales used in the Great Plains. Advances in Agric Technology, AAT-NC-7, Agricultural Research Service, US Dept. Agric., ISSN0193-3701, pp. 1–17.
Blank, S.C., Venner, R., 1995. Evaluating the cost-effectiveness of risk-reducing inputs: wind machines for citrus. HortTechnology 5, 165–170.
Brooks, F.A., Leonard, A.S., Crawford, T.V., Schultz, H.B., 1961. Frost protection by wind machines and heaters, Trans. of the ASAE 4, pp. 192–198, 202.
Brown, P.W., 1989. Accessing the Arizona Meteorological Network by computer. Cooperative Extension Rep. 8733, University of Arizona, College of Agriculture, 26 pp.
Bunce, J.A., 1992. Stomatal conductance, photosynthesis and respiration of temperate deciduous tree seedlings grown outdoors at an elevated concentration of carbon dioxide. Plant, Cell Environ. 15, 541–549.
Bunce, J.A., Caulfield, F., 1991. Reduced respiratory carbon dioxide efflux during growth at elevated carbon dioxide in three herbaceous perennial species. Ann. Bot. 67, 325–330. Drake, B.G., Azcon-Bieto, J., Berry, J., Bunce, J., Dijkstra,
P., Farrar, J., Gifford, R.M., Gonzalez-Meler, M.A., Koch, G., Lambers, H., Siedow, J., Wullscheleger, S., 1999. Does elevated atmospheric CO2 concentration inhibit mitochondrial
respiration in green plants? Plant Cell Environ. 22, 649–657. Dugas, W.A., Pinter Jr., P.J., (Eds.), 1994. The free-air carbon
dioxide enrichment (FACE) cotton project: a new field approach to assess the biological consequences of global change, Agric. For. Meteorol. 70, 1–342.
Garcia, R.L., Long, S.P., Wall, G.W., Osborne, C.P., Kimball, B.A., Nie, G.Y., Pinter Jr., P.J., LaMorte, R.L., 1998. Photosynthesis and conductance of spring wheat leaves: field response to continuous free-air atmospheric CO2 enrichment. Plant Cell
Environ. 21, 659–669.
Gillespie, T.J., Kidd, G.E., 1978. Sensing duration of leaf moisture retention using electrical impedance grids. Can. J. Plant Sci. 58, 179–187.
He, Y., Yang, X., Miller, D.R., Hendrey, G.R., Lewin, K.F., Nagy, J., 1996. Effects of FACE system operation on the micrometeorology of a loblolly pine stand. Trans. ASAE 39, 1551–1556.
Hendrey, G.R. (Ed.), 1993. FACE: Free-Air CO2 Enrichment for
Plant Research in the Field. C.K. Smoley, Boca Raton, FL, 308 pp.
Hendrey, G.R., Lewin, K.F., Kolber, Z., Evans, L.S., 1992. Controlled enrichment system for experimental fumigation of plants in the field with sulfur dioxide. J. Air Waste Manage. Assoc. 42, 1324–1327.
Hendrey, G., Lewin, K., Nagy, J., 1993. Control of carbon dioxide in unconfined field plots. In Schulze, E.D., Mooney, H.A. (Eds.), Design and Execution of Experiments on CO2
Enrichment, Report No. 6, Ecosystems Research Report Series, Environmental Research Programme, Commission of the European Communities, Brussels, pp. 309–327.
Hendrey, G.R., Long, S.P., McKnee, I.F., Baker, N.R., 1997. Can photosynthesis respond to short-term fluctuations in atmospheric carbon dioxide? Photosynth. Res. 51, 179–184.
Hunsaker, D.J., Kimball, B.A., Pinter Jr., P.J., LaMorte, R.L., Wall, G.W., 1996. CO2 enrichment and irrigation effects on wheat
evapotranspiration in a free-air environment. Trans. ASAE 39, 1345–1355.
Idso, S.B., 1981. A set of equations for full spectrum and 8- to 14-mm and 10.5- to 12.5-mm thermal radiation from cloudless skies. Water Resour. Res. 17, 295–304.
Idso, S.B., Pinter Jr., P.J., Jackson, R.D., Reginato, R.J., 1980. Estimation of grain yields by remote sensing of crop senescence rates. Rem. Sens. Environ. 9, 87–91.
Jackson, R.D., Clarke, T.R., Moran, M.S., 1992. Bi-directional calibration results for 11 Spectralon and 16 BASO4 reference reflectance panels. Rem. Sens. Environ. 40, 231–239. Kimball, B.A., 1983. Carbon dioxide and agricultural yield: a
assemblage and analysis of 430 prior observations. Agron. J. 75, 788–799.
Kimball, B.A., 1992. Cost comparisons among CO2 enrichment,
open top chamber and sunlit controlled environment chamber methods of CO2exposure. Crit. Rev. Plant Sci. 11, 265–270.
Kimball, B.A., Pinter Jr., P.J., Garcia, R.L., LaMorte, R.L., Wall, G.W., Hunsaker, D.J., Wechsung, G., Wechsung, F., Kartschall, Th., 1995. Productivity and water use of wheat under free-air CO2 enrichment. Global Change Biol. 1, 429–442.
Kimball, B.A., Pinter Jr., P.J., Wall, G.W., Garcia, R.L., Hunsaker, D.J., LaMorte, R.L., 1997a. Effects of elevated CO2on cotton
and wheat as determined from FACE experiments. J. Agric. Meteorol. 52, 787–796.
Kimball, B.A., Pinter Jr., P.J., Wall, G.W., Garcia, R.L., LaMorte, R.L., Jak, P., Frumau, A., Vugts, H., 1997b. Comparison of responses of vegetation to elevated CO2 in open-air and
enclosed exposure facilities. In. Allen, L.H., Jr., Kirkham, M.B., Olszyk, D.M., Whitman, C.E. (Eds.), Advances in Carbon Dioxide Research, ASA Special Publication No. 61, Am. Soc. Agron., Crop Sci. Soc. Am., and Soil Sci. Soc. Am., Madison, WI, pp. 113–130.
Matthias, A.D., Brooks, T.J., 1999. Free-air CO2 enrichment
(FACE) and soil nitrogen effects on energy balance and evapo-transpiration of wheat. Water Resour. Res. 35 (4), 1179–1190. Lewin, K.F., Hendrey, G.R., Nagy, J., LaMorte, R.L., 1994. Design and application of a free-air carbon dioxide enrichment facility. Agric. For. Meteorol. 70, 15–29.
Lipfert, F.W., Alexander, Y., Hendrey, G.R., Lewin, K.F., Nagy, J., 1992. Performance analysis of the BNL FACE gas injection system. Crit. Rev. Plant Sci. 11, 143–163.
Mauney, J.R., Kimball, B.A., Pinter Jr., P.J., LaMorte, R.L., Lewin, K.F., Nagy, J., Hendrey, G.R., 1994. Growth and yield of cotton in response to a free-air carbon dioxide enrichment (FACE) environment. Agric. For. Meteorol. 70, 49–68. Nagy, J., Lewin, K.F., Hendrey, G.R., Hassinger, E., LaMorte, R.,
1994. FACE facility CO2 concentration control and CO2 use
in 1990 and 1991. Agric. For. Meteorol. 70, 31–48.
Pinter Jr., P.J., Kimball, B.A., Garcia, R.L., Wall, G.W., Hunsaker, D.J., LaMorte, R.L., 1996. Free-air CO2enrichment: responses
of cotton and wheat crops. In: Koch, G.W., Mooney, H.A. (Eds.), Carbon Dioxide and Terrestrial Ecosystems. Academic Press, San Diego, pp. 215–248.
Reuveni, J., Gale, J., 1985. The effect of high levels of carbon dioxide on dark respiration and growth of plants. Plant Cell Environ. 8, 623–628.
Shinn, J.H., Allen, L.H., 1985. An evaluation of free-air carbon dioxide enrichment (FACE) as a field method for investigation of direct effects of carbon dioxide on plants. UCRL-93635, US Department of Energy, Carbon Dioxide Effects Division, Washington, DC, 164 pp.
Wall, G.W., Kimball, B.A., 1993. Biological databases derived from free air carbon dioxide enrichment experiments. In Schulze, E.D., Mooney, H.A. (Eds.), Design and Execution of Experiments on CO2Enrichment, Commission of the European
Communities, Brussels, pp. 329–351.
Wechsung, G., Wechsung, F., Wall, G.W., Adamsen, F.J., Kimball, B.A., Garcia, R.L., Pinter Jr., P.J., Kartschall, Th., 1995. Influence of elevated atmospheric CO2 concentrations on root
characteristics — preliminary results of the free-air carbon dioxide-wheat experiment Maricopa 1992/3. J. Biogeo. 22, 623–634.