SATELLITE DRIVEN ESTIMATION OF PRIMARY PRODUCTIVITY OF
AGRO-ECOSYSTEMS IN INDIA
N. R. Patel1, V. K. Dadhwal2, S. Agrawal1 and S. K. Saha1
1
Indian Institute of Remote Sensing, Dehradun, India 2National Remote Sensing Centre, Hyderabad, India
*Corresponding author : N. R Patel ([email protected])
Commission VIII, WG VIII/6
KEY WORDS: Earth observation, ecosystem modeling, gross primary productivity, SPOT-VEGETATION, agro-ecosystem
ABSTRACT:
Earth observation driven ecosystem modeling have played a major role in estimation of carbon budget components such as gross primary productivity (GPP) and net primary production (NPP) over terrestrial ecosystems, including agriculture. The present study therefore evaluate satellite-driven vegetation photosynthesis (VPM) model for GPP estimation over agro-ecosystems in India by using time series of the Normalized Difference Vegetation Index (NDVI) from SPOT-VEGETATION, cloud cover observation from MODIS, coarse-grid C3/C4 crop fraction and decadal grided databases of maximum and minimum temperatures. Parameterization of VPM parameters e.g. maximum light use efficiency (*) and Tscalar was done based on eddy-covariance measurements and literature survey. Incorporation of C3/C4 crop fraction is a modification to commonly used constant maximum LUE. Modeling results from VPM captured very well the geographical pattern of GPP and NPP over cropland in India. Well managed agro-ecosystems in Trans-Gangetic and upper Indo-Gangetic plains had the highest magnitude of GPP with peak GPP during kharif occurs in sugarcane–wheat system (western UP) and it occurs in rice-wheat system (Punjab) during Rabi season. Overall, croplands in these plains had more annual GPP (> 1000 g C m-2) and NPP (> 600 g C m-2) due to input-intensive cultivation. Desertic tracts of western Rajasthan showed the least GPP and NPP values. Country-level contribution of croplands to national GPP and NPP amounts to1.34 Pg C year-1 and 0.859 Pg C year-1, respectively. Modeled estimates of cropland NPP agrees well with ground-based estimates for north-western India (R2 = 0.63 and RMSE = 108 g C m -2). Future research will focus on evaluating the VPM model with medium resolution sensors such as AWiFS and MODIS for rice-wheat system and validating with eddy-covariance measurements.
1. INTRODUCTION
Global land ecosystems in recent time appeared as major sink of global carbon cycle and curtailing the increasing CO2 concentration in the atmosphere (Zhao and Running, 2009). Henceforth, the quantification of regional contribution from terrestrial ecosystems to global carbon budget is a necessity. Terrestrial primary productivity is key component of carbon cycle and is quantified as amount of carbon fixed by plants via photosynthesis and accumulated as biomass. As of now most studies related to primary productivity and carbon budget in India and abroad have focused on forest ecosystem due to their potential to sequester high magnitude of atmospheric CO2. Agro-ecosystems have received less attention by carbon science groups worldwide and in India, in-spite of they covers around 15 million km2 all over the world and about more than half of land area in India. Besides there are evidences that intensively managed agro-ecosystems act as a CO2 sink in the terrestrial biosphere (e.g., Law et al., 2002; Barford et al., 2003; Hollinger et al., 2004). Recent model simulation by Bondeau et al.(2007) suggested that a net sink of 0.61–0.75 Gt C year-1 in the 1990s occurred in global agriculture-related areas. In past, few studies based on crop yield and area statistics yielded a varying estimates of total cropland NPP in India ( i.e., 0.407 Pg C in 1989 (Dadhwal et al., 1996; Dadhwal and Chabra, 2002), 0.63 Pg C in 1980 (Hingane, 1991). NPP databases from crop statistics are area-based and thus lacking spatial detail required for agro-ecosystem management and ecosystem related services.
Satellite remote sensing has provided unique capability to monitor global and regional dynamics of vegetation properties and has been widely used in net primary productivity assessment (Prince and Goward, 1995; Potter et al., 2003; Running et al., 2004). The remote sensing of NPP mainly follows light use efficiency (LUE) concept (Monteith, 1977) that describes carbon assimilation in plants is proportional to product of light absorption and light use efficiency as nearly constant or approximated for diverse ecosystems :
NPP = PAR × FPAR × ε (1)
Where NPP is net primary productivity for season or year (g C m -2), PAR is phtosynthetically active radiation in Mega Joule (MJ),
stress) of maximum light use efficiency (*) obtained from
meteorological variables which is mostly coarse over space and time (Nayak et al., 2009; Singh et al., 2011). Furthermore, climatological information may not correctly captures stress occurred in managed agroecosystems with variable input of advanced cultivars, fertilizer and irrigation. Recently newer LUE models (e.g. VPM, EC-LUE) have been implemented with the use of stress indices derived from SWIR band as measure of water stress scalar in biospheric NPP models and found that the inclusion of a water stress parameter directly from satellite improves accuracy of NPP modeling (Xiao et al. 2005).
Moreover, validation of simulated NPP from satellite driven ecosystem models over agricultural areas is a challenging task where coordinated net-work of eddy-covariance towers are lacking. Validation of model NPP estimates with some independent measure of carbon uptake based on crop statistics holds key importance in carbon cycle research (Lobell et al.
2002). In view of improving method for estimating GPP or NPP over vast croplands in India, we chose to apply a relatively new vegetation photosyntheisis model with aim of driving model with more satellite remote sensing inputs and subsequently validation with crop NPP assessment from agricultural census data.
2. MATERIALS AND METHODS
2.1 Overview of VPM model
The VPM model is based on contribution of photosynthetically active vegetation (PAV) and non-photosynthetic vegetation (NPV) to fraction of PAR absorbed by canopy (fPAR.). Thus VPM algorithm is based on LUE, PAR, and the fraction of PAR absorbed by photosynthetic active vegetation or chlorophyll (fPARchl):
GPP = × FPAR
chl × PAR (2) FPARchl = α × EVI (3) = * × Tscalar × Wscalar × Pscalar (4)
where * is maximal light use efficiency. Tscalar, Wscalar and Pscalar are the down-regulation scalars for the effects of temperature, water and leaf phenology on the LUE of vegetation type, respectively. EVI is the enhanced vegetation index derived from reflectance in blue, Red and NIR wavelength regions.
In general EVI is used in VPM model because GPP is more sensitive to EVI in high biomass areas. In our study we explored use of normalized difference vegetation index (NDVI) based equation for fPAR estimation within VPM because NDVI had a wider range and is more sensitive to low biomass areas of most croplands in arid and semi-arid arid environment. We used fPAR-NDVI relationship developed by Myneni and Williams (1994) based on radiation transfer models that was also found to remain remains robust in the presence of pixel heterogeneity, vegetation clumping, and variations in leaf orientation and optical properties.
fPAR = a ×NDVI + b (5)
where a and b are empirical constants. In our study, a and b are set to 1.24 and 0.168 according to Sims et al. (2005)
Tscalar is estimated at each time step, using the equation developed for the Terrestrial Ecosystem Model (Raich et al.,1991):
(T – Tmin) (T- Tmax)
Tscalar = --- (6)
[(T – Tmin) (T – Tmax)] – (T – Topt)2] where, T is daytime mean temperature, obtained as average of maximum and mean temperatures on daily basis. Tmin, Tmax, and Topt are the minimum, maximum and optimum temperature for photosynthetic activities, respectively.
In VPM, water stress effects on photosynthesis in terms of Wscalar was quantified using land surface wetness index (LSWI) that is sensitive to canopy water stress. The LSWI is a linear combina-tion of NIR and SWIR bands and calculated as:
2
NIR - 2SWIR
LSWI = --- (7) 2NIR + 2SWIR
where NIR and SWIR are reflectances in NIR (780-890 nm) and SWIR (1580–1750 nm) regions, respectively, for each 10-day composite of SPOT-VEGETATION data in present study. We used LSWI to estimate seasonal dynamics of the water stress scalar (Wscalar) based on the simple approach of Xiao et al. (2005):
1 + LSWI
Wscalar = --- (8) 1- LSWImax
where LSWImax is the maximum LSWI within the wheat growing season for individual pixels.
Pscalar was set to 1 because of leaf emergence in dominantly growing crops such as rice and wheat is throughout growing season (Xiao et al., 2005)
Net Primary Productivity (NPP) is the balance between GPP and autotrophic respiration (Ra) and hence described as:
NPP = GPP- Ra (9)
The autotrophic respiration is affected by air temperature (T, °C) and gross primary production as describe by the following empirical relationship (Furumi et al, 2002):
Ra = GPP*[(1.825 + 1.145T)/100] (10) 2.2 Parameterization of VPM model
In general, VPM model needs three parameters. Firstly, maximum light use efficiency, * has to be set which is vegetation dependent. The * can be parameterized as ecosystem quantum yield based on the Michaelis-Menten light response function. In the present study, maximum ecosystem yield parameterized based on eddy-covariance measurements over wheat was taken as representative of C3 crops (1.37 g C MJ-1 APAR) in sub-tropical India (Patel et al., 2011). For C4 crops, value of the * (1.64 g C
pixel was also taken into account by weighting of single maximum LUE of C3/C4 crops by proportion of C3 and C4 crops as well as native grasslands (Ramakutty and Foley, 2000) in each 5 minute grid uniformly. Finally maximum * each 1km pixel of
cropland was obtained as :
* = LUEc3 × propc3 + LUEC4× propC4 + LUEgrass× propgrass (11)
Where, LUEc3, LUEc4 and LUEgrass are maximum light use efficiency of C3, C4 and grass. The propc3, propC4 and propgrass are the fraction of C3 crops, C4 crops and grassland for each 1km pixel of cropland areas derived from multi-temporal SPOT-Vegetation data (Agrawal et al., 2003).
Secondly, Tscalar needs setting of maximum, minimum and optimum temperature for photosynthetic activity of each typical vegetation type. The values of Tmin, Tmax and Topt for c4 crops were taken as 8, 30 and 42 °C, respectively (Black, 1973; Wang et al., 2010). For C3 crops, we used 5.0, 40.0 and 25.0 °C for Tmin,
Tmax, and Topt, respectively (Huang et al., 2008) 2.3 Data sets and processing
2.3.1 Satellite data processing: Vegetation indices such as
NDVI, EVI and LSWI forms a basics time series input to drive VPM model for GPP estimation. So we acquired VGT-S10 (10-day synthesis product) of NDVI and radiometric reflectance values of blue (430–470 nm), red (610–680 nm), near-infrared (NIR, 780–890 nm), and shortwave infrared (SWIR, 1580–1750 nm) bands. The standard VGT-S10 data were obtained by selecting the VGT-S1 pixels that have the maximum Normalized Difference Vegetation Index (NDVI) values within a 10-day period. The Maximum value composite reduced atmospheric effect and cloud contamination. The VGT-S10 products are freely available to the public (http://free.vgt.vito.be). Data on NDVI and radiometric reflectance were acquired during a period from May 2003 – April 2004 on a global scale. A subset of all images corresponds to India were generated by using India boundary mask. For removing cloud cover effects and smoothening of time-series of NDVI, 10-day NDVI datasets were filtered using wavelet filtering algorithm. Other indices e.g. EVI and LSWI were calculated using original reflectance values at top of atmosphere considering the fact that these indices are less affected by atmospheric aerosols and increasing cloud cover.
2.3.2 Estimation of global radiation: The photosynthetically
active radiation in present study is taken as 45% of solar radiation estimated from MDIS cloud clover observations (www.neo.nasa.gov). We have used Angstrom–Prescott formula (Angstrom, 1924; Prescott, 1940) with relative sunshine from cloud cover observations as following :
G = RA (A + B* S) (12)
Where, G and RA represent daily total of global solar radiation (MJ m−2 d−1) and extraterrestrial radiation (MJ m−2 d−1), A and B are site specific coefficients and derived for each grid by using spatially referenced geographical coordinates and altitude (GTOPO30) as per method suggested by Bandopadhyay et al., 2008). Sum of A and B together represents atmospheric transparency index (ATI). S is relative sunshine index (S = n/N) and is estimated from monthly cloud cover observations.
2.3.3 Meteorological and ancillary data: Daily meteorological
data particularly air temperatures (Maximum and minimum temperatures) at 1-degree grid were obtained from National climate data centre, IMD. This interpolated gids of temperature derived from network of weather stations in India (Rajeevan et al., ). Location of major cropping pattern was decided based on pre-dominant district of individual cropping (Atlas of Cropping System, PDCSR, ICAR, India). The profile of GPP and NPP for major cropping system extracted by taking 3×3 pixel in the centre of district having pre-dominance of cropping system.
Carbon uptake from cropland was also independently estimated from annual crop production data at district level. These cropland statistics were downloaded from website of Ministry of Agriculture (www.). The crop statistical data are compiled for various districts. Analysis of data was restricted to 20 major crops grown with criteria of crop being included if area more than 10 thousand hectares in each state. Many steps were followed to convert harvestable product into NPP at district level. These includes conversion of unit of harvestable product into common unit of grams and then converted to NPP by using values of moisture content (MC) and harvest index (HI, ratio of harvestable produce to total plan dry weight) and root:shoot ratio (Rrs) of crops obtained from published literature over India. The present study also assumes that 45% of crop biomass is C and above ground biomass accounts 80% of total crop biomass (Lobell et al., 2002). The crop land NPP is thus expressed as gram C per unit area and is calculated as (Lobell et al., 2002). Lower and upper estimates of ground-based cropland NPP over India for 2003-04 estimated by taking HI ± SD and Rrs ± SD.
3. RESULTS AND DISCUSSION
3.1 Spatial pattern of primary productivity
Information on primary productivity on a high-resolution grid assumes significant importance in identifying appropriate agricultural practices of carbon sequestration. In this context, VPM model run over croplands in India on 1km grid using decadal forcing, and pattern of both gross and net productivity (GPP & NPP) on annual-scale is presented in figure 1.
Spatially, the patterns of GPP and NPP have similar fashion, and hence reveal a close dependence of NPP on GPP as compared to climate that controls autotrophic respiration. On annual basis, both the GPP and NPP have showed large spatial variability. Gross and net primary productivity over croplands in India ranged from 200 – 1500 and 50 – 1000 g C m-2, respectively. Annual modeled NPP of cropland was ranged from very little (50 g C m -2
India have significant contribution to carbon storage by terrestrial biosphere in India. Total GPP and NPP modeled by VPM over vast croplands in India amounts to 1.34 Pg C and 0.859 Pg C, respectively. The estimates of cropland NPP from VPM was found to be higher than ground-based cropland NPP (0.61 – 0.70 Pg C) due to contribution of grasses, fallow land and weeds to NPP at 1km pixel. If extreme outliers by 5 percentile on both side of NPP excluded, the modeled total cropland NPP become close to 0.7 Pg C and cropland area matches with net-sown area ( 1.46 m ha) The mean GPP and NPP was in the tune of 807 and 515 g C m-2, respectively. The contribution of croplands is more than half of total NPP of terrestrial biosphere reported in India and agrees well with the cropland NPP estimates from CASA for the same year (Nayak et al., 2010).
Fig.1. Spatial pattern of annual primary productivity over cropland in India during 2003-04 from VPM 3.2 Temporal pattern of GPP over major crop rotations
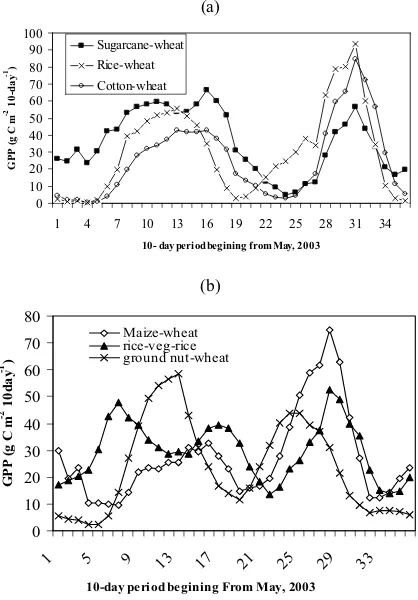
Time-evolution of carbon uptake in agro-ecosystem differs from natural ecosystems and is a key to understand influence of phenology, environmental and cropping practice such as crop rotation and C4/C3 crop mixture. Henceforth, the time-series of modeled GPP on decadal time scale extracted for various crop rotation practiced dominantly in selected districts and presented in figure 2a & b. Well managed agro-ecosystems in Trans-Gangetic and upper Indo-Gangetic plains had two distinct peaks with
highest magnitude of GPP. Peak GPP during kharif occurs in sugarcane–wheat system (western UP) and same occured in rice-wheat system (Punjab) during Rabi season. Sugarcane-rice-wheat system in western UP had the highest annual GPP (1295 g C m-2) because of longer persistence of high magnitude of GPP (60 g C m-2 10day-1) in sugarcane due to C4 photosynthesis mechanism and longer duration of active growing season.
The cropping systems, however, in semi-arid areas have comparatively less magnitude of GPP throughout the growing season. The crop rotations such as groundnut-wheat in Junagadh, Gujarat and maize-wheat in Udaipur, Rajasthan had two peaks but little less GPP on annual scale. In eastern state, triple crop system such has rice-vegetable-rice in west-bengal had three distinct peaks of GPP but the magnitude of GPP during each crop growing season was considerably less
(a)
0 10 20 30 40 50 60 70 80 90 100
1 4 7 10 13 16 19 22 25 28 31 34
10- day period begining from May, 2003
G
PP
(g
C
m
-2 1
0
-da
y
-1)
Sugarcane-wheat Rice-wheat Cotton-wheat
(b)
0 10 20 30 40 50 60 70 80
1 5 9 13 17 21 25 29 33
10-day period begining From May, 2003
G
PP (
g
C
m
-2 10d
a
y
-1 )
Maize-wheat rice-veg-rice ground nut-wheat
Fig. 2 Temporal variation in GPP over major cropping during 2003-04 growing season in India
3.3 Temporal pattern of mean cropland NPP
steadily due to maturity and crop senescence till 22nd dekad in a year. The NPP was found to remains constant around 15 g C m-2 10day-1 during periods of December. The NPP in rabi season showed remarkable increase from January and reached to peak in mid of February and decline drastically from March onwards due to harvest of crops.
Fig. 3.Seasonal variation in modeled estimates of mean NPP over cropland in India. Bar shows ± standard deviation
3.4 Validation of cropland NPP
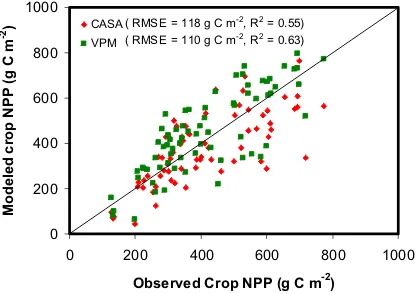
An evaluation of our results is difficult because of the lack of ground data representative biomass measurements at 1km resolution as well as footprint scale eddy covariance measurements. Despite these limitations, modeled performance was evaluated using agricultural census data. Crop NPP modeled using VPM was compared against ground based NPP at district falling in arid, semiarid and sub humid climatic setting. A 1:1 plot (Fig. 4) showed that cropland NPP from VPM was in close agreement with ground-based crop NPP at district level for northwest India (R2 = 0.63). The root mean square error associated with modeled NPP was 110 g C m-2.
Fig. 4. Comparison of modelled cropland NPP against ground-based NPP
The present study also revealed that VPM model with more inputs from satellite could yield similar or improved estimates of cropland NPP over that of previously published estimates of CASA (R2 = 0.55, RMSE = 118 gC m-2). The reason may be the accurate capture of water related constrains on NPP by satellite
based land surface wetness index in areas of irrigated agriculture. The results on NPP estimates commensurate with previous reports (Lobell et al., 2002) which reveals that regions with irrigation practices may not be modeled accurately since environmental stresses predicted by meteorological conditions is not ideally applied to irrigated agriculture. When comparison made over predominantly sub-humid region comprising districts of Uttarpradesh and Haryana, the modeled cropland NPP had relatively weak agreement with ground based cropland NPP (R2
= 0.35, RMSE = 128 g C m-2).
4. CONCLUSIONS
The present study explores potential of VPM model for estimating GPP and its seasonal dynamics over agro-ecosystems in sub-tropical environment. The VPM model seems applicable to Indian subcontinent having large area of croplands and predominantly arid-semi arid climatic regimes. The VPM model with more rely on satellite inputs such as vegetation indices (NDVI, LSWI), cloud cover based radiation, temperature and maximum light use efficiency (*) parameter for individual crop
species or crop group is capable for estimating regional GPP. Estimation of GPP from with simple formulation of autotrophic respiration could yield satisfactory estimates of net primary productivity over croplands. Although modeled NPP agrees well with large area estimate of crop NPP based on crop yields, Validity of VPM based GPP/NPP for particular crop rotation needs to be investigated using flux-tower measurements. Future research shall attempt to validate the capability of the VPM model in capturing the inter-annual GPP variations and interaction with environmental variables.
REFERENCES
Agrawal, S., Joshi, P. K., Shukla, Y. and Roy, P.S., SPOT VEGETATION multi temporal data for classifying vegetation in south central Asia. Current Science, 2003, 84, 1440-1448. Barford, C.C., Wofsy, S.C., Goulden, M.L., Munger, J.W., Hammond,
Black, C. C., 1973. Photosynthetic carbon fixation in relation to net CO2 uptake . Ann. Rev. Plant Physiol. 24 : 253-286.
Dadhwal, V.K. and Chhabra, A., (2002). Landuse/ land-cover change in Indo-Gangetic plains: cropping pattern and agroecosystem carbon cycle. In: Landuse Change Historical Perspectives: Focus on Indo-Gangetic Plains (Eds.Y.P. Abrol, S. Sangwan, S. and M.K. Tiwari), Allied Publishers Pvt. Ltd., pp. 249-276.
Dadhwal,V.K., Shah, A. and Vora, A.B., (1996). Changes in carbon flow through Indian groecosystem between 1950-51 and 1985-86. J. Environmental Biology, 17(4), 323-328.
Field, C. B., Randerson, J. T., & Malmstrom, C. M. (1995). Global net primary production: Combining ecology and remote
sensing. Remote Sensing of Environment, 51, 74–88.
Hingane, L. S., Some aspects of carbion dioxide exchange between atmosphere and indian plant biota. Climatic Change,
1991, 18, 425-435
Hollinger, D.Y., Aber, J., Dail, B., Davidson, E.A., Goltz, S.M., Hughes, H., Leclerc, M.Y., Lee, J.T., Richardson, A.D., Rodrigues, C., Scott, N.A., Achuatavarier, D.,Walsh, J., 2004. Spatial and temporal variability in forest-atmosphere CO2 exchange. Global Change Biol. 10, 1689–170
Huang, Y., Yu, Y., Zhang, W., Sun, W., Liu, S., Jiang, J., Wu, J., wang, Y., and Yang, Z., 2008. Agro-C: A biogeophysical model for simulating the carbon budget of agroecosystems. Agricultural and Forest Meteorology
Law, B.E., Falge, E., Gu, L., Baldocchi, D.D., Bakwin, P., Berbigier, P., Davis, K., Dolman, A.J., Falk, M., Fuentes, J.D., Goldstein, A., Granier, A., Grelle, A., Hollinger, D., Janssens, I.A., Jarvis, P., Jensen, N.O., Katul, G., Mahli, Y., Matteucci, G., Meyers, T., Monson, R., unger, W., Oechel, W., Olson, R., Pilegaard, K., Paw, K.T., Thorgeirsson, U.H., Valentini, R., Verma, S., Vesala, T., Wilson, K., Wofsy, S., 2002. environmental controls over carbon dioxide and water vapor exchange of terrestrial vegetation. Agric. For. Meteorol. 113, 97– 120.
Lobell, D. B., Hicke, J. A., Asner, G. P., Field, C. B., Tucker, C. J. and Los, S. O., Satellite estimates of productivity and light use efficiency in United States agriculture, 1982–1998. Global Change Biology, 2002, 8, 722–735.
Monteith, J. L. (1977). Climate and the efficiency of crop
production in Britain. Philosophical Transactions of the Royal
Society of London. Series B, 281, 277–294.
Myneni, R.B. and Williams, D.L., 1994. On the relationship between FAPAR and NDVI. Remote Sens. Environ. 49, 200–221. Nayak, R. K., Patel, N. R. and Dadhwal, V. K., Estimation and analysis of terrestrial net primary productivity over India by remote-sensing-driven terrestrial biosphere model, Journal of
Environment Monitoring and Assessment, 2010
10.1007/s10661-009-1226-9.
P.E., Urbanski, S.P., Hutyra, L., Saleska, S.R., Fitzjarrald, D., Moore, K., 2003. Factors controlling long- and short-term sequestration of atmospheric CO2 in a mid-latitude forest. Science 294, 1688–1691.
Patel, N. R., Dadhwal, V. K. and Saha, S. K., 2011. Measurement and Scaling of Carbon Dioxide (CO2) Exchanges in Wheat Using Flux-Tower and Remote Sensing. J. Indian Soc. Remote Sensing, DOI 10.1007/s12524-011-0107-1
Potter, C. S., Klooster, S. A., Myneni, R. B., Genovese, V., Tan, P. N., & Kumar, V. (2003). Continental scale comparisons of terrestrial carbon sinks estimated from satellite data and
ecosystem modeling 1982– 1998. Global Planetary Change, 39,
201–213.
Potter, C. S., Randerson, J. T., Field, C. B., Matson, P. A., Vitousek, P. M., & Mooney, H. A. (1993). Terrestrial ecosystem production: A process model based on global satellite and surface
data. Global Biogeochemical Cycles, 7, 811–841.
Prince, S. D., & Goward, S. N. (1995). Global primary
production: A remote sensing approach. Journal of Biogeography,
22, 815–835.
Raich, J. W., Rastetter, E. B., Melillo, J. M., Kicklighter, D. W., Steudler, P. A., Peterson, B. J., Grace, A. L., Moore, B., & Vorosmarty, C. J. (1991). Potential net primary productivity in South-America—application of a global-model. Ecological Applications, 1, 399–429.
Running, S.W., Nemani, R.R., Heinsch, F.A., Zhao, M.S., Reeves, M., Hashimoto, H., 2004. A continuous satellite-derived measure of global terrestrial primary production. Bioscience 54, 547–560.
Sims, D.A., Rahman, A.F., Cordova, V.D., Baldocchi, D.D., Flanagan, L.B., Goldstein, A.H., Hollinger, D.Y., Misson, L., Monson, R.K., Schmid, H.P.,Wofsy, S.C., Xu, L.K., 2005. Midday values of gross CO2 flux and light use efficiency during satellite overpasses can be used to directly estimate eight-day mean flux. Agric. For. Meteorol. 131, 1–12.
Wang, H., Jia, G., Feng, J., Zhao, T. And Ma, Z. and Ma, Z., 2010. Modeling Gross Primary Production by integrating Satellite Data and Coordinated Flux Measurements in Arid and Semi-Arid China. Atmospheric and Oceanic Science Letters, 3: 7−13.
Xiao, X., Hollinger, D., Aber, J., Goltz, M., Davidson, E.A., Zhang, Q., Moore, B., 2004. Satellite-based modeling of gross primary production in an evergreen needleleaf forest. Remote Sensing of Environment 89, 519–534.
Xiao, X.M., Zhang, Q.Y., Hollinger, D., Aber, J., Moore, B., 2005. Modeling gross primary production of an evergreen needleleaf forest using MODIS and climate data. Ecol. Appl. 15, 954–969.
Zhao, M. and Running, S. , 2010. Drought-Induced Reduction in Global Terrestrial Net Primary Production from 2000 Through 2009. Science, 329:940-942.
ACKNOWLEDGEMENT