EVALUATION OF AN INTEGRATED GIS-BASED CRIME ANALYSIS &
3D MODELLING FOR IZMIR-KONAK MUNICIPALITY
C. Tarhan a, *, D. Deniz b a
Izmir Institute of Technology, Dept. of City and Regional Planning, 35430 Urla - Izmir, Turkey
[email protected]
b
Izmir University of Economics, Dept. of Industrial Design, Balcova-Izmir, Turkey
[email protected]
Commission IV/8
KEY WORDS: GIS, Environment, Decision Support, Design, Modelling, Analysis
ABSTRACT:
GIS integrated 3D modelling is crucial for the city planning and design processes because urban modelling is a tool used in virtual environments, and provides convenience to work. Although, the creation and display of 3D city models for large regions is difficult it is vital for planning and designing safer cities, as well as public places. Today, crime is a significant problem in Turkey. When it was compared by years of crime rates, population growth and urbanization rate, an increasing more than in parallel has been observed. This paper aims to discuss GIS integrated 3D modelling affects in urban planning and design, explaining Turkish planning processes with GIS and 3D modelling. To do that, it presents a case study for Izmir Konak Municipality about GIS integrated crime analysis and 3D models of the crime scenes. Izmir crime records has been obtained from Izmir Police Department belonging to 2003-2004 and 2005 (D.Deniz, 2007) are used for districts’ crime map. In the light of these data, the highest rate crime district, Konak, is analyzed between 2001 and 2005 data.
* Corresponding author.
1. INTRODUCTION
Especially in the last two decades, developments in computer technology have led to the naming of our age as “the age of the computer”. These developments have a positive impact on information technologies and data collected, stored in many different formats has become. This information is assessed on a system, can be made fast and easy exchange of information, as well as spatial data analysis and assessment systems, Geographical Information Systems (GIS) developed and is being offered under the name. These systems of spatial objects with each other by establishing good relations with a planning solution to the problems facing humanity was used as an effective and continues to be used for.
The basic problems’ solution of the place of GIS technology developing visualization tools that provides one to one with a 3 or even 4-dimensional modelling of the space have increased the usage of GIS. Today, members of different sectors, designers and practitioners working in different disciplines, and better plan their work more efficiently to deliver products to users by the increased use of spatial information (Dogru and Seker, 2009).
Crime mapping GIS is widely used and these maps are supported by 3D environmental models. GIS is used as an analysis tool for creating map of crime data. Operational policing purposes, crime prevention, informing and interacting with the community, monitoring changes in the distribution of crime over time and evaluating the effectiveness of crime prevention initiatives are the benefits of GIS-based crime analysis (Alpdemir and Cabuk, 2005; Atac, 2008). In Turkey, an increasing number of municipalities decide nowadays to
build up or use 3D city models. Often the main purpose of such a model is to support urban planning and design processes.
In urban planning and environmental design, these tools support different levels of the planning and designing process such as visualization from an urban design perspective, estimation of effects of development and their integration in existent settings, aesthetic assessment of an existing neighbourhood. Moreover, rapid and effective storage, retrieval of information, various kinds of visualization, survey and analysis, and different strategies for communicating information are some advantages of using GIS and 3D modelling in urban planning and environmental design (Köninger and Bartel, 1998)
Through the city planning and environmental design process modelling, people of different disciplines come together and work in collaboration. Urban modelling is a tool used in virtual environments, and provides convenience to work. The creation and display of 3D city models for large regions is difficult. Increasing and presentation of data make a fast stop to be on the editing (Yucel and Selcuk, 2009).
be classified as classical, geographical, psychological, biological, economic and sociological. Geographical factors have been advocated as a factor in criminal behavior. These factors include temperature, humidity, barometric pressure, such as climatic factors, topography and natural resources, and includes residential properties and location of the venue (Alpdemir, 2006; Atac, 2008).
By the Council of Europe adopted in 1992 and was declared "European Urban Charter", a 20-item consists of a declaration of principles and 13-item condition. The first article of the declaration is "Urban Security and Crime Prevention". Thus, the concept of security and crime prevention is one of the important issues of today and the future for safer cities (URL3).
According to Geleri (2002), crime prevention consists of a five-step process. These are (1) problem determination, (2) data analysis, (3) physical security measures review and planning, (4) the most appropriate selection and implementation of the plan (5) monitoring and evaluation of results.
GIS is used crime data to visualize a crime through various methods of analysis by creating maps. Thus, it is a great facility safety, and the field of law for crime prevention, and auditing (Atasoy, 2001)
The discipline of urban planning has many interdisciplinary interactions, because of this; it covers an "interdisciplinary" structure with many disciplines. Shortly, the science of city planning is closely related to public administration, economics, geography, architecture, designers, engineering, sociology, social psychology, history, art history, criminology, and geology. The relationship between urbanism, science and criminology; cities brings the concepts of safety practitioner of the law structure and public order operation of security forces, specific crimes, traffic problems in cities (Urhal, 1992).
As a result, the concept of the crime, distribution of crimes and crime factors determine the router, unplanned growth of cities and the solution of problems in large cities, such as crime, the effect that the necessary precautions in handling the important duties fall on to the city planners and environmental designers.
2.1 The benefits of crime maps created by GIS
Today, crime maps created with advanced analysis tools of GIS technology, depending on the field measurement of crimes, to analyze the different areas and at the same time facilitate the creation of links. The benefits of crime maps created by using GIS are briefly outlined as follows (Alpdemir ve Çabuk, 2005): • Be seen at a glance provides a lot of information.
• Crime maps help out strategic analysis about where, when, by whom, against whom or what can be processed as in the following (URL1).
• Crime maps help to quickly analyze geographic locations of regions of the crime.
to identify. (Police station site selection, establishment of protection points, and so on.).
• If distribution of crime data is related with land use in the city by GIS environment, operations can be established and be made more comfortable interaction with environmental factors (Karakas et.al, 2003).
As a result, GIS based crime mapping and services make decisions quickly, provide a better understanding of crime-based relationship and development of preventive policing, more effective, and the right to accelerate measures to be taken.
Additionally, criminal analysis, looking for answers to some questions below (Demirci ve Coban, 2002).
• Where do most crimes occur?
• What types of offenses are pointed out areas?
• What is the relationship between demographic data and cause of crime?
• What is the distribution of knowledge in the relationship between perpetrators and events?
• Are there relationships between the types of offenses and locations (places of entertainment, park, school environment, etc.)?
• Which crimes do occur in which places?
3. AN INTEGRATED GIS-BASED CRIME ANALYSIS & 3D MODELLING FOR IZMIR-KONAK
MUNICIPALITY
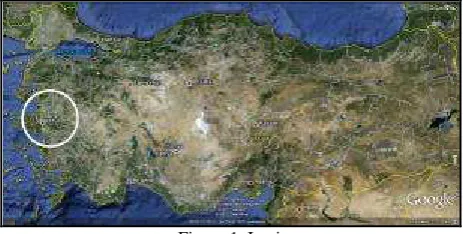
3.1 Description of the Case Area and The Research Data Izmir Province, west of the Anatolian Peninsula, is located in the middle of the Aegean coasts. It is surrounded by Balıkesir from North, Manisa from east and Aydın from south. City lands, 37o45' and 39o15' north latitude and 26o15' and 28o20' east longitude, is torn between, shown in Figure1. Figure 2 shows the districts of Izmir Greater Municipality.
Figure 2. Izmir Greater Municipality Districts Source: Google Earth, 2011
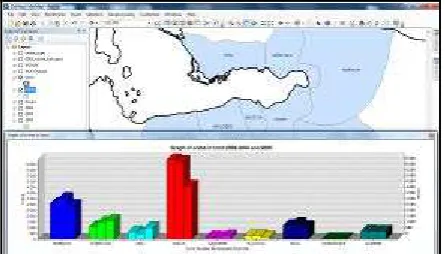
The study’s official crime data has been taken from the ph.d thesis of Deniz (2007) which was obtained from Izmir Police Department in order to analyze the characteristics and rates of crime in all districts of Izmir (Konak, Buca, Balçova, Karşıyaka, Çiğli, Güzelbahçe, Gaziemir, Bornova, Narlıdere). These data include the records of 2003, 2004 and 2005 (records of the year 2005 cover from January to August). (Figure3 and Table 1). Figure 3 is created using ArcGIS software. Table 2 shows the population of the districts in 2003, 2004 and 2005, this information has got from Turkish Statistical Information (TUIK) web site.
Table 1. The Rates of Crime Events in 2003-2004-2005
DISTRICTS OF IZMIR
Table 2. Population in 2003-2004-2005
DISTRICTS OF
Figure 3. Graphics of crime in Izmir 2003-2004 and 2005
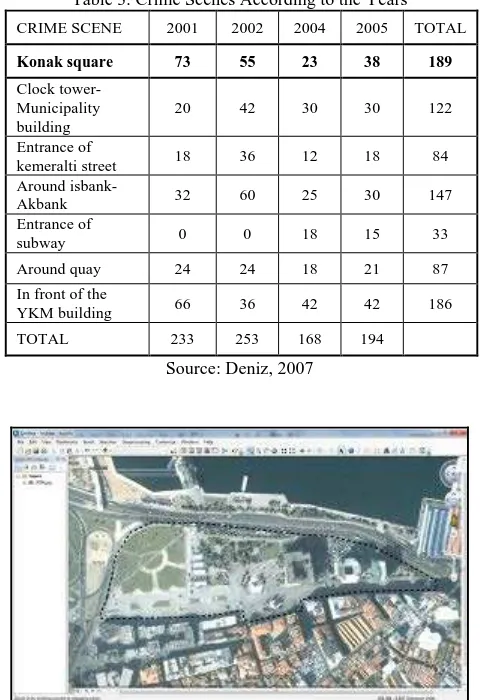
It is clearly observed that “Konak” has the highest crime rate in Izmir. Therefore, its crime scenes according to the years were analyzed. Table 3 shows the crime scenes in Konak.
Based on the official crime records obtained from the Izmir Police Department, Konak Square has been divided into seven sub-areas, shown as Table 3. These are (Deniz, 2007):
- Konak Square (no sub-area specified) (Figure 8) - Clock Tower- Municipality Building (Figure 8) - Entrance of Kemeraltı Street (Figure 9) - Surroundings of İşbank- Akbank (Figure 10) - Entrance of Subway (Figure 11)
- Surroundings of Quay (Figure 12) - In front of the YKM building (Figure 13)
Besides, crime scene data has obtained for the years 2001, 2002, 2004 and 2005. Konak Square has been gone through several physical changes in time. The latest design was in 2003. Therefore, the crime records selected before and after the renovation. The years 2001 and 2002 show data of the old form of Konak Square, shown in Figure 5. The years 2004 and 2005 present data of the new form of Konak Square, shown in Figure 6. Additionally, figure 7 shows today’s Konak Square’s photograph.
Konak Square has the highest crime rate among the scenes. It is one of the most important public spaces of Izmir, an administrative and shopping centre, also adjacent to financial centre. There is a public transportation hub where stations of subway, public buses and ferry are located, because of this, almost every citizens of Izmir pass through Konak Square (Figure 4) (Deniz and Saygin, 2007).
Akbank 32 60 25 30 147 Entrance of
subway 0 0 18 15 33
Around quay 24 24 18 21 87
In front of the
YKM building 66 36 42 42 186
TOTAL 233 253 168 194
Source: Deniz, 2007
Figure 5. Konak Square, the year 2000 (before renovation) Source: Google Earth, 2011
Figure 6. Konak Square, the year 2010 (after renovation) Source: Google Earth, 2011
Figure 7. Konak Square, 2011 Source: URL2
Figure 8. Izmir Greater Municipality Building and Clock Tower Source: CitySurf, 2011
Figure 9. Entrance of Kemeralti Street Source: CitySurf, 2011
Figure 10. Surroundings of banks Source: CitySurf, 2011
Figure 12. Surroundings of Quay Source: CitySurf, 2011
Figure 13. In front of the YKM building Source: CitySurf, 2011
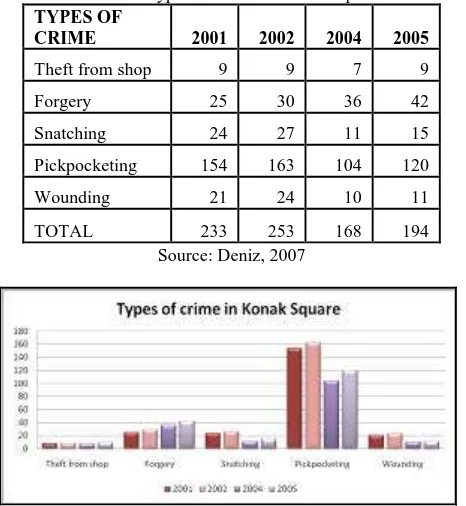
Table 4 presents the types of crime in Konak Square by the years 2001-2002-2004 and 2005. The most observed crime has been “pick pocketing” since 2001. Figure 14 shows the graphic of Table 4.
Table 4. Types of crime in Konak Square TYPES OF
CRIME 2001 2002 2004 2005
Theft from shop 9 9 7 9
Forgery 25 30 36 42
Snatching 24 27 11 15
Pickpocketing 154 163 104 120
Wounding 21 24 10 11
TOTAL 233 253 168 194
Source: Deniz, 2007
Figure 14. Types of Crime in Konak Square
4. CONCLUSION
The advantages of using GIS are capable of changing and updating the information provided. Spatial data management and power and effectiveness of the organizations as well as dynamic analysis capacity produce quick solutions to problems for a good visualization.
Criminal investigations show that there are significant relationships between the types of crime and where the crime was committed (Harries, 1999; Cozens, 2002; Aksoy, 2003). Examining the relations between physical environment and types&rates of crime are crucial because crime incidents show different distribution depending on design and physical features of the location. Particular types of crime usually concentrate on some areas; therefore, the spatial aspects of crime require different mapping systems. Thus, the geography of crime and the factors affecting the spatial relationships make significant contribution to explaining the distribution and reasons of crime (Yilmaz, Günayergün, 2006).
In Izmir Case, it has been observed that the more population creates the more crime case. On the other hand, in Konak Square Case, although the population has increased, the total rate of crime has been decreased after renovation. However, “forgery” and “theft from shop” still continue to increase. As seen in Figure 14, it is not always possible to generalize when it comes to crime. Because the occurrences of crime depends on many aspects including physical, geographical, economical etc. factors. This is why; each types of crime should be considered and analyzed individually.
For further studies, local governments should use these types of analyzes during planning and environmental design processes. Additionally, surveys can help to understand the types and trends of crime as well as the reasons of crime in order to decrease the crime rate and to create safer places.
5. REFERENCES
Aksoy, H,. 2003. Bursa Emniyet Müdürlügü Suç Haritaları Uygulamaları. 1.Polis Bilisim Sempozyumu Bildirileri,
pp.150-162.
Alpdemir A.E., Çabuk A., 2005. Eskişehir Kenti Suç Kaynaklarinin Bilgi Sistemleri Destekli Tespiti ve Planlamaya Esas Teskil Eden Verilerle Iliskilendirilmesi. Harita ve
Kadastro Muhendisleri Odası, Muhendislik Olcmeleri STB
Komisyonu, 2. Muhendislik Olcmeleri Sempozyumu ITU –
Istanbul.
Alpdemir, A.E., 2006. 1999-2004 Yillari Arasinda Eskisehir’de Islenen Asayis Suclarina Iliskin Suc Haritalarinin Cografi Bilgi Sistemleri Yardimiyla Olusturulmasi, Unpublished Master
Thesis. Anadolu Univrsitesi.
Atac, E. 2008. Kent, Guvenlik ve Guvenli Kent Planlamasi: Bursa Ornegi. Unpublished Master Thesis. Gazi Universitesi.
Atasoy, S., 2001. Suc Onleme ve Denetlemede, Cografi Bilgi Sistemlerinin Kullanimi: Suc Haritalama. CBS Bilisim Günleri
Bildiri Kitabi. 13-14 Kasım 2001, Fatih Universitesi Yay.,
İstanbul.
Through Environmental Design (CPTED)’ Principles.
Unpublished PhD. Dissertation, Izmir Institute of Technology,
İzmir, Turkey.
Deniz, D. and Saygin, N., 2007. Desinging for Sustainable Communities: “Design Against Crime in Urban Life by Crime Prevention Through Environmental Design (CPTED)”. Joint
Congress of the European Regional Science Association (47th Congress) and ASRDLF (Association de Science Regionale de Langue Francaise, 44th Congress), Paris-France, August 29 –
September 2 2007. Proceedings CD (869-full text) and Book of Abstract, ERSA ASRDLF 2007, p.322-323.
Dogru, A. O., Seker, D.Z. 2009. Cografi Bilgi Sistemlerinde 3D Kent Modelleme Olanaklarinin Irdelenmesi. TMMOB Cografi
Bilgi Sistemleri Kongresi
Geleri, A., 2002. Fiziksel Guvenlik Tedbirleri Yoluyla Suc Onleme ve Sucun Yer Degistirmesi. Turkiye’de Devlet, Toplum
ve Polis, Seckin Yayinevi, Ankara.
Google Earth, 2011
Harries, K., 2005. Extreme Spatial Variations in Crime Density in Baltimore Country, MD. Geoforum, 37 (3): pp.404-416.
Karakas, E., Arslan, H. and Karadogan, S., 2003. Suc Arastirmalarinda CBS Sistemiyle Olusturulan Haritalarin Onemi. 1. Polis Bilisim Sempozyumu, pp.358-362
Köninger, A. and Bartel, S., 1998. 3D-GIS for Urban Purposes. GeoInformatica 2:1, pp.79-103.
Turkish Statistical Institute, TUIK, 2011 (www.tuik.gov.tr)
Urhal, O., 1992. Sehirlesme Asayis Iliskisi. Selcuk Universitesi Sosyal Bilimler Enstitusu Kamu Yonetimi Ana Bilim Dali,
Unpublished Master Thesis.
URL1.
http://www.lynnpolice.org/crime_map_analysis.htm (accessed 28 May 2011)URL2.
http://www.arkitera.com, 2011 (accessed 28 May 2011)URL3.http://sustainable-cities.eu/upload/pdf_files/URBAN_ CHARTER_EN.pdf, pp.28-30 (accessed 28 May 2011)
Yilmaz, A., and Gunayergun, S., 2006. Turkiye’de Sehir Asayis Suclari: Dagilis ve Baslica Ozellikleri. Milli Egitim Uc Aylik
Egitim ve Sosyal Bilimler Dergisi, 170 (35): 230-250
Yücel, M.A., Selçuk, M., 2009. Uc Boyutlu Kent Modellerinde Ayrinti Duzeyi (LoD) Kavrami. Jeodezi, Jeoinformasyon ve