NIGHT-TIME LIGHTS AND LEVELS OF DEVELOPMENT: A STUDY USING
DMSP-OLS NIGHT TIME IMAGES AT THE SUB-NATIONAL LEVEL
Koel Roychowdhury, Simon Jones
*, Karin Reinke, Colin Arrowsmith
School of Mathematical and Geospatial Sciences
RMIT University
Melbourne, Australia
[email protected]
Commission VIII, WG VIII/2
KEY WORDS: DMSP-OLS, night-time lights, census, scale effects, socio-economic metrics, development
ABSTRACT:
This paper investigates the association between night-time lights and socio-economic metrics at the regional level. This regional level of understanding is critical as it underpins much economic monitoring and policy-making for sustainable development. Stable light data obtained from night time images of 2001, captured by Defense Meteorological Satellite Program – Operational Linescan System (DMSP-OLS) satellite, are used in the study. The data records artificial lights from human habitations from the earth surface and is a surrogate of the level of development of an area. Data on socio economic metrics at the sub-national level for the year 2001 for the state of Maharashtra in India have been sourced from Primary Census Abstract of India, 2001. However, most of the socio economic variables are not available at the village level. This paper describes the process of deriving maps of census metrics not collected by Indian census for small regions (such as villages) using DMSP-OLS images that are otherwise unavailable. Linear regression models with correlation coefficients ranging from 0.75 to 0.90 (p < 0.05) at the district and the taluk level from the night-time satellite images were used to predict these census metrics for villages. Maps are produced for villages. Errors associated with the Modifiable Areal Unit Problem (MAUP) and ecological fallacies are also discussed. The paper concludes with an overall assessment of the results at these various spatial scales.
* Corresponding author. This is useful to know for communication with the appropriate person in cases with more than one author. 1. INTRODUCTION
Night-time satellite images of the earth are recorded by the Operational Linescan System onboard the Defense Meteorological Satellite Programme (DMSP-OLS) group of satellites. This is a passive sun synchronous satellite capable of capturing artificial lights at nights from the earth surface in the visible and near-infrared regions of the electromagnetic spectrum. Initially the satellite was launched with the purpose of recording cloud covers and cloud – top temperatures over the earth surface by the US Department of Defense (DoD). However, in late 1970s it was discovered that the data obtained from the OLS sensor can record lights from cities at night (Croft 1978; Welch & Zupko 1980). The digital archives of the datasets are available since 1992. From that time, this dataset had been used for a wide range of applications. The data was used to estimate the population of the countries of the world (Elvidge, CD et al. 1997) and estimating population without access to electricity (Doll, C. N. H. & Pachauri 2010). The first global map of the GDP purchasing Power Parity (GDP-PPP) (Doll, C. N. H., Muller & Elvidge 2000) and economies (Ghosh et al. 2009) were mapped using DMSP-OLS night-time images. Gas flares on the earth surface (Elvidge, C et al. 2009) were also mapped using this data product. Radiance calibrated DMSP-OLS data were used to map urban and suburban extent around cities (Roychowdhury, K, Jones, SD & Arrowsmith, C 2009; Roychowdhury, Taubenboeck & Jones 2011) and for modelling socio-economic parameters as well as urban population data (Doll, C. N. H. 2008; Doll, C. N. H, Muller &
Morley 2006; Doll, C. N. H., Muller & Elvidge 2000; Sutton 2003). However, most of these works were carried out at the global and national level. In the past few years, the utility of the night-time datasets were assessed at the sub-national level. At the smaller spatial scale, radiance calibrated DMSP-OLS dataset was used to estimate population and other socio economic metrics for the state of Maharashtra in India (Roychowdhury, K, Jones, S & Arrowsmith, C 2009). High and low gain radiance calibrated data was used separately for predicting census metrics at different spatial scales (Roychowdhury et al. 2011a). The association between night lights and GDP estimates for India at the district level was carried out using DMSP-OLS night-time images from 2008 (Bhandari & Roychowdhury 2012).
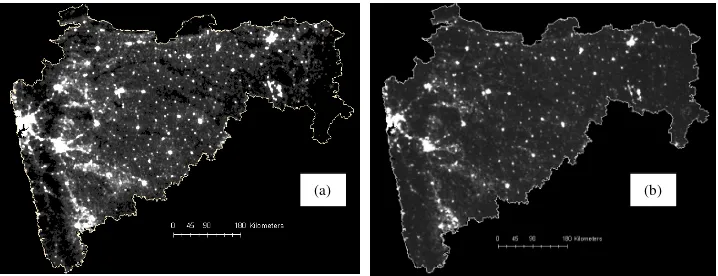
This paper builds on the previous works of the authors. Satellite images captured by DMSP-OLS were used by the authors to propose a surrogate census method for small administrative regions (that is, districts and taluks) (Roychowdhury et al. 2011b; Roychowdhury et al. 2010). The satellite images are used in association with the data from last completed Indian census (also conducted in 2001). The study focuses on the state of Maharashtra in western India (fig 1). This paper examines the application of the models proposed to predict and map the metrics for the villages that are unavailable from traditional census statistics. These metrics include: number of female literates per square kilometre;
Figure 1: The state of
Maharashtra as obtained from two DMSP-OLS images of 2001. (a) Maharashtra shown using the stable lights dataset. (b) Maharashtra shown using the radiance calibrated dataset (showing brightness values)
percentage of households with cars, jeeps and vans; percentage of households with television; percentage of permanent census houses and percentage of households using electricity as power source. Maps are produced for the villages in the districts of Pune in the state of Maharashtra. The use of multi-scale data led to the consideration of issues arising from MAUP and ecological fallacy which are also described in this paper.
2. METHOD
The study uses two types of DMSP-OLS data products: the stable light data set and the brightness data. The stable light data was part of the latest average DN data series and was obtained from the National Geophysical Data Centre (NGDC) website (National Geophysical Data Centre 2006). In this image, the data values range from 1-63. Background noise in the data is represented using zero while areas with no cloud-free observations are denoted by the value of 255. The second DMSP-OLS image used in the study is the global composite of brightness data for 2000 – 2001. It was prepared from fixed gain images taken from satellites F12 to F15 by NGDC. However, this data contained brightness values ranging from 0 to 653 and was not calibrated to radiance (Tuttle 2008).
The mean and standard deviation of stable lights and brightness were calculated for 32 districts and all the taluks in the state of Maharashtra. There are 35 districts in the state of Maharashtra. Of these, the districts of Mumbai, Greater Mumbai and Thane were not included for sample selection as they had very high values of both mean and standard deviation of brightness and stable lights compared to others. From the remaining 32 districts, 24 were randomly selected and 8 districts were withheld for model validation. Although the census accounts for 354 taluks, data was available for only 286 taluks. As a result the analyses were conducted on the available taluks. 196 taluks were randomly sampled for model development and the remaining 90 taluks were withheld for model validation.
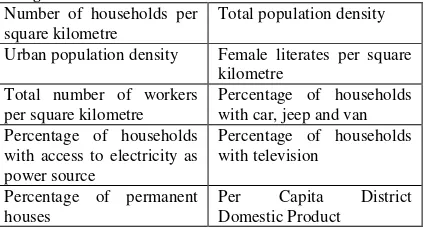
Five demographic metrics and four socio-economic metrics were chosen from the census. Ten metrics were shortlisted after a number of statistical tests and are listed in table 1.
From the ten census metrics selected for this study, only three variables were available from the Indian census at the scale of a village. They are number of households per square kilometre, total population per square kilometre and total workers per square kilometre. The models proposed at the district and taluks were used to predict and map the metrics for the villages that are unavailable from traditional census statistics. These metrics include: number of female literates per square kilometre; percentage of households with cars, jeeps and vans; percentage of households with television; percentage of permanent census houses and percentage of households using electricity as power source. Maps were produced for the villages in the districts of Pune in the state of Maharashtra. The district of Pune has the million plus city of Pune as its district headquarter along with some very rural areas appearing dark in the satellite image.
3. RESULTS AND DISCUSSION
3.1 Models proposed at district and taluks
Linear regression models and multiple regression models were proposed. The selected census metrics were chosen as the dependent variables and mean and standard deviation of brightness and stable lights obtained from the images were used as the independent variables. The models were validated using the withheld districts and taluks. The models which best predicted the census metrics ( 25% error margin) for the highest number of districts and taluks were identified as the most appropriate models (Roychowdhury et al. 2011b; Roychowdhury et al. 2010).
The selected census metrics showed positive correlations with both the mean and standard deviation of brightness and stable lights. The adjusted r2 of these models ranged from 0.8 to 0.97 at 95% confidence interval at the district level. The correlation coefficients (r2) achieved at 95% confidence interval for all the census metrics ranged from 0.2 to 0.8 for the taluks. The adjusted r2 values of the models are presented in details in previous works by the authors (Roychowdhury et al. 2011b; Roychowdhury et al. 2010).
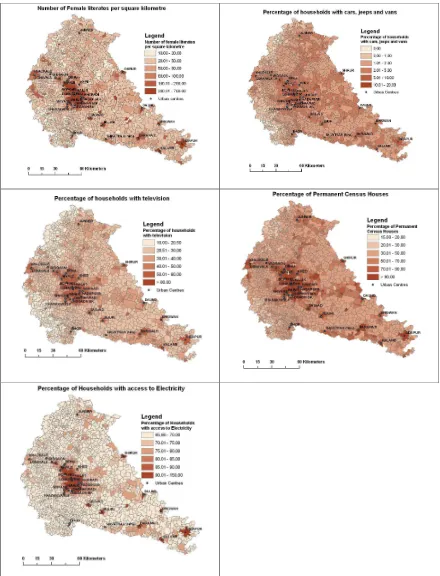
(a) (b)
Figure 2: Maps of predicted census metrics for the villages of the district of Pune
3.2 Issues surrounding multi-scale analyses
The effect of scale on statistical results was first demonstrated by Gehlke and Biehl (1934, as cited in Dark & Bram 2007; Dungan et al. 2002; Openshaw 1984) and Yule and Kendall (1950 cited in Marceau, D. J. 1999; Marceau, D.J. & Hay 1999). McCarthy (1956 cited in Marceau, D. J. 1999) showed that the statistical results valid at one spatial scale may not be applicable at another scale. The problems of scale differences can be described as the determination of appropriate spatial scale to study a particular geographical phenomenon, and the transferability of information between two spatial scales (Marceau, D. J. 1999). The significant effect of spatial aggregation of data was acknowledged by the pioneer works of Blalock (1964) Clark and Avery (1976) and Fotheringham (1991). The most common errors arising from the use of multi-scale data are MAUP (Doll, C. N. H., Morley & Muller 2004; Marceau, D. J. 1999; Openshaw 1984) and ecological fallacy (Cao & Lam 1997; Doll, C. N. H., Morley & Muller 2004; Robinson 1950).
The MAUP can affect the results in spatial studies using aggregate data sources (Unwin 1996). The MAUP consists of two components: the scale effect and the aggregation effect (Doll, C. N. H., Morley & Muller 2004; Marceau, D. J. 1999; Marceau, D.J. & Hay 1999). The scale effect is observed when data from small regions are aggregated into larger spatial units (Doll, C. N. H., Morley & Muller 2004; Wrigley et al. 1996). Aggregation effect takes place due to the combining of zone boundaries in a given scale of analysis (Doll, C. N. H., Morley & Muller 2004).
The effects of scale and aggregation are usually manifested in several ways in studies in spatial analyses depending on the generalization of the datasets. The scale effect is demonstrated through individualistic fallacy and ecological fallacy, while the zoning or aggregation effect gives rise to cross - level fallacy. Individualistic fallacy occurs when the inferences from small or micro - levels are used to infer results for macro regions. Ecological fallacy can be regarded as the opposite of individualistic fallacy and is observed when inferences about micro - regions are derived from relationships at macro - regions (Cao & Lam 1997; Doll, C. N. H., Morley & Muller 2004). Cross - level fallacies are found in inferences derived for one sub - population from another at the same spatial scale of analysis (Doll, C. N. H., Morley & Muller 2004).
There are many different approaches proposed in the literature for managing issues of MAUP (Fotheringham 1989; Marceau, D. J. 1999; Marceau, D.J. & Hay 1999; Openshaw 1984). For example, Openshaw (1984) proposed the approach of optimal zoning system for spatial analyses. An optimum scale was defined as “… the spatial sampling unit corresponding to the scale and aggregation level characteristic of the geographical entity of interest” (Marceau, D.J. & Hay 1999, p. 6). An important consideration of optimal scale approach was the absence of unique optimal resolution. Another approach to manage MAUP was the identification of basic entities. This approach necessitated the study of an object of concern at a spatial scale where it could be observed and measured (Fotheringham 1989; Visvalingam 1991). The object was aggregated in the entity based approach and therefore this was one of the most effective ways to overcome MAUP (Fotheringham 1989). Commonly used ones include
abandonment of traditional statistical analyses and sensitivity analyses.
The use of traditional statistics is limited in its application to spatial data. Recent studies in remote sensing indicated the aggregation unit to propose the metrics for the villages. The optimal models for the taluks (Roychowdhury et al. 2011b) were used to predict the metrics for the villages. The results from the predicted metrics were mapped for the districts of Pune.
Table 1: Shortlisted census metrics to propose models for surrogate census at the district and taluks
Number of households per square kilometre
Total population density
Urban population density Female literates per square kilometre
Number of female literates per square kilometre; percentage of households with cars, jeeps and vans; percentage of households with television; percentage of permanent census houses and percentage of households using electricity as power source were predicted and mapped at the village level. The maps with the predicted metrics for the districts of Pune are shown from figure 2.
4. DISCUSSION
In Pune, high values of number of female literates were predicted for villages around the urban areas such as Vadgaon Bk, Hadapsar, Khed, Kharadi, Kivale and Dehu in the central part of the district and Jumner, Shirur, Baramati, Kalamb and Bhor in other parts of the district. These areas were predicted to have more than 200 female literates per square kilometre. Most of the villages in the district have approximately 20 to 80 female literates per square kilometre. On an average two to five percent of the households in the villages were predicted to have cars, jeeps and vans. Around the urban centres there were five to ten percent of the households predicted as having cars, jeeps and vans. Similar trends were predicted for percentage of permanent census houses. Urban areas were recorded to contain 70% to more than 90 % of permanent houses. The villages in the district as a whole showed to have 30 to 50 % of permanent houses. More than 85% of the households demonstrated to have International Archives of the Photogrammetry, Remote Sensing and Spatial Information Sciences, Volume XXXIX-B8, 2012
access to electricity near the urban areas while the district as a whole exhibited 65% to 70% of rural electrification.
Due to the absence of these metrics at the village level from the census, it was not possible to validate the results obtained from the predictions. The results presented in this chapter are the best estimates of the metrics previously unavailable.
4.1 Comparison of maps from all spatial scales
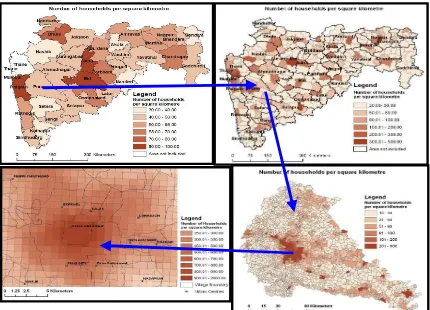
Census metrics were proposed and predicted over different spatial scales in this study. Maps of number of households per square kilometre in all the spatial scales are shown in figure 3. From the map at the district level (figure 3 (a)) it was observed that in Pune, as a whole, there were 40 to 50 households per square kilometre. A look at smaller administrative areas such as taluks and villages, revealed detailed distribution of the households. The map of number of households per square kilometre at the taluk level is shown in figure 3 (b). It was observed that taluks in the north western, eastern and southern part of Pune district exhibited the lowest density values of around 20 to 50 households per square kilometre. These taluks comprised of an area of around 7000 square kilometre in the district. Five taluks demonstrated to have moderate density of 80 to 200 households per square kilometre. These taluks occupied an area of approximately 6000 square kilometre in Pune. Only 1400 square kilometre of the district had high values of 300 to 500 households per square kilometre. These taluks were located near the centre of the district around the urban areas of Pune. Since most of the taluks exhibited to have low to moderate household density, the aggregated district map showed a low value for the district as a whole.
Figure 3: The effect of scale in the prediction of census metrics at (a) Districts; (b) Taluks; (c) Villages and (d) one square kilometre areas.
The taluks were further divided into villages. The map of the number of households per square kilometre in the villages is shown in figure 7.5 (c). It was observed that the villages in the central part of the district around cities exhibited highest household densities of more than 100 households per square kilometre. Moderate distribution (50 to 100 households per square kilometre) was noted in the north eastern and southern part while the major part of the area had around 15 to 30 households per square kilometre. Therefore it was apparent from these maps that values of metrics aggregated over small areas influenced the data of large regions. The analyses of the
results in all the spatial scales helped overcome the individualistic and ecological fallacies.
5. CONCLUSION
This paper looked into the application of the models for proposing census metrics otherwise not collected by the census at the village level for the district of Pune in Maharashtra. The errors arising from analyses of multi – scale data such as MAUP and ecological fallacy were examined and the approach of optimal zoning system was used to overcome the MAUP effects in predicting the metrics for the villages of Pune. However, due to the absence of these data from the census, it was not possible to validate the results. This chapter showed the potential for models derived from DMSP-OLS images for mapping and predicting census metrics for small regional scales. As a result, it is possible to map the metrics showing levels of development using night time satellite images collected by DMSP-OLS.
6. REFERNCES
Bhandari, L & Roychowdhury, K 2012, 'Night Lights and Economic Activity in India: A study using DMSP-OLS night time images', paper presented to Asia Pacific Advanced Network (APAN), 2011, Delhi.
Blalock, HM 1964, Causal inferences in nonexperimental research, University of North Carolina Press.
Cao, C & Lam, NSN 1997, 'Understanding the scale and resolution effects in remote sensing and GIS', in Scale in Remote Sensing and GIS, Boca Raton, FL: CRC Lewis, pp. 57-72.
Clark, WAV & Avery, KL 1976, 'The effects of data aggregation in statistical analysis', Geographical Analysis, vol. 8, no. 4, pp. 428-38.
Croft, TA 1978, 'Nighttime images of the earth from space', Scientific American, vol. 239, pp. 86-96.
Dark, SJ & Bram, D 2007, 'The modifiable areal unit problem (MAUP) in physical geography', Progress in Physical Geography, vol. 31, no. 5, pp. 471-9.
Doll, CNH 2008, A CIESIN Thematic Guide to Night-time Light Remote Sensing and its Applications, Center for International Earth Science Information Network of Columbia University, Palisades, NY,
<http://sedac.ciesin.columbia.edu/tg/guide_main.jsp>.
Doll, CNH, Morley, JG & Muller, JP 2004, 'Geographic Information Issues associated with Socio-Economic Modelling from Night-time light Remote Sensing Data', paper presented to ISPRS Conference, Istanbul,
<http://www.isprs.org/istanbul2004/comm7/papers/155.pdf>.
Doll, CNH, Muller, J & Morley, J 2006, 'Mapping regional economic activity from night-time light satellite imagery', Ecol Econ, vol. 57, pp. 75 - 92.
Doll, CNH, Muller, JP & Elvidge, CD 2000, 'Night-time Imagery as a Tool for Global Mapping of Socioeconomic Parameters and Greenhouse Gas Emissions', AMBIO: A International Archives of the Photogrammetry, Remote Sensing and Spatial Information Sciences, Volume XXXIX-B8, 2012
Journal of the Human Environment, vol. 29, no. 3, pp. 157-62.
Doll, CNH & Pachauri, S 2010, 'Estimating rural populations without access to electricity in developing countries through night-time light satellite imagery', Energy Policy.
Dungan, JL, Perry, JN, Dale, MRT, Legendre, P, Citron-Pousty, S, Fortin, M-J, Jakomulska, A, Miriti, M & Rosenberg, MS 2002, 'A balanced view of scale in spatial statistical analysis', Ecography, vol. 25, no. 5, pp. 626-40.
Elvidge, C, Ziskin, D, Baugh, K, Tuttle, B, Ghosh, T, Pack, D, Erwin, E & Zhizhin, M 2009, 'A Fifteen Year Record of Global Natural Gas Flaring Derived from Satellite Data', Energies, vol. 2, no. 3, pp. 595-622.
Elvidge, CD, Baugh, KE, Hobson, VR, Kihn, EA, Kroehl, HW, Davis, ER & Cocero, D 1997, 'Satellite inventory of human settlements using nocturnal radiation emissions: a contribution for the global toolchest', Global Change Biology, vol. 3, no. 5, pp. 387-95.
Fotheringham, AS 1989, Scale - independent spatial analysis.
Fotheringham, AS & Wong, DWS 1991, 'The modifiable areal unit problem in multivariate statistical analysis', Environment and Planning A, vol. 23, no. 7, pp. 1025-44.
Ghosh, T, Sutton, P, Powell, R, Anderson, S & Elvidge, CD 2009, 'Estimation of Mexico's informal economy using DMSP nighttime lights data', paper presented to Urban Remote Sensing Event, 2009 Joint.
Marceau, DJ 1999, 'The scale issue in social and natural sciences', Canadian journal of remote sensing, vol. 25, no. 4, pp. 347-56.
Marceau, DJ & Hay, GJ 1999, 'Remote Sensing Contributions to the Scale Issue', Canadian Journal of Remote Sensing, vol. 25, no. 4, pp. 357-66.
National Geophysical Data Centre 2006, DMSP data Download, viewed 25th May 2008,
<http://www.ngdc.noaa.gov/dmsp/download_rad_cal_96-97.html>.
Openshaw, S 1984, 'The modifiable areal unit problem', Concepts and Techniques in Modern Geography, vol. 38, no. 38, p. 41.
Robinson, WS 1950, 'Ecological Correlations and the Behavior of Individuals', American Sociological Review, vol. 15, no. 3, pp. 351-7.
Roychowdhury, K, Jones, S & Arrowsmith, C 2009, 'Assessing the utility of DMSP/OLS night-time images for characterizing indian urbanization', paper presented to Urban Remote Sensing Event, 2009 Joint.
Roychowdhury, K, Jones, SD & Arrowsmith, C 2009, 'Mapping Urban Areas of India from DMSP/OLS Night-time Images', paper presented to Surveying & Spatial Sciences Institute Biennial International Conference, Adelaide, Australia, 2009.
Roychowdhury, K, Jones, SD, Arrowsmith, C & Reinke, K 2011a, 'A Comparison of High and Low Gain DMSP/OLS
Satellite Images for the Study of Socio-Economic Metrics', Selected Topics in Applied Earth Observations and Remote Sensing, IEEE Journal of, vol. 4, no. 1, pp. 35 - 42.
---- 2011b, 'Indian census using satellite images: Can DMSP-OLS data be used for small administrative regions?', paper presented to Urban Remote Sensing Event (JURSE), Munich, Germany.
Roychowdhury, K, Jones, SD, Arrowsmith, C, Reinke, K & Bedford, A 2010, 'The role of satellite data in census: Case study of an Indian State', paper presented to Asia Pacific Advanced Network (APAN), Hanoi.
Roychowdhury, K, Taubenboeck, H & Jones, SD 2011, 'Delineating urban, suburban and rural areas using Landsat and DMSP-OLS night-time images', paper presented to Urban Remote Sensing Event (JURSE), Munich, Germany.
Sutton, PC 2003, 'A scale-adjusted measure of ''Urban sprawl'' using nighttime satellite imagery', Remote Sensing of Environment, vol. 86, no. 3, pp. 353-69.
Tuttle, BT 2008, Personal communication to K Roychowdhury, May.
Unwin, DJ 1996, 'GIS, spatial analysis and spatial statistics', Progress in Human Geography, vol. 20, no. 4, p. 540.
Visvalingam, M 1991, Areal units and the linking of data: some conceptual issues, Belhaven Press.
Welch, R & Zupko, S 1980, 'Urbanized area energy utilization patterns from DMSP data', Photogrammetric Engineering and Remote Sensing, vol. 46, pp. 201-7.
Wrigley, N, Holt, T, Steel, D & Tranmer, M 1996, 'Analysing, modelling, and resolving the ecological fallacy', in Spatial Analysis, Modelling in a GIS Environment, GeoInformation International, pp. 23-40.
Revised July 2011