REGION BASED FOREST CHANGE DETECTION FROM CARTOSAT-1 STEREO
IMAGERY
J. Tian*, J. Leitloff, T. Krauß, P. Reinartz
German Aerospace Center (DLR), Remote Sensing Technology Institute, 82234 Wessling, Germany
(Jiaojiao.Tian, Jens. Leitloff, Thomas.Krauss, Peter.Reinartz)@dlr.de
Commission WG I/4, III/4
KEY WORDS: Change detection, Forest, DSM, GLCM
ABSTRACT:
Tree height is a fundamental parameter for describing the forest situation and changes. The latest development of automatic Digital Surface Model (DSM) generation techniques allows new approaches of forest change detection from satellite stereo imagery. This paper shows how DSMs can support the change detection in forest area. A novel region based forest change detection method is proposed using single-channel CARTOSAT-1 stereo imagery. In the first step, DSMs from two dates are generated based on automatic matching technology. After co-registration and normalising by using LiDAR data, the mean-shift segmentation is applied to the original pan images, and the images of both dates are classified to forest and non-forest areas by analysing their histograms and height differences. In the second step, a rough forest change detection map is generated based on the comparison of the two forest map. Then the GLCM texture from the nDSM and the Cartosat-1 images of the resulting regions are analyzed and compared, the real changes are extracted by SVM based classification.
* Corresponding author
1. INTRODUCTION
Forest management and observation is an important and time-consuming task. Besides in-situ inspection, in the last years, numerous change detection methods using remote sensing with different kinds of images have been used for forest monitoring (Bruzzone, 1997; Johnson, 1998; Lu, 2004; Mas, 1999). These studies are mainly focused on using IKONOS; SPOT HRV, TM/ETM+ or airborne images. Here multi-spectral based colour analysis is one of the most important methods to get the final monitoring results in forest areas. However these methods are not practicable for Cartosat-1 imagery, which was launched by the Indian Space Research Organisation in 2005, with 2.5 meter spatial resolution stereo images but relatively low spectral information, only one panchromatic channel is available. Until now the researches for Cartosat-1 image based automatic and semi-automatic change detection are rare (Prabaharan, 2010; Kamini, 2006). But, according to literature on Digital Surface Model (DSM) generation (Akca, 2007; d'Angelo, 2008) Cartosat-1 imagery is well suited for DSM generation. This offers further possibilities for Cartosat-1 image analysis and applications.
There are some major drawbacks for change detection in forest areas by using one channel Cartosat-1 imagery. First, with 2.5 meter resolution Cartosat-1 imagery single trees can not be separated and thus tree detection based on shape features (Mora, 2010; Tian, 2011) can not be adopted for this application. Second, many land cover classes around the forest have similar gray values, such as rivers, shadows and also man-made constructions. Thus pixel based measurement is not able to reflect possible changes. Third, the variability of the land cover height from the DSMs might become an important feature to measure forest changes, while the DSM generated from optical stereo imagery has relatively low quality compared to LiDAR data. Therefore, we propose a region based change
detection method for forest change monitoring which combines the use of Cartosat-1 images and the DSM generated from the stereo pairs.
This paper is aiming to improve the performance of DSM based change detection result by combining it with features from original Cartosat-1 imagery. In the first step, the initial regions are generated using mean shift segmentation of gray values from the co-registered CARTOSAT-1 imagery of 2008 and 2009. In the second step, the forest areas are extracted by analysing the forest cover rate and the mean height value of each region. The initial difference map is generated based on these results. The deforestation areas can be extracted by analysing the texture features and height differences in the difference map. The performance is evaluated by comparing the results with manual/visual inspection.
2. DATASET
The study side is located in the northeast forest area of Freising, Germany. More than 60 % of the selected images are covered with forest (shown in Figure 1). The images have one year time difference, one is from May 2008 and the other is from May 2009. According to the research of Cappin (1996), monitoring of reforestation by remote sensing needs at least 4 years interval. Therefore, with one year’s interval, only deforestation can be analysed in this research.
2.1 Cartosat-1
The imagery contains two pairs of Cartosat-1 stereo images. A detailed description of the acquisition parameters is given in Table 1. Both datasets are along-track stereo pairs with 2.5 meter Ground Sampling Distance (GSD). A further orthorectification is done after generating the DSM for the subsequent feature extraction.
2008 2009
Left Stereo Right Stereo Left Stereo Right Stereo
Data, Time(GMT) 12/05/2008, 10:10:53 12/05/2008, 10:10:00 25/05/2009, 10:12:24 25/05/2009, 10:11:31
Resolution (m) 2.5 2.5 2.5 2.5
Sun azimuth(deg) 153.13045878 152.76005958 151.74652011 151.35811384
Sun elevation(deg) 57.57125271 57.50455875 60.21366584 60.14411236
Table 1. Acquisition parameters of the original Cartosat-1 stereo imagery
(a)
(b)
Figure 1. Cartosat-1 images of the test area. (a) Pan-2008 (b) Pan 2009
2.2 DSM/DTM/nDSM
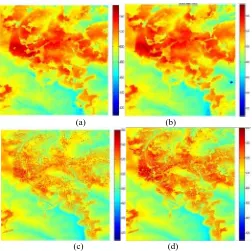
Two DSMs with 5 m grid resolution (show in Figure 2) are generated using semi-global stereo matching (SGM) algorithm (Hirschmüller, 2008; d’Angelo, 2010) based on the pan Cartosat-1 imagery. The first DSM (referred in the following as DSM-08) is computed from the Cartosat-1 stereo imagery obtained in 2008. The original generated DSM may contain holes in occluded areas and regions where the matching failed or outliers were removed, which are filled in this paper with SRTM data adapted to the DSM by using the delta surface fill method by Grohman et al (2006). The same method is also applied for the Cartosat-1 imagery acquired in 2009 and the DSM generated is referred to in the following as DSM-09. To generate the normalized DSM (nDSM) which consists of the difference between DSM and DTM, last pulse LiDAR data of the same area is used as the Digital Terrain Model (DTM).
(a) (b)
(c) (d)
Figure 2. DSMs of the test data (a) DSM-2008, (b) DSM-2009, (c) DTM (LiDAR-2006 last pulse, (d) DSM (LiDAR-2006 first pulse)
To get more information about of the DSM quality, a DSM accuracy analysis is done by comparing them with LiDAR data which have been obtained in 2006 (shown in Figure 2d). A relatively flat area is chosen to evaluate the quality of the stereo matching based DSM. Figure 3a displays the evaluation testing environment and the overall height distribution from the LiDAR-DSM (Figure 3b) and our DSM (Figure 3c).
(a)
Figure 3. DSM quality analyses ((a) The flat area chosen for analysis; (b) the height distribution from LiDAR data; (c) the height
distribution from DSM generated for year-2008
Four groups of pixels are chose and compared in this test. As shown in Figure 4, the blue circles in the blue line stands for the height value from the stereo-DSM, while the red crosses in the red line are
(b)LiDAR-DSM
(c)Stereo-DSM
corresponding to heights extracted from the LiDAR-DSM. It can be seen that about 2~3 meters noise exists in the DSM generated with the stereo imagery.
Figure 4. Profile analysis of four sections. (blue: LiDAR, red: stereo-DSM).
3. METHODOLOGY
The region based forest change detection method is relied on the following assumptions (Desclee, 2006):
i) Unchanged objects have similar texture features; ii) Unchanged objects have relatively low height
changes;
iii) Changes will influence the texture features and height;
iv) Changed regions have lower similarity.
Based on these assumptions, this paper, two first order texture features and six Grey Level Co-occurrence Matrix (GLCM) based second order texture features are calculated based on both panchromatic data as well as nDSM. These features will be used in the SVM classification.
The workflow of the whole procedure is shown in Figure 5
Stereo Imagery
Co-DSM1 Co-DSM2 Co- Image(time2)
Co-Image (time1)
Figure 5. Forest change detection procedure proposed in this paper.
3.1 3D co-registration
Most of the change detection methods are designed based on a high accuracy of co-registration, which is not always easy to achieve in real applications. This problem is even more difficult for 3D co-registration. Because of the small region only the linear shifting is considered in this research, the shift distances in three dimensions (Xs, Ys, Zs) are estimated via iterative least squares adjustment based on the minimization of:
)
In which (x, y) are the plane coordinates, while z is the height. The resulting plane shift values Xs and Ys are also applied to the orthorectified Cartosat-1 imagery. To guarantee that all of the pixels of the Cartosat-1 imagery and nDSM at 2 times to be associated with the same geographical area, the same shift values of (Xs, Ys) will also be applied to the orthorectified Cartosat-1 imagery.
The 3D shift will decrease 2D co-registration accuracy to some extend. However it is very difficult to balance. Therefore, we analyse the changes based on segmented regions in the following, which can decrease that influence.
3.2 Multi-data segmentation comparison
In this research, the objective of segmentation is to get the smallest units that have difference spectral characters from the areas nearby. Mean shift (Comaniciu, 2002) method is adopted in this paper to get the initial regions.
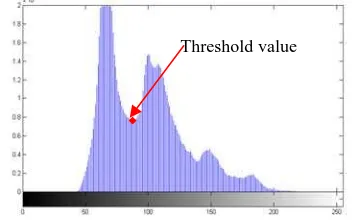
In order to get the initial difference map, we calculate the vegetation cover rate and mean height of each region. Because of the lack of multispectral information of Cartosat-1 imagery, the vegetation cover map can not be generated with the common use of the multispectral based vegetation extraction method. By analysing the land cover characters around forest area, it can be seen that forest areas have relatively darker gray value than the grass areas. Figure 5 shows the histogram of the image (Figure 1a). The gray value distribution of the forest area and other land covers can be clearly separated by the first minimum in the histogram (marked with red dot in Figure 6). Therefore, the balanced histogram thresholding (Anjos, 2008) has been adopted in this paper to get the initial forest cover of both date, which can be used to calculate the vegetation cover rate of each region.
Figure 6. The pixel gray value histogram of forest area
As displaying in Figure 7, the black mask stands for the vegetation cover, while the connected red crosses are the segment unites. The vegetation cover rate of the Unit-A and Unit-B are 3/7 and 3/8 respectively. The comparison of the segments is processed based on this vegetation cover rate and the height information from nDSM.
Threshold value
Figure 7. Region based vegetation cover analyse (Unit-A: 3/7, Unit-B: 3/8)
3.3 Texture based deforestation area extraction
To overcome the lack of spectral information, texture features have be promoted and adopted by many studies. One of the most efficient textures for the forest change detection is (GLCM), which was first promoted by Haralick (1973) and has been tested by many researches until now. In order to choose a better texture feature combination, in this paper, we choose six second order texture features including correlation, contrast, dissimilarity, homogeneity, entropy and energy, and 2 first order textures, which are mean and standard deviation.
1) Correlation:
3) Dissimilarity:
4) Homogeneity:
stands for the probabilities of all pair grey value changes in the interpixel distance (
) and orientation (
), in this paper only
=1, and
=0 with shifting window sizes are considered for the GLCM matrix generation.i columns of GLCM.
To analyse the classification potential of these features, we manually extract 52 changed pixels and 52 unchanged pixels from the testing area. For these pixels the 8 texture features
from both the Cartosat-1 images and the nDSMs are calculated with window sizes 3
3, 5
5, 7
7, 11
11, 21
21. The features having similar values in the unchanged area but big differences in changed area are good features.With the selected features, the land cover changes are classified to distinguish the real deforestation area and no change areas using the Support Vector Machine (SVM) classification method with the RBF kernel (Comaniciu, 2002).Two classes are extracted for the training data, one is the real change areas, and the other is the false alarms.
4. EXPRIMENTS AND RESULTS
4.1 Experiments
Since the land cover information is not the same, we adjust the segmentation parameters respectively to fulfil the minimal size of changed objects that can be separated. After normalization of the Cartosat-1 imagery, all of the pixels with gray values less than 58 are classified as forest, and are used to calculate the forest cover rate of each region. The forest areas are classified out by extract all of the regions with the vegetation cover rate more than 90%. According with the workflow in 3.1, the difference image is generated by extracting all of the regions with vegetation and height decrease. In this experiment, 608 regions are existed in the difference image.
As described in Chapter 3.3, the proposed features are tested using manually extracted changed pixels and unchanged pixels. We choose the best four features for the real change extraction, including contrast and homogeneity for the images in 21
21 window size, contrast for the nDSM in 7
7 window size, and mean value for the nDSM in 3
3 window size.4.2 Results and evaluation
Figure 8. Parts of the change detection result (a: 2008; b: Pan-2009; c: Region based change detection results; d: Ground truth.)
i
is the row numberj is the column number j
i
V
, is the number of the occurrence in the GLCM matrix at the position (i,j) AThe testing area is quite complex because many change area are quite small with irregular shapes. However, the result of our region based change detection approach gives relatives good results in most of the test areas. To evaluate the effectiveness of the proposed method for the detection of changed forest areas and the general change situation, in this experiment, we manually extract the ground truth data in the deforestation area. We compare our test result with the manually extracted ground truth data, as show in Figure 8, Row a shows the images before change (year 2008), while Row b shows the images after change (year 2009), Row c is the change detection result with our approach, and Row d is the ground truth in the corresponding areas.
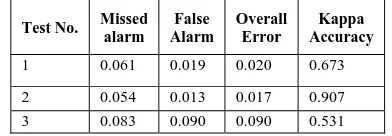
The change detection accuracy evaluation method shown in Tian (2011) is adopted in this research. Table 2 summarises the validation result from 3 test areas. In these results, the changes are clearly displayed with the shapes fixed to the real situations.
Test No. Missed
Table 2. Result evaluation of 3 selected deforestation areas
5. DISCUSSION AND CONCLUSION
The experiments are performed to evaluate a new approach for forest change detection using Cartosat-1 images and the generated DSMs from the stereo pairs.
First, automatic change detection in forest areas is a very complex task. Without multi-spectral information, by using only Cartesat-1 images makes this task more challenging. Therefore the approach is aiming to combine the information from nDSM to improve the detection efficiency and accuracy.
Second, it is worth noting that the co-registration is a necessary prerequisite for this evaluation and an essential task for this kind of change detection. The non-linear 3D co-registration is supposed to perform better than the linear shift, but need more time in calculation. More tests will be done in future work if larger areas will be investigated.
Third, GLCM texture parameters work well in forest change extraction. In this paper, only one direction with shift window sizes are tested, more directions GLCM will be used to improve the texture feature based change extraction in further investigations.
The results achieved are quite promising, although some parts of the DSMs generated by stereo matching exhibit low quality height values. However by a combination with the original images efficient forest change detection can be performed, even to detect small changes at forest borders.
REFERENCE
Akca, D., 2007. Least Squares 3D surface matching. Ph.D. thesis, Institute of Geodesy and Photogrammetry, ETH Zurich, Switzerland.
Anjos, A.D., and Shahbazkia, H., 2008. Bi-Level Image Thresholding - A Fast Method. In Proceedings of BIOSIGNALS, 2, pp. 70-76.
Bruzzone, L., and Serpico, S.B., 1997. An Iterative Technique for the Detection of Land-Cover Transitions in Multitemporal Remote-Sensing Images. IEEE Transactions on Geoscience and Remote Sensing, 35(2), pp.858-867.
Comaniciu, D., and Meer, P., 2002. Mean-shift: A robust approach toward feature space analysis. IEEE Transactions on Pattern Analysis and Machine Intelligence, 24(5), pp. 603-619.
Coppin, P. R., and Bauer, M. E., 1996. Digital change detection in forest ecosystems with remote sensing imagery. Remote Sensing Reviews, 13, pp. 207–234.
Dai, X., and Khorram, S., 1998. The effects of image misregistration on the accuracy of remotely sensed change detection. IEEE Transactions on Geoscience and Remote Sensing., 36(5), pp. 1566-1577.
d'Angelo, P., Lehner, M., and Krauss, T., 2008. Towards Automated DEM Generation from High Resolution Stereo Satellite Images. International Society for Photogrammetry and Remote Sensing, pp. 1137-1342.
Desclee, B., Bogaert, P., and Defourny, P., 2006. Forest change detection by statistical object-based method. Remote Sensing of Environment, 102, pp. 1-11.
Grohman, G., Kroenung, G., and Strebeck, J., 2006. Filling SRTM voids: The delta surface fill method. Photogrammetric Engineering and Remote Sensing 72(3), pp. 213-216.
Hirschmüller, H., 2008. Stereo processing by semiglobal matching and mutual information. IEEE Transactions on Pattern Analyses and Machine Intelligence, 30 (2), pp. 1-14.
Johnson R. D., and Kasischke E. S., 1998. Change vector analysis: A technique for the multispectral monitoring of land cover and condition. International Journal of Remote Sensing, 19(3), pp. 411-426.
Kamini, J., Jayanthi, S.C., and Raghavswamy, V., 2006. Spatio-temporal analysis of land use in urban Mumbai-using mulit-sensor satellite data and GIS techniques. Journal of Indian Society of Remote Sensing, 34(4), pp. 385-396.
Lu, D., Mausel, P., Brondizio, E., and Moran, E., 2004. Change Detection Techniques. International Journal of Remote Sensing, 25 (12), pp. 2365-2407.
Mas, J.-F., 1999. Monitoring land-cover changes: a comparison of change detection techniques, International Journal of Remote Sensing, 20(1), pp. 139-152.
Mora, B., Wulder, M. A., and White, J. C., 2010. Segment-contrained regression tree estimation of forest stand height from very high spatial resolution panchromatic imagery over a boreal environment. Remote Sensing of Environment, 114, pp. 2474-2484.
Prabaharan, S., Srinivasa Raju, K., Lakshumanan, C., and Ramalingam, M., 2010. Remote sensing and GIS application on change detection study in coastal zone using multi temporal satellite
data. International Journal of Geomatics and Geosciences, 1(2), pp. 159-166.
Tian, J., Chaabouni-Chouayakh, H., and Reinartz, P., 2011. 3D building change detection from high resolution spaceborne stereo imagery. M2RSM, Xiamen.
Willian A. M., 1980. Change vector analysis: An approach for detecting forest changes with Landsat. Machine processing of remotely sensed data symposium, pp. 326-335.