AUTOMATIC RECONSTRUCTION OF 3D BUILDING MODELS FROM TERRESTRIAL
LASER SCANNER DATA
El Meouche R.1,a, Rezoug M.1, Hijazi Ihab2. Dieter MAES3
1
Université Paris-Est, Institut de Recherche en Constructibilité, ESTP, F-94230, Cachan, France 2
An-Najah National University, Nablus, Palestine a
Hogeschool Gent, Faculty of Applied Engineering Sciences
KEY WORDS: laser scanning, automatic reconstruction, point cloud reconstruction, recognition of forms, building modeling.
ABSTRACT:
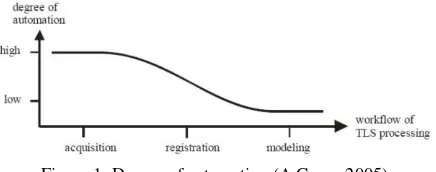
With modern 3D laser scanners we can acquire a large amount of 3D data in only a few minutes. This technology results in a growing number of applications ranging from the digitalization of historical artifacts to facial authentication. The modeling process demands a lot of time and work (Tim Volodine, 2007). In comparison with the other two stages, the acquisition and the registration, the degree of automation of the modeling stage is almost zero. In this paper, we propose a new surface reconstruction technique for buildings to process the data obtained by a 3D laser scanner. These data are called a point cloud which is a collection of points sampled from the surface of a 3D object. Such a point cloud can consist of millions of points. In order to work more efficiently, we worked with simplified models which contain less points and so less details than a point cloud obtained in situ. The goal of this study was to facilitate the modeling process of a building starting from 3D laser scanner data. In order to do this, we wrote two scripts for Rhinoceros 5.0 based on intelligent algorithms. The first script finds the exterior outline of a building. With a minimum of human interaction, there is a thin box drawn around the surface of a wall. This box is able to rotate 360° around an axis in a corner of the wall in search for the points of other walls. In this way we can eliminate noise points. These are unwanted or irrelevant points. If there is an angled roof, the box can also turn around the edge of the wall and the roof. With the different positions of the box we can calculate the exterior outline. The second script draws the interior outline in a surface of a building. By interior outline we mean the outline of the openings like windows or doors. This script is based on the distances between the points and vector characteristics. Two consecutive points with a relative big distance will form the outline of an opening. Once those points are found, the interior outline can be drawn. The designed scripts are able to ensure for simple point clouds: the elimination of almost all noise points and the reconstruction of a CAD model.
1. INTRODUCTION
In the architecture, engineering and construction domain, three-dimensional measurement techniques with a laser scanner are becoming more popular. Because almost any object can be scanned with purpose to get a three-dimensional model of the object, the number of applications is huge. The applications range from control of manufactured items and rapid prototyping to reverse engineering (X. Xiong 2013). Other applications include: special effect in the film animation industry, non-contact facial authentication, topographic maps et cetera. (Tim Volodine 2007).
Scanned buildings can be used for different applications like GIS, BIM, game-development etc. (Alexander Wolff 2008) Laser scanners can rapidly capture the "as-built" situation, which may differ significantly from the design drawings. This “as-built” situation can be interesting for renovations or space usage planning, managing building maintenance et cetera. Xiong 2013).
Despite many applications, the biggest challenge for a 3D scan is currently still to reconstruct a CAD model from the point cloud obtained by a 3D laser scanner. The acquisition, or the scanning process, is almost completely automated. (Theory and practice on Terrestrial Laser Scanning, 2008) The assembling of the different obtained scans, also referred as the registration, is usually done (semi-)automatically with software provided by the manufacturer of the scanning device. But the reconstruction of a CAD model is thus still primarily a manual operation and is very labor-intensive. (Xiong 2013).
Figure 1: Degree of automation (A.Gruen 2005)
In this paper, we propose two scripts to automate the building reconstruction from a point cloud in the 3D modeling software Rhinoceros 5.0.
2. RELATED WORK 2.1 Literature review
There has already been done a lot of research in the field of the automation of the reconstruction of point clouds. In the literature we can find several big theses on this subject. But unfortunately we cannot find a decent software package which offers a satisfactory solution up until now. Below an overview of some notable ideas is given.
The first, and the most remarkable, work is ‘The Ball -Pivoting Algorithm for Surface Reconstruction’ from several authors inter alia: F. Bernardini, J. Mittleman. (F. Bernardini 1999 ) The Ball-Pivoting Algorithm (BPA) calculates a triangle mesh interpolating a point cloud. If a ball of a user-specified radius touches three points without containing any other point, these points form a triangle. Starting with a seed triangle, the
ball pivots around an edge until it touches another point, forming another triangle. The process continues until all reachable edges have been tried. Then the same process is started from another seed triangle, until all points have been considered. The algorithm can be applied to datasets of millions of points representing complex 3D objects, thus not only building surfaces. The BPA requires a relatively small amount of memory, is time efficient and its result has a good quality. (F. Bernardini 1999).
Figure 2: Ball-Pivoting Algorithm for Surface Reconstruction (F. Bernardini & J. Mittleman 1999)
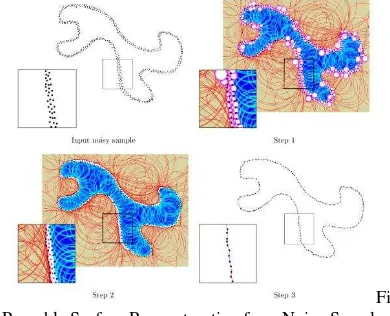
In ‘Provable Surface Reconstruction from Noisy Samples’ by Tamal K. Day and Samrat Goswami, the authors hackle the lack of theoretical guarantees on the algorithms proposed for surface reconstruction. [13] Their algorithm has theoretical guarantees for surface reconstruction in presence of noise.
Figure 3: Provable Surface Reconstruction from Noisy Samples (T.
Day & S. Goswani 2004)
The algorithm works with Delaunay-balls, which are balls circumscribing a mesh facet and centered on the surface. (Laurent Rineau, Mariette Yvinec 2013) Big and small Delaunay balls are separated, as well as outer and inner balls. Only the points on the outer big Delaunay balls are retained and the surface is reconstructed from them.(T. Day & S. Goswani 2004).
Although it is not explicit mentioned, the two previous algorithms seems to be concentrated more on reconstructing surfaces of artifacts than buildings. Just like the algorithm of N. Amenta (N. Amenta 1998) which is based on Voronoi-diagrams. A Voronoi-diagram is a mathematical way of dividing space into a number of regions.
Also Jenke’s and his partners’ (P. Jenke 2006) script is more suitable for artifacts than buildings. They use a probability distribution and Bayes’ theorem to make a reconstruction with the biggest probability possible. Bayes’ law is a result that is of importance in the mathematical manipulation of conditional probabilities.
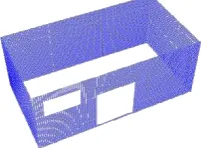
In their paper Vosselman and Pu describe their approach to extract automatically building features from terrestrial laser scanned data. First the point cloud is segmented into several planar parts according to the point’s position and direction. Each segment is considered a potential building feature. Several important properties (size, direction, topology, position etc.) are
retrieved from the segments. A couple of feature constraints are defined for each building feature, based on human knowledge about buildings.
Figure 4: Segmentation result of a building facade (Vosselman and Pu 2006)
For example, we know the feature “wall” is usually the biggest plane in building facade, and it is usually vertical. In the final step, building features are recognized out of segments by checking each segment’s properties through the feature constraints. The automatic 3D building model reconstruction is then based on the recognized features. (Vosselman and Pu 2006)
2.2 Position of proposed approach
The approaches for building reconstruction can be in general subdivided into two fundamentally different groups: data driven and model driven methodologies. (P. Dorninger, N. Pfeifer 2008).
In model driven methods a predefined catalog of forms is prescribed. The models are tried and the one with the best fit is chosen. An advantage is that the final form is always topologically correct. A disadvantage is that complex shapes cannot be reconstructed. The possible variety of the resulting models is restricted by the predefined catalog of buildings or building parts. (P. Dorninger, N. Pfeifer 2008).
The other method, the data driven approach, is more flexible. The final model is immediately reassembled from the point cloud. Data driven approach requires certain assumptions and thus restrictions, e.g. considering curved structures. (P. Dorninger, N. Pfeifer 2008).
In the model driven area, the previous research is done for building reconstruction. But in the data driven area the previous works seemed to be concentrated more on either aerial point clouds or very complex forms, like sculptures or face reconstruction, and not mainly on buildings.
That is why we chose to make our own proper new data driven script. And although the final scripts are still restricted we stuck to the data driven approach because with further research, this could lead to the most flexible application. This approach is not based on any previous work and tries to tackle the automation from a new point of view.
3. ALGORITHMS
We propose two scripts to automate the building reconstruction from a point cloud in Rhinoceros. Rhinoceros is a stand-alone 3D modeling software, developed by Robert McNeel & Associates. As programming language we used the object-oriented programming language Python. (McNeel, R. 2010)
3.1 Methodology
As explained earlier certain assumptions need to be done: Because of the complexity and the diversity of the input data, we started with simplified models in order to gradually make the models more complex. These simplifications limit the input that the scripts can process. As a result, we always can imagine cases for which the algorithms will not work as desired. Despite the fact that in practice the points produced by a 3D scanner are measured with some regularity, the points in a point cloud are typically not assumed to be ordered. The assumption of unordered points allows us to make a script as general as possible, not depending on the type of scanner, on the type of modeling software or the way the object was scanned (Tim Volodine 2007).
Figure 6: Simplified point cloud
3.2 Script1: External outlines
Starting from a point cloud, this script draws the boundaries of the walls and roof. This without taking the openings in the surfaces into account.
The idea of the script is based on a thin box rotating around axes in the edges of the wall. This box looks for other surfaces. After finding all surfaces, the outline of the building can be drawn. This script is distinguished into two big parts: one part for the walls and another one for the roof.
3.2.1 External outlines of the walls
In the beginning an interaction with the user is needed. The number of walls has to be given and all points need to be selected. The fact that noise is also being selected will do, in most cases, no harm to the process of the script. After the selection, the script asks to indicate the two outermost points at the base of the longest wall. After entering a thickness, the box can be drawn. The user needs to consider wisely this thickness ass it will operate as the tolerance for the roughness of a wall. The box immediately contains the points of the first wall, so these points can be saved in a special list which will contain all points of all surfaces. All these points will be saved in the same coordinate system. Thereafter the box can rotate around an axis at the corner of the wall. The box turns by a step of two degrees. In every position, the box checks if it contains a sufficient amount of points. This sufficient amount of points is defined in the script as nbOfPointsNeeded (number of points needed). The command used to do this is IsPointInSurface. At each position Rhino knows the coordinates of the corners of the box and verifies for every point in the cloud if it is in this domain or not. When there are enough points found, the box
moves on by a step of one degree in order to find the most points. If the box finds less points, it returns to its previous position and stops rotating.
It can happen that the box does not contain all points of the wall. The box will translate along the wall in search of all points.
Figure 7: Rotating Box
Once the box has found its final position along the wall it can add the points to the list and search for its new rotation point (its new corner to rotate around). This new rotation point is one of the newly found points. It is the point which is the furthest away from the old rotation point. It can be found by calculating the horizontal distances from the old rotation point to every other point.
With a = (xa, ya, za) and b = (xb, yb, zb)
After this, the box can repeat the moving algorithms until the last surface is found. As a result a point cloud with considerably less noise is given. The amount of noise still remaining depends on the thickness used for the box.
In literature these last steps usually are described as segmentation. Segmentation allows for a decomposition of a building as represented in a point cloud into several surfaces. We get several segments which helps us to distinguish the different walls. (P. Dorninger, N. Pfeifer 2008).
Figure 8: All boxes capture all walls
In each corner then is drawn a cylinder, as well as at the top of the walls. With these cylinders the points for the outline are found. With these points we can draw the outline of the building.
Figure 9: Cylinders to capture points for the outline
Figure 10: Outline drawn through points
Figure 11: Original point cloud and result first script
3.2.2 External outlines of the roof
With the first part of the script, the outlines of the walls were found. With this second part the outline for the roof will be found.
At each wall a copy of the box was kept. In order to find the points of the roof, the boxes need to rotate around the upper edge of the wall. Because not all boxes necessarily need to rotate, the script interacts with the user by asking if the indicated box needs to be rotated.
After running through all copies, the intersection of the boxes can be calculated. Again, by drawing cylinders at the edges, the points needed for the contour are found.
Figure 12: Copies searching for roof parts
Figure 13: Cylinders to capture points for the outline (2)
Figure 14: Original point cloud and result first script (2) Script 2: Internal outlines
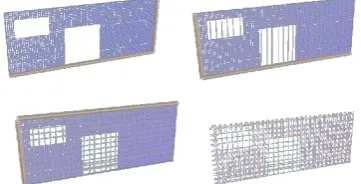
Once the external outline of the building has been found using the first script, the internal outlines have to be found. These internal outlines are openings in the wall like windows, doors, carports, etc. As explained earlier, because of the simplified models there are some restrictions. A point cloud acquired with a 3D laser scan will have points on the place of the framework of the window. Moreover, when the doors and carports are not entirely made of glass, there will be a lot of points on these so called openings. We emphasize once more the fact that this is a simplification and the script will not suffice for complex, in situ obtained, point clouds. Anyway, these simplified models and script can give a good understanding of how to treat a point cloud. The proposed algorithms are based on the comparison of vectors.
Due to the first script we have stored the points of each facade in separate lists. If we call these lists, we can access the points of a wall with openings in it.
Figure 15: One facade with two openings
In order to find the points which define the openings in the wall, a vertical and a horizontal cylinder are drawn. They will move along the facade and calculate the distance between two consecutive points.
Figure 15: Cylinders looking for the longest horizontal and vertical distances
When the distance between two consecutive points is much bigger than the resolution1 of the points, these two points are at the edge of the door or window.
With pn: a point
B: collection of edge points (Boundary) |pipj| or d(a,b) describes the well-known Euclidian distance between two points.
Thereafter, we have a list with points that define all the openings in one facade. The script will interact with the user, asking to differentiate the groups by selecting them by hand. Because there is no command in Rhinoceros to draw a rectangle through a set of points, the script uses vector characteristics. First the points for the horizontal lines are separated from those for the vertical lines. The principle used to do this is to search for parallel vectors. Parallel vectors have the characteristic that their cross product is equal to zero.
For the collection of vertical vectors (and there corresponding points) we know the vector is of the type of vector V in the equation below.
1
The average distance between two points at a specified distance from the device. E.g. 30 mm x 30 mm at 50m
Because of the sorting command in Rhinoceros, ran after selecting the group of points, the value Vz from each side differs by positive or negative sign. This gives us a list of points for right side and a list of points for the left side.
The horizontal vectors differ as well. The difference in direction forms the basis for making the distinction between a group of points for the upper edge and a group of points for the lower edge.
Figure 16: Separation of edges
The final result is four groups of points. Through each group a line can be drawn. After connecting them a solid rectangle can be constructed.
Figure 17: Outline of one opening drawn
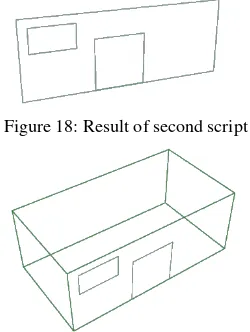
Repeating this for the remaining openings in the wall, as well as the remaining walls with openings, the final result can be drawn.
Figure 18: Result of second script
Figure 19: Combination of both scripts
4. SIMULATIONS
The first developed script has been applied to a set of examples using a Dell desktop and a HP laptop. We created these point clouds ourselves using a command in Rhinoceros. Properties of the computers are given in table underneath. The results of a few examples and a comparison of the peaks in the CPU-activity of the computers when we run the script are given.
Desktop Laptop
Brand Dell HP
Model Precision T3600 M6-1150SB 15.6 HD Processor Intel® Xeon® CPU
E5-16070 @3.00GHz
Intel® Core™ i5
-3210M CPU @2.50GHz
RAM 16.0 Gb 8.0 Gb
Type 64 bits 64 bits x64 processor
4.1 Example 1
The first example on which we applied our script is given in Figure 20. It concerns a simplified point cloud of a building with a flat roof. The point cloud exists of 13.062 points. In the same figure the result after running the script in Rhino is given. The table shows that maximum peak in CPU-activity of the laptop was significantly higher in the laptop than in the desktop.
Figure 20: Point cloud and result example 1
Desktop Laptop
Time +- 3min +- 2min
CPU maximum
37% 90%
Memory Before 19% (3.02Gb)
While 19% (3.10Gb)
Before 33% ( 2.6/7.9Gb)
While 33% ( 2.6/7.9Gb) Number
of points
13.062
Size file 31.090 Kb
4.2 Example 2
The second example has a saddleback roof. The point cloud and the final result are shown in Figure 21. Remarkable now, while running the script on the laptop, the CPU-activity once reached the 100%.
Figure 21: Point cloud and result example 2
Desktop Laptop
Time +- 3min +- 3min
CPU maximum
42% 100%
Memory Before 18% (3.01Gb)
While 19% (3.10Gb)
Before 30% ( 2.4/7.9Gb)
While 30% ( 2.4/7.9Gb) Number of
points
8.935
Size file 21.821 Kb
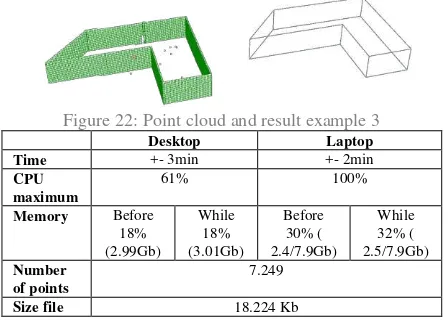
4.3 Example 3
This example was already explained in detail in a previous paragraph.
Figure 22: Point cloud and result example 3
Desktop Laptop
Time +- 3min +- 2min
CPU maximum
61% 100%
Memory Before 18% (2.99Gb)
While 18% (3.01Gb)
Before 30% ( 2.4/7.9Gb)
While 32% ( 2.5/7.9Gb) Number
of points
7.249
Size file 18.224 Kb
5. CONCLUSION AND FUTURE WORK We presented an approach to automate the modeling from point clouds. The designed scripts enable the automation of the 3D modeling in Rhinoceros 5.0 of the shape of a building represented by a simplified model. The scripts are based on simple mathematics. The first script is able to eliminate the biggest part of the noise and to draw the exterior shape of the building with a minimum of human interaction. The second script adds the outlines of the openings in the wall to the model. Simplified point clouds were used during this project. These point clouds had less detail and less points then an in situ point cloud. This simplification limits the input that the scripts can process, but still can give a good understanding of how to treat a point cloud.
With more improvements, refinements or modifications we are confident that the scripts will be capable of treating more complex point clouds and generate more complex models. A large-scale application on real point clouds can be a major contribution to this research. We hope that the presented algorithms can contribute to the field of digital geometry processing and to the demand for efficient point cloud processing techniques.
6. REFERENCES
Alexander Wolff, Reconstructie van Gebouwen, Faculteit Wiksunde en Informatica, TU Eindhoven (Eindhoven), 2008. David Rutten (Robert McNeel& Associates), Python for Rhinoceros 5 (third revision), 2011.
F. Bernardini, J. Mittleman, H. Rushmeier, The Ball-Pivoting Algorithm for Surface Reconstruction, IEEE Transactions on visualization and computer graphics, vol. 5, no.4, October-December 1999.
Gruen, A. and Akca, D. (2005). Least squares 3D surface and curve matching. ISPRS Journal of Photogrammetry
and Remote Sensing, 59(3): 151-174.
G. Vosselman and S. Pu, Automatic extraction of building features from terrestrial laser scanning, International Institute for Geo-information Science and Earth Observation (ITC), The Netherlands 2006.
Laurent Rineau, Mariette Yvinec, 3D Surface Mesh Generation, CGAL Open Source Project, consulted on 6 June 2013,
http://www.cgal.org/Manual/latest/doc_html/cgal_manual/Surfa ce_mesher/Chapter_main.html
McNeel, R. 2010. Rhinoceros - NURBS Modeling for Windows (version 4.0), McNeel North America, Seattle, WA, USA. (www.rhino3d.com/).
N. Amenta, M. Bern M. Kamvysselisy, A new Voronoi-based surface reconstruction algorithm, ACM, USA, 1998.
P. Dorninger, N. Pfeifer, A comprehensive Automated 3D Approach for Building Extraction, Reconstruction, and Regularization from Airborne Laser Scanning Point Clouds, Sensors – (ISSN 1424-8220) Open Acces Journal, 2008, 8, pages 7323-7343
Tamal K. Dey, Samrat Goswami, Provable Surface Reconstruction form Noisy Samples, Department Computer Science & Engineering, The Ohio State University, USA, 2004.
Tim Volodine, Point Cloud Processing Using Linear Algebra and Graph Theory, Departement of Computer Science, K.U. Leuven (Leuven), 2007.
X. Xiong, A. Adan, B, Akinci, Automation in Construction, Volume 31, May 2013, consulted on 8 June 2013, http://www.sciencedirect.com/science/article/pii/S09265805120 01732
3D RiskMapping (Education and Culture Leonardo da Vinci), Theory and practice on Terrestrial Laser Scanning, Europe, 2008.
Revised November 2013