M. Crosetto a, *, O. Monserrat a, M. Cuevas González a, N. Devanthéry a, B. Crippa b
a
Institute of Geomatics, Av. Gauss 11, E 08860, Castelldefels, Spain – (michele.crosetto, oriol.monserrat, maria.cuevas, nuria.devanthery)@ideg.es
b
Dept. of Earth Sciences, University of Milan, Via Cicognara 7, I 20129 Milan, Italy – [email protected]
! "SAR, DInSAR, deformation, monitoring, thermal expansion
"
Persistent Scatterer Interferometry (PSI) is a satellite based Synthetic Aperture Radar (SAR) remote sensing technique used to measure and monitor land deformation from a stack of interferometric SAR images. This work concerns X band PSI and, in particular, PSI based on very high resolution (VHR) StripMap CosmoSkyMed and TerraSAR X SAR imagery. In fact, it mainly focuses on the technical aspects of deformation measurement and monitoring over urban areas. A key technical aspect analysed in this paper is the thermal expansion component of PSI observations, which is a result of temperature differences in the imaged area between SAR acquisitions. This component of PSI observations is particularly important in the urban environment. This is an interesting feature of PSI, which can be surely used to illustrate the high sensitivity of X band PSI to very subtle displacements.
Thermal expansion can have a strong impact on the PSI products, especially on the deformation velocity maps and deformation time series, if not properly handled during the PSI data processing and analysis, and a comprehensive discussion of this aspect will be provided in this paper. The importance of thermal expansion is related to the fact that the PSI analyses are often performed using limited stacks of images, which may cover a limited time period, e.g. several months only. These two factors (limited number of images and short period) make the impact of a non modelled thermal expansion particularly critical. This issue will be illustrated considering different case studies based on TerraSAR X and CosmoSkyMed PSI data. Besides, an extended PSI model which alleviates this problem will be described and case studies from the Barcelona metropolitan area will demonstrate the effectiveness of the proposed strategy.
* Corresponding author.
#$
The Persistent Scatterer Interferometry (PSI) technique (Ferreti
et al., 2000, 2001), introduced in the late 1990s, has proven to be an effective tool to measure surface displacement from which numerous disciplines have benefited. For instance, successful terrain deformation estimates have demonstrated the usefulness of this technique for a wide range of applications related to tectonic (Vilardo et al., 2010; Funning et al., 2007; Lanari et al., 2007; Bürgmann et al., 2006; Musson et al., 2004) and volcanic activity (Hooper et al., 2004, 2007), landslides (Bovenga et al., 2012; Bovenga et al., 2006; Hilley et al., 2004; Colesanti et al., 2003), land subsidence caused by groundwater pumping (Heleno et al., 2011; Bell et al., 2008; Stramondo et
al., 2007; Tomás et al., 2005) and mining (Jung et al., 2007; Colesanti et al., 2005), or urban planning (Cigna et al., 2012; Crosetto et al., 2008; Vallone et al., 2008).
PSI is an advanced Differential Interferometric Synthetic Aperture Radar (DInSAR) technique based on data acquired by spaceborne SAR sensors. The standard DInSAR techniques exploit the information contained in the radar phase of at least two complex SAR images acquired at different times over the same area. PSI techniques implement suitable data modelling procedures that make the estimation of different parameters
possible. This estimation is based on appropriate statistical treatments of the available redundant DInSAR observations. Remarkable improvements are achieved using PSI techniques with respect to the standard methods. PSI offers wide area coverage associated to a relatively high spatial resolution, which allows monitoring an entire metropolitan area, thus obtaining a global outlook of the deformation phenomena, while keeping at the same time the capability to measure individual structures and buildings. Another main advantage of PSI is its high sensitivity, of the order of 1 mm/year, to small deformations. Besides, this technique exploits periodic and relatively low cost spaceborne data acquisitions and this remote capability allows obtaining a potential reduction in the amount of ground based observations, achieving simplified logistics operations and reducing personnel time and costs. Additionally, an unmatched capability is given by the ability to measure past deformation phenomena, which makes possible to study ground motions that occurred in the past and for which no other survey data are available. This is possible by using the huge SAR image archives, which in case of ERS starts in 1991.
The main products generated by the PSI technique are the deformation velocity maps and the deformation time series. The deformation velocity maps show the average displacement rates International Archives of the Photogrammetry, Remote Sensing and Spatial Information Sciences,
%&' ( )*(+ , +--* .
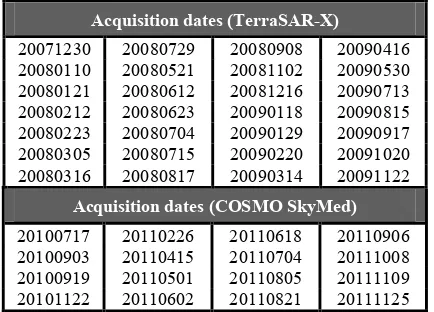
20071230 20080729 20080908 20090416 20080110 20080521 20081102 20090530 20080121 20080612 20081216 20090713 20080212 20080623 20090118 20090815 20080223 20080704 20090129 20090917 20080305 20080715 20090220 20091020 20080316 20080817 20090314 20091122
%&' ( )*(+ , /0 +).
20100717 20110226 20110618 20110906 20100903 20110415 20110704 20111008 20100919 20110501 20110805 20111109 20101122 20110602 20110821 20111125
Table 1. Dates of acquisition of the TerraSAR X and COSMO SkyMed images used in the PSI analysis.
during the observed period and allow a fast identification of areas of motion that might be of interest. After the areas of interest have been identified, a subsequent in depth analysis might be performed using the second product, the time series of deformation, which provide information on the temporal evolution of the displacement and allow an exhaustive analysis of the motion history for a given period of time. This is key information to identify potential causes of deformation, e.g. by analysing the time series with respect to the schedule of underground construction works, the lowering of a water table, etc.
As mentioned above, one of the major advantages of PSI is its high spatial resolution, which is given by the resolution of the satellite imagery used in the analysis. The finer resolution of the X band imagery captured by the sensors on board the TerraSAR X and COSMO SkyMed satellites allows single man made structure monitoring due to the increase in sampling density. It is worth emphasising that the actual PSI spatial sampling capability, and hence the PSI deformation measurement capability, is usually much lower than the resolution of the original SAR imagery. In fact, PSI deformation measurements can only be achieved for the points where PSI phases maintain good quality over time, i.e. for the Persistent Scatterers (PSs).
Due to the high quality of interferometric phases and high sensitivity of X band to subtle displacements, the PSI observations are highly influenced by the thermal expansion of the imaged objects. Although thermal expansion is also perceptible in C band PSI studies, this phenomenon is usually evident on time series of single PSs, while with X band PSI, thermal expansion is evident over large sets of PSs, whose high spatial density makes possible the analysis and interpretation of the thermal expansion signal of single objects like buildings, bridges, etc. (Monserrat et al., 2011). Measurement of deformation caused by thermal expansion is possible because with shorter wavelengths (λ = 3.1 cm in X band, 5.6 cm in C consequence of temperature differences in the imaged area between two SAR acquisitions. Although this is an interesting severe if a limited number of images is used in the analysis and the observed period is relatively short (e.g. shorter that a year). Several authors have reported thermal deformation in their linear velocity estimates (Fornaro et al., 2013; Monserrat et al., 2011; Reale et al., 2011; Crosetto et al., 2010; Gernhardt et al., 2010; Zhu and Bamler, 2010; Eineder et al., 2009; Adam et al., 2008).
In this paper, an extended PSI model which includes a phase component to capture the displacements related to temperature changes is described and discussed. Besides, several case studies illustrating parameter estimability and the consequences if the thermal component is not properly handled during the PSI processing and analysis are presented and discussed.
$
The approach used to handle the thermal expansion phase component is briefly outlined in this section. The proposed approach involves further developing the standard two parameter PSI model (e.g. see Biescas et al., 2007) with a third unknown parameter called the thermal expansion parameter (Monserrat et al., 2011), which is estimated for each analysed PS. The map obtained from plotting this parameter for all PSs of a given area, hereafter called thermal map, provides interesting information on the thermal behaviour of the observed scene, especially of buildings and infrastructures.
The new model is more accurate than those used in the standard PSI techniques because it explains the behaviour of PSI observations using three components, and hence three unknown parameters, instead of two: (i) the linear deformation velocity, which is related to the temporal baselines of interferograms; (ii) the Residual Topographic Error (RTE), related to the perpendicular baselines of interferograms; and (iii) the thermal expansion parameter, which is related to the average temperature differences at the time of acquisition of the images.
The main input of the procedure is a stack of wrapped interferograms, Ik, with k=1,…,N, from which only pixels with a
good interferometric phase quality, usually in terms of the amplitude dispersion criterion (Ferreti et al., 2001), over the whole set of interferograms are selected. The selected pixels are then connected by edges, computing the phase difference of each edge e and obtaining a vector of N differential interferometric wrapped phases k
e
Φ , where k indicates the interferogram number.
The core of the procedure consists in estimating the three unknowns of the extended model over each edge:
k
correspond to the differential velocity, RTE and thermal expansion parameter associated to the edge e; LTk, Bk┴ and
LTempk are the temporal baseline, the normal baseline and the International Archives of the Photogrammetry, Remote Sensing and Spatial Information Sciences,
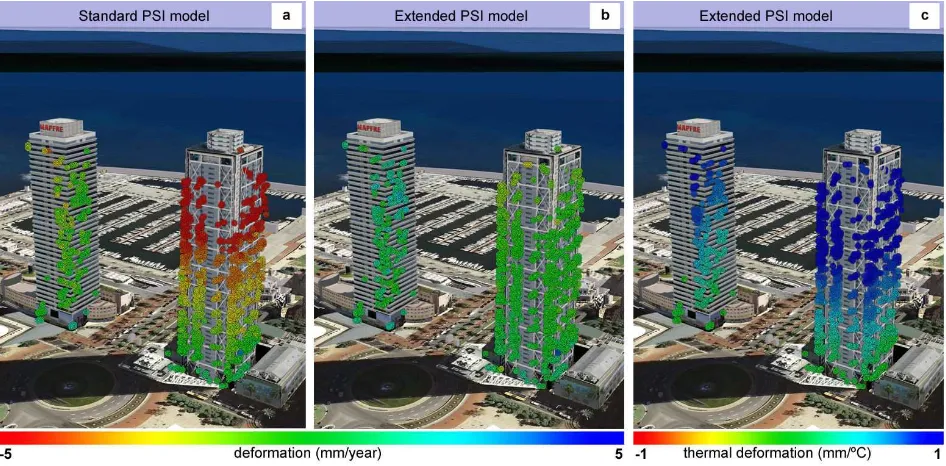
Figure 2. Geocoded deformation velocity maps estimated from 16 COSMO SkyMed images using the (a) standard PSI model and the (b) extended PSI model, and geocoded thermal map (c). The maps are superimposed over a Google Earth image
(© 2009 Google, Institut Cartogràfic de Catalunya). Figure 1. Thermal map of the Estació de França (Barcelona,
Spain) estimated from 28 TerraSAR X images using the extended PSI model.
difference of temperature between the acquisition of the two images of the interferogram k; Rek and
θ
ek are the slant rangeand incidence angle of the interferogram k corresponding to the edge e; λ is the radar wavelength; and k
e
res
Φ is the residual
phase component. The thermal dilation map is derived by integrating the LThe values over the entire set of edges.
It is worth emphasizing that the estimability of the above three unknown parameters depends on the so called network of available SAR images and the generated interferograms. Specifically, it depends on the number of available images and the range of distribution of the following three properties: the dates of acquisition of the images, the perpendicular baselines, and the temperature of the scene at the time of acquisition of the
images. For a detailed description of the standard and extended algorithms see Biescas et al. (2007) and Monserrat et al. (2011), respectively.
1$
As mentioned above, thermal expansion can have a strong impact on the deformation velocity maps if not properly handled during the PSI data processing and analysis. The consequences of applying the standard PSI model can be severe, as demonstrated in the following case studies.
Figure 1 shows a thermal map estimated from 28 TerraSAR X images (Table 1). Positive values indicate that positive temperature gradients induce displacement toward the SAR, while the negative ones cause displacements away from the SAR sensor. Note that these values refer to the SAR LOS. The behaviour shown by the railway station building mainly corresponds with thermal expansion in the horizontal direction: the centre of the roof of the building remains stable, i.e. there are not displacements associated with temperature changes, while an opposed movement in the longitudinal direction of the structure is evident with values ranging from 0.5 to 0.5 mm/ºC of temperature variation. This means that a temperature variation of 20ºC, a typical value between summer and winter in Barcelona, induces LOS displacement of up to 10 mm in this building. This case study corresponds to a successful estimation of the thermal and deformation components of the interferometric phases.
However, Figure 2 illustrates the consequences of performing a standard PSI analysis when an extended analysis is required. In this case, 16 COSMO SkyMed images (Table 1) were used to derive deformation velocity and thermal maps of the twin skyscrapers of Hotel Arts Barcelona and its neighbour Mapfre Tower located in the Olympic Port of Barcelona (Spain). Figure International Archives of the Photogrammetry, Remote Sensing and Spatial Information Sciences,
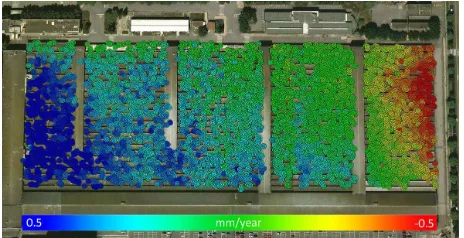
Figure 3. Deformation map of a warehouse estimated from 13 TerraSAR X images with the standard PSI model.
2a displays the deformation velocity map estimated with the standard PSI model, which clearly shows that the Mapfre Tower is not stable and that the displacement is as high as 5 mm/year. However, when an extended PSI analysis is performed (Fig. 2b), the resulting deformation velocity map reveals that the twin towers are actually stable and the thermal map (Fig. 2c) provides complementary information showing the gradient of deformation caused by the thermal expansion of the building. Maps 2a and 2b clearly display different displacement phenomena: the results of the extended PSI analysis indicate the existence of vertical thermal displacements which, in case of performing a standard PSI analysis, affect the deformation velocity map. This example clearly illustrates the necessity of using the extended PSI model in those areas where thermal expansion is expected.
Finally, the deformation velocity map shown in Figure 3, and resulting from a PSI standard analysis, exhibits a gradient over the warehouse under observation. This is a typical example of “virtual deformation” shown by a deformation velocity map, which is in fact due to horizontal thermal expansion of the observed industrial building: the authors know that neither the warehouse nor the terrain where it is located suffer deformation phenomena. In this case study, 13 TerraSAR X images covering the period December 2007 to September 2009 were used. The short period of observation together with the small number of images and the decision of performing a standard PSI analysis cause the deformation velocity map to be affected by the deformation caused by thermal expansion.
2$
An extended PSI model including a phase component to capture the displacement related to temperature changes has been described and discussed in this paper. Several case studies illustrating the application of PSI standard and extended analyses to Very High Resolution (VHR) TerraSAR X and Cosmo SkyMed SAR images have been presented. The case studies concern different buildings located in the metropolitan area of Barcelona (Spain) and the deformation velocity and thermal maps of these structures have been shown.
The results demonstrate that, if the thermal component is not properly handled during the PSI processing and analysis, the deformation caused by thermal expansion is wrongfully incorporated within the deformation velocity maps. Therefore the importance of carrying out extended PSI analyses to avoid unexpected and potentially misleading results. Additionally, a
strategy to estimate the deformation velocity maps without thermal interferences could be to restrict the PSI analysis to the PSs associated with object showing a negligible thermal expansion. In this regard, the “vertical component of thermal dilation” of buildings can be easily filtered by eliminating all PSs above a given elevation (with respect to a digital terrain model), i.e. above a given threshold using the Residual Topographic Error (RTE). This strategy can be useful to perform PSI analyses over short periods of time. Further work is needed to investigate the potential applicability of this strategy.
Adam, N., Eineder, M., Yague Martinez, N., Bamler, R., 2008. High resolution interferometric stacking with TerraSAR X. In:
Proc. IGARSS, Boston, MA, Jul. 7–11, pp. II 117–II 120. Bell, J.W., Amelung, F., Ferretti, A., Bianchi, M., Novali, F., 2008. Permanent scatterer InSAR reveals seasonal and long term aquifer system response to groundwater pumping and artificial recharge. Water Resour. Res., 44, W02407, doi:10.1029/2007WR006152.
Biescas, E., Crosetto, M., Agudo, M., Monserrat, O., Crippa, B., 2007. Two radar interferometric approaches to monitor slow and fast land deformations. J. of Surveying Engineering, 133(2), pp. 66–71.
Bovenga, F., Nutricato, R., Refice, A., and Wasowski, J., 2006. Application of multi temporal differential interferometry to slope instability detection in urban/peri urban areas. Eng. Geol., 88, pp. 219–240.
Bovenga, F., Wasowski, J., Nitti, D.O., Nutricato, R., Chiaradia, M.T., 2012. Using COSMO/SkyMed X band and ENVISAT C band SAR interferometry for landslides analysis. Remote Sens.
Environ., 119, pp. 272–285.
Bürgmann, R., Hilley, G. E., and Ferretti, A., 2006. Resolving vertical tectonics in the San Francisco Bay Area from Permanent Scatterer InSAR and GPS Analysis. Geology, 34, pp. 221–224.
Cigna, F., Osmanoglu, B., Cabral Cano, E., Dixon, T.H., Ávila Olivera, J.A., Garduño Monroy, V.H., DeMets, C., Wdowinski, S., 2012. Monitoring land subsidence and its induced geological hazard with Synthetic Aperture Radar Interferometry: A case study in Morelia, Mexico. Remote
Sensing of Environment, 117, pp. 146–161.
Colesanti, C., Ferretti, A., Prati, C., and Rocca, F., 2003. Monitoring landslides and tectonic motions with the Permanent Scatterers Technique. Eng. Geol., 68, pp. 3–14.
Colesanti, C., Le Mouélic, S., Bennani, M., Raucoules, D., Carnec, C. and Ferretti, A., 2005. Detection of mining related ground instabilities using the permanent scatterers technique a case study in the east of France. Int. J. Remote Sens., 26(1), pp. 201–207.
Crosetto, M., Biescas, E., Duro, J., Closa, J., Arnaud, A., 2008. Generation of Advanced ERS and Envisat Interferometric SAR Products Using the Stable Point Network Technique.
Photogramm. Eng. Rem. S., 74(4), pp. 443–450.
Crosetto, M., Monserrat, O., Iglesias, R., Crippa, B., 2010. Persistent scatterer interferometry: Potential, limits and initial C and X band comparison. Photogramm. Eng. Remote Sens., 76(9), pp. 1061–1069.
Eineder, M., Adam, N., Bamler, R., Yague Martinez, N., Breit, H., 2009. Spaceborne spotlight SAR interferometry with TerraSAR X. IEEE Trans. Geosci. Remote Sens., 47(5), pp. 1524–1535.
Ferretti, A., Prati, C., Rocca, F., 2000. Nonlinear subsidence rate estimation using permanent scatterers in differential SAR International Archives of the Photogrammetry, Remote Sensing and Spatial Information Sciences,
interferometry. IEEE Trans. Geosci. Remote Sens., 47(5), pp. 2202–2212.
Ferretti, A., Prati, C., Rocca, F., 2001. Permanent scatterers in SAR interferometry. IEEE Trans. Geosci. Remote Sens., 39(1), pp. 8–20.
Fornaro, G., Reale, D., Verde, S., 2013. Bridge Thermal Dilation Monitoring With Millimeter Sensitivity via Multidimensional SAR Imaging. IEEE Geosci. Remote Sens.
Lett., 10(4), pp. 677–681.
Funning, G.J., Burgmann, R., Ferretti, A., Novali, F., Fumagalli, A., 2007. Creep on the Rodgers Creek fault, northern San Francisco Bay area from a 10 year PS InSAR dataset. Geophys. Res. Lett., 34, L19306. doi:10.1029/2007GL030836.
Gernhardt, S., Adam, N., Eineder, M., Bamler, R., 2010. Potential of very high resolution SAR for persistent scatterer interferometry in urban areas. Ann. GIS, 16(2), pp. 103–111. Heleno, S.I.N., Oliveira, L.G.S., Henriques, M.J., Falcão, A.P., Lima, J.N.P., Cooksley, G., Ferretti, A., Fonseca, A.M., Lobo Ferreira, J.P., Fonseca, J.F.B.D., 2011. Persistent Scatterers Interferometry detects and measures ground subsidente in Lisbon. Remote Sens. Environ., 115, pp. 2152–2167.
Hilley, G. E., Bürgmann, R., Ferretti, A., Novali, F., and Rocca, F., 2004. Dynamics of slow moving landslides from Permanent Scatterer analysis. Science, 304 (5679), pp. 1952–1955. Hooper, A., Zebker, H., Segall, P., and Kampes, B., 2004. A new method for measuring deformation on volcanoes and other natural terrains using InSAR persistent scatterers. Geophys. Res.
Lett., 31(23), L23611, doi:10.1029/2004GL021737.
Hooper, A., Segall, P., Zebker, H., 2007. Persistent scatterer interferometric synthetic aperture radar for crustal deformation analysis, with application to Volcán Alcedo, Galápagos. J.
Geophys. Res., 112, B07407, doi:10.1029/2006JB004763. Jung, H., Kim, S., Jung, H., Min, K, Won, J., 2007. Satellite observation of coal mining subsidence by permanent scatterer analysis. Eng. Geol., 92, pp. 1–13.
Lanari, R., Casu, F., Manzo, M., Lundgren, P., 2007. Application of the SBAS DInSAR technique to fault creep: A case study of the Hayward fault, California. Remote Sens.
Environ., 109, pp. 20–28.
Monserrat, O., Crosetto, M., Cuevas M., Crippa B., 2011. The thermal expansion component of Persistent Scatterer Interferometry observations. IEEE Geosci. Remote Sens. Lett., 8, pp. 864–868.
Musson, R. M. W., Haynes, M., and Ferretti, A., 2004. Space based tectonic modelling in subduction areas using PSInSAR,
Seismol. Res. Lett., 26(9), pp. 1913–1926.
Reale, D., Fornaro, G., Pauciullo, A., Zhu, X., Bamler, R., 2011. Tomographic imaging and monitoring of buildings with very high resolution SAR data. IEEE Geosci. Remote Sens.
Lett., 8, pp. 661–665.
Stramondo, S., Saroli, M., Tolomei, C., Moro, M., Doumaz, F., Pesci, A., Loddo, F., Baldi, P., Boschi, E., 2007. Surface movements in Bologna (Po Plain – Italy) detected by multitemporal DInSAR. Remote Sens. Environ, 110, pp. 304– 316.
Tomás, R., Márquez, Y., Lopez Sanchez, J.M., Delgado, J., Blanco, P., Mallorquí, J.J., Martínez, M., Herrera, M., Mulas, J., 2005. Mapping ground subsidence induced by aquifer overexploitation using advanced Differential SAR interferometry: Vega Media of the Segura river (SE Spain) case study. Remote Sens. Environ, 98, pp. 269–283.
Vallone, P., Giammarinaro, M. S., Crosetto, M., Agudo, M., Biescas, E., 2008. Ground motion phenomena in Caltanissetta (Italy) investigated by InSAR and geological data integration.
Eng. Geol., 98, pp. 144–155.
Vilardo, G., Isaia, R., Ventura, G., De Martino, P., Terranova, C., 2010. InSAR Permanent Scatterer analysis reveals fault re activation during inflation and deflation episodes at Campi Flegrei caldera. Remote Sens. Environ., 114, pp. 2373–2383. Zhu, X.X., Bamler, R., 2010. Very high resolution spaceborne SAR tomography in urban environment. IEEE Trans. Geosci.
Remote Sens., 48, pp. 4296–4308.
!
Six of the 28 TerraSAR X images used in this study were acquired within the frame of the Project “Evaluation of DEM derived from TerraSAR X data, LAN0634,” of the TerraSAR X Science Service Program. The CosmoSkyMed images used in this work were provided by the Italian Space Agency (ASI) under the CosmoSkyMed AO Project ID 2236.