*Corresponding Author
EXTRACTING ACCURATE AND PRECISE TOPOGRAPHY FROM LROC NARROW
ANGLE CAMERA STEREO OBSERVATIONS
M. R. Henriksen a*, M. R. Manheim a, E. J. Speyerera, M. S. Robinson a, LROC Team a a
School of Earth and Space Exploration, Arizona State University, 1100 S. Cady Mall, Tempe, AZ, USA- [email protected]
Commission IV, WG IV/8
KEY WORDS: DEM/DTM, Three-dimensional, Application, Planetary, Mapping, Geomorphology, Modeling, Processing
ABSTRACT
The Lunar Reconnaissance Orbiter Camera (LROC) includes two identical Narrow Angle Cameras (NAC) that acquire meter scale imaging. Stereo observations are acquired by imaging from two or more orbits, including at least one off-nadir slew. Digital terrain models (DTMs) generated from the stereo observations are controlled to Lunar Orbiter Laser Altimeter (LOLA) elevation profiles. With current processing methods, digital terrain models (DTM) have absolute accuracies commensurate than the uncertainties of the LOLA profiles (~10 m horizontally and ~1 m vertically) and relative horizontal and vertical precisions better than the pixel scale of the DTMs (2 to 5 m). The NAC stereo pairs and derived DTMs represent an invaluable tool for science and exploration purposes. We computed slope statistics from 81 highland and 31 mare DTMs across a range of baselines. Overlapping DTMs of single stereo sets were also combined to form larger area DTM mosaics, enabling detailed characterization of large geomorphic features and providing a key resource for future exploration planning. Currently, two percent of the lunar surface is imaged in NAC stereo and continued acquisition of stereo observations will serve to strengthen our knowledge of the Moon and geologic processes that occur on all the terrestrial planets.
1. INTRODUCTION
The Lunar Reconnaissance Orbiter (LRO) was launched on 18 June 2009 and is currently in a lunar polar orbit (Vondrak et al. 2010). Among the seven LRO instruments are LROC and LOLA. The LROC instrument consists of three cameras, including two identical NACs (Robinson et al. 2010) that provide panchromatic images at pixel scales of 0.5 m to 2.0m. From NAC stereo observations and altitude measurements provided by LOLA, researchers are able to produce accurate DTMs (Henriksen et al., 2016).
Here we describe the method used to produce accurate and precise NAC DTMs at the LROC Science Operations Center (SOC). We also present techniques used for evaluating the resulting DTMs in terms of their precision and accuracy as well as an investigation of surface roughness based on the available NAC DTM population.
2. DATA SOURCES
2.1 Narrow Angle Cameras
The NAC consists of two linear pushbroom cameras with the linear arrays perpendicular to the flight direction. Each camera has a field of view (FOV) of ~2.86°, and the NAC arrays (1 ×
5064 pixels) are positioned so the region observed overlaps by ~135 pixels cross-track (Robinson et al. 2010). Together, the NAC-Left (NAC-L) and NAC-Right (NAC-R) cameras almost double the imaged swath width during each observation, covering a total area 5 km wide and ~26 km long from a 50 km altitude. Details concerning radiometric and geometric properties of the NACs are presented in three papers (Robinson et al. 2010, Speyerer et al. 2014, and Humm et al. 2015).
NAC stereo observations require images from two or more orbits covering the same ground location, where the spacecraft
is slewed off-nadir for a minimum of one orbit. Slew angles are typically ≤30° to acquire convergence angles ranging from 10°
to 45° (the average convergence angle for NAC DTMs is 28°). Stereo sets are usually obtained on consecutive orbits to ensure uniform illumination conditions.
2.2 LOLA Topographic Profiles
LOLA is a five-spot time-of-flight altimeter that uses a single laser pulse; the spots are measured with five detectors. The nominal ranging precision is 10 cm at 28 Hz (LOLA’s nominal pulse rate, with an uncertainty of ±0.1 Hz) (Zuber et al. 2010). Laser shots (5-spot pattern) are acquired every 57 m when the spacecraft is traveling at a velocity of 1.6 km/s. For an altitude of 50 km, each spot in the five-spot cross pattern (canted 26°) is 25 m apart and has a diameter of 5 m, while each detector FOV has a diameter of 20 m (Zuber et al. 2010). The LOLA instrument boresight is aligned with the NAC cameras so that altimetry can be collected in the overlap region between the NAC-L and NAC-R.
NAC stereo models are aligned with the LOLA altimeter profiles to improve the accuracy of the final DTM product. Profiles are from the LOLA Reduced Data Record (RDR) products (Version ID: v1.04), which were released on 21 July 2014 to the NASA Planetary Data Service (PDS). Spacecraft ephemeris were significantly improved using LRO radiometric tracking data and the GRAIL gravity model, subsequently increasing the geodetic accuracy (Lemoine et al. 2014; Mazarico et al. 2013). These corrections reduce each spot’s positional uncertainty to <10 m horizontally and <1 m vertically (Mazarico et al. 2013).
3. METHODOLOGY
3.1 Pre-Processing
DTM processing at the LROC SOC is completed using the Integrated Software for Imagers and Spectrometers (ISIS) (Anderson et al. 2004) and SOCET SET, commercial photogrammetric software from BAE Systems. ISIS 3.4 is used to ingest, radiometrically calibrate, and gather orientation information for the stereo set (consisting of two or more NAC image pairs). First, the Experiment Data Records (EDRs) are transformed to the ISIS cube format and radiometrically calibrated following methods outlined by Humm et al. (2015). Orientation parameters are then added to the image header. Using ISIS, the position, orientation, and camera information is converted to keywords containing SOCET SET-compatible parameters, including spacecraft coordinates, altitude, Euler angles, and lunar ephemeris (Henriksen et al. 2016). The images and orientation parameters are then imported into SOCET SET.
3.2 Relative Orientation
Spacecraft navigation and camera orientation information inevitably involves an element of uncertainty; in order to extract elevation estimates for DTMs, relative orientation must be computed for the images. To facilitate this correction, between 100 and 600 tie points connecting the images in the stereo model are found for each stereo pair, depending on native pixel scale and topography.
Next, a multi-sensor triangulation (MST) algorithm is used to align the images (BAE Systems 2009). Spacecraft and camera parameters are used as inputs into the algorithm to optimize the solution. A-priori bias weights for the triangulation are chosen based on our knowledge of spacecraft ephemeris, typical image duration, and spacecraft orientation (Henriksen et al. 2016). We examine all point residuals from the bundle adjustment solution and correct any point with a residual >1.0 pixel. The RMSE for a stereo pair (or a stereo mosaic) is considered low enough to ensure internal consistency when it is less than 0.5 pixels. Once these criteria have been met, a preliminary DTM is extracted (see section 3.5) and exported from SOCET SET as a GeoTIFF for absolute registration.
3.3 Absolute Orientation from LOLA Ranging
Absolute control is achieved by identifying exact horizontal and vertical ground (xyz) coordinates for a given pixel location in the image and adding them as ground points. Ground control information for the LROC NAC DTMs is derived by co-registering a preliminary DTM to LOLA profiles. The LROC team has developed an automated tool for this registration using MATLAB’s Optimization Toolbox.
Each LOLA profile is registered individually, eliminating the effects of inconsistencies between profiles. The MATLAB optimization algorithm based on the simplex search method of between every LOLA point and corresponding DTM elevation. A profile must have RMSE <1.0 m to be considered acceptably co-registered with the DTM (Henriksen et al. 2016).
Control points are chosen from each registered profile where the adjusted LOLA spots in that profile best agree with the DTM. another triangulation is performed with the new control points to correct the absolute orientation of the stereo images.
The new triangulation solution is assessed based on the RMSE values for latitude, longitude, and elevation associated with each control point, as well as overall RMSE. A stereo model is considered sufficiently controlled when these control point RMSEs are less than the uncertainties of the LOLA profiles and a satisfactory RMSE for the triangulation solution has been obtained. DTMs at this stage typically have ~40 control points. At this point the triangulation is considered final, and the images are updated with the improved orientation.
3.4 DTM Extraction
The Next Generation Automatic Terrain Extraction (NGATE) module in SOCET SET extracts elevations at each pixel from epipolar-rectified images to create DTMs at a post spacing of at least three times the pixel scale of the input stereo images (NGATE is also used to create the preliminary DTM for the LOLA profile registration step). NGATE employs several image matching algorithms concurrently over multiple passes to achieve robust results (BAE Systems 2007; Zhang 2006). Using strategies tailored for the lunar surface to adjust algorithm performance, NGATE is able to extract a dense DTM with few blunders (defined as a correlation discrepancy that produces areas of false topography).
Despite these robust image correlation techniques, the terrain extracted by NGATE typically contains a small population of blunders, especially near the edges of a stereo model or in regions with steep topography. These artifacts are corrected using NGATE and the interactive editing tools available in SOCET SET. NGATE’s method of choosing the best data at each pixel also results in low-level noise in the DTMs (Zhang 2006). To reduce this noise, one pass of the Adaptive Automatic Terrain Extraction (ATE) SOCET SET algorithm is run on each DTM to correct the matching precision by a fraction of a pixel (Zhang et al. 2006). ATE may randomly change the matching the final, edited DTM and the orthophotos have been produced, these products, along with a figure of merit (a map of elevation measurement quality) are exported from SOCET SET. These products are then converted to PDS format for release to the archive. In the case of a DTM mosaic, the DTMs of each stereo set are also archived separately at their original post spacings (i.e. 2, 3, or 5 m). In addition, the Geospatial Data Abstraction Library (GDAL) is used to produce a 32-bit GeoTIFF version of the DTM and to derive terrain-shaded relief, color-shaded relief, and color slope maps as 8-bit GeoTIFFs with legends provided for the color slope and color-shaded relief maps, (Warmerdam 2008).
4. UNCERTAINTY ANALYSIS
DTM quality is assessed based on relative and absolute accuracies. SOCET SET estimates vertical precision based on spacecraft ephemeris and image correlation results, providing a measure of relative accuracy for each DTM. Absolute accuracy is evaluated by measuring offsets between the DTM and co-located LOLA profiles, the most accurate reference frame for the Moon. In addition to these metrics, the DTMs are also evaluated qualitatively.
4.1 Relative Accuracy
Relative linear error is recorded for each DTM as a metric indicating vertical precision. Linear error is defined by the normal distribution function at 90% probability, estimating uncertainty in one dimension for elevation of one point with respect to another point, and defined by the normal distribution function at 90% probability (BAE Systems 2009). This value is predicted to be between 0.5 and 2 times the image pixel scale and is calculated by SOCET SET based on the stereo image pixel scales, the convergence angle, and the quality of the image correlation from the DTM extraction algorithm (BAE Systems 2009). We report the horizontal precision to be equal to the DTM post spacing as the relative circular error, calculated by SOCET SET at a 90% confidence level, is consistently less than the scale of the DTM (BAE Systems 2009).
Stereo observations are imaged on consecutive orbits to yield approximately identical illumination environments and pixel scales. Therefore, the convergence angle between the stereo images is the most influential factor affecting DTM precision. To investigate this relationship, Henriksen et al. (2016) performed a case study using 5 m DTMs created from five co-located NAC image pairs. The images had slew angles of 16.9°, 8.6°, 0° (nadir), -9.0°, and -17.4°, and all the DTMs used the same set of tie and control points. The results showed that the largest convergence angle (34.3°) yielded the best linear error at 2.2 m, while convergence angles <10° had unacceptable linear errors (~8.5 m) (Henriksen et al. 2016).
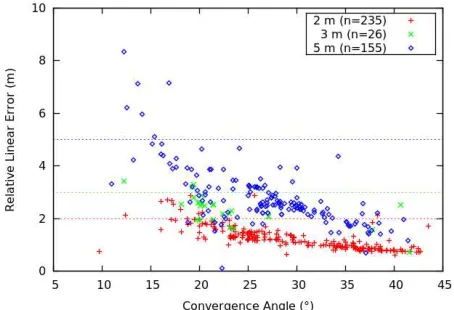
Figure 1. Convergence angle as a function of precision and DTM post spacing for all ASU NAC DTMs produced to date
(n=417).
We further examined the relationship between convergence angle and precision for the entire population of NAC DTMs made over the course of the project (Figure 1). The two main populations of 2 m and 5 m post spacing DTMs clearly constitute distinct populations. Around 15° and lower, relative linear error reaches a maximum of ~2, 3, or 5 m for the 2 m, 3
m, and 5 m post-spacing populations, with numerous outliers actually exceeding that limit. As convergence angle increases, these populations can be clearly seen to decrease. Ideally, we want our DTMs to have relative linear errors less than or equal to the post spacing of the DTM; this occurs for convergence angles greater than 20°. Our results allow us to provide a data-driven convergence angle recommendation to the LROC operations team so they can target stereo pairs that will yield DTMs with good vertical precisions.
Qualitative assessments are also performed for all NAC DTMs before final products are made. Terrain shaded reliefs created from the DTM are compared to the images to locate and remove any artifacts. The images are also closely compared to DTM-derived contour lines to identify any discrepancies in the topography.
4.2 Absolute Accuracy
Figure 2. Boxplots representing offsets between NAC DTMs and LOLA profiles over the course of LROC NAC DTM
production. Updated from Henriksen et al. (2016).
Elevations between the final DTM and LOLA profiles are compared and RMSE and mean absolute error (MAE) are reported as metrics indicating absolute accuracy. It is currently possible to achieve both MAE and RMSE values less than the post spacing of the DTM. Over time, median RMSE values have substantially decreased; the average RMSE for the last four years is 2.36 m for 248 DTMs (162 DTMs with post spacing > 2 m).
Post production, the LOLA profiles and the DTM are co-registered using the MATLAB-based registration program. We record the latitude, longitude, and elevation offsets (in meters) between the profiles fitted to the DTM and the original LOLA profiles (Figure 2). This re-registration is performed to calculate these offsets, and the result is not applied to the DTM. These values, in combination with the re-registration RMSE, may reveal persistent systematic offsets; ideally these offsets are less than 10 m horizontally and 1 m vertically. DTMs created before 2013 used a different registration process and lower-accuracy LOLA profiles and therefore may have systematic errors greater than the uncertainties associated with current LOLA profiles (Burns et al. 2012). Offsets have decreased in general as techniques have improved and, excepting a few outliers, are now constrained to within these uncertainties. The International Archives of the Photogrammetry, Remote Sensing and Spatial Information Sciences, Volume XLI-B4, 2016
4.3 Jitter
The NAC images are sensitive to jitter (small, unmodeled spacecraft movement), because they image line-by-line at times corresponding to the velocity and the instantaneous FOV of the detector. During DTM production, jitter is detectable as high triangulation residuals, excessive noise in the DTM, or ripples of geometric noise. Through extensive analysis, low frequency (1, 1.5, ~3, and ~7 Hz) jitter was linked to the movement of the high-gain antenna and solar array gimbals, which as a result are now held stationary during stereo observations (Henriksen et al. 2016; Mattson et al. 2011; McClanahan et al. 2012). Furthermore, high-frequency jitter (14, 18, 27, 42, 49, 67, and 72 Hz) was also found in stereo images over the course of the mission. Much of this jitter occurred between 2011 and late 2012 and was associated with the reaction wheel anomaly and the subsequently implemented momentum management scheme (Henriksen et al. 2016, McClanahan 2012). Images identified as affected by jitter are not used to produce DTMs; however, jitter at magnitudes too small to detect may still be present and can affect the geometric accuracy of the DTMs (Henriksen et al. 2016, McClanahan et al. 2012).
5. SCIENTIFIC AND ENGINEERING APPLICATIONS
NAC DTMs enable advances in both scientific and exploration contexts. Here we present results illustrating the utility of DTMs for sampling surface parameters across the globe and extending topographic studies across broad areas with DTM mosaics derived from multiple stereo pairs.
5.1 Global Slope Distribution and Roughness
Variation of slopes (roughness) of geologic units are quantified using many methods (cf. Rosenberg et al., 2011). From NAC DTMs Henriksen et al. (2016) investigated roughness distributions for representative lunar terrain types by computing slopes sampled across a range of post spacings: 2, 5, 10, 25, 50, 100, and 250 m. Slope was calculated on a pixel-by-pixel basis from a 3x3 sample grid (i.e. for a post spacing of 2 m the slope was computed across a 6 m by 6 m area) for 81 highland DTMs, and 31 mare examples (17 with a native post spacing of 2 m). DTMs with anomalously rough topography were excluded from their analysis. The median, mean, and standard deviation of the slopes in each DTM were computed at each post spacing. The means of these slope parameters were then computed separately for the ‘mare’ and ‘highland’ DTMs.
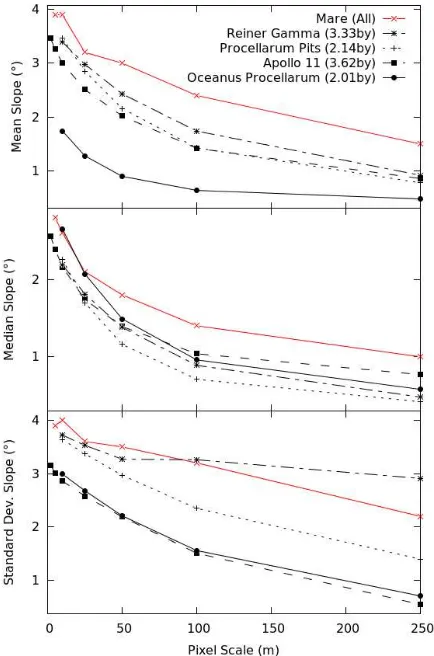
Figure 4. Mean, median, and standard deviation of slopes for DTMs of typical highland units compared to all highland DTMs. Curve marked “All” represents NAC highland DTM
population analysed in Henriksen et al. 2016.
The NAC derived slopes were compared to the LOLA-based global slope analysis presented by Rosenburg and co-workers (2011) from profiles sampled with baselines varying from ~17 m to 2.7 km. For an effective baseline of 17 m (defined as the square root of the area of an isosceles right triangle formed by any 3 adjacent spots in a LOLA shot), they reported median slopes for highland and mare of 7.5° and ≤3°, respectively. The NAC slope baselines (Henriksen et al., 2016) most comparable with LOLA values were computed from DTMs sampled at 5 and 10 m post spacings. LOLA and NAC median slopes for the mare were found to be similar; however, the NAC slopes for the highlands were greater on average (median values were 9.1° Figure 3. Mean, median, and standard deviation of slopes for
DTMs of typical mare units compared to all mare DTMs. Curve marked “All” represents NAC mare DTM population analysed
in Henriksen et al. (2016).
at 5 m post spacing and 8.9° at 10 m post spacing). However, NAC stereo pairs are not targeted randomly but focus on areas of specific scientific interest; Henriksen et al. (2016) concluded that the greater slopes seen in the NAC highland DTMs were simply a result of targeting bias. Here, we examine nine DTMs (both highland (5) and mare (4)) to further investigate the range of slopes as a function of terrain type and age (Figures 3,4).
The four mare DTMs selected have no large impact craters or highland kipukas and thus are assumed to be good representatives of their corresponding mare units as determined by Hiesinger et al. (2000, 2003). The two young mare are both located in Oceanus Procellarum and are informally named “Oceanus Procellarum” and “Procellarum Pits” after nearby features. Heisinger et al. (2003) report absolute model ages of 2.01 by (unit P49) and 2.14 by (unit P40) respectively. One of the older units is also found in Oceanus Procellerum (“Reiner Gamma”; 7.34°N, 301.36°E) and the other in Mare Tranquillitatis (“Apollo 11”; 0.78°N, 23.44°E). Model ages for these two units are 3.33 by (P16) and 3.62 by (T3/T18) reported in Heisinger et al. (2000, 2003). The slopes for all four units are close to or below that of “All”. The youngest unit (“Oceanus Procellarum”; 20.69°N, 304.39°E) is the smoothest (lowest slope values); this may be due to fewer accumulated impact craters and is not a surprising result. However, the unit “Procellarum Pits” (35.37°N, 314.36°E) is nearly the same age but has slope values more comparable of the two older mare units.
The five highland DTMs were selected to test the conclusion that the average highland slope value reported in Henriksen et al. (2016) is higher than that reported in Rosenberg et al. (2011) due to a targeting bias (stereo pairs are typically targeted towards features with greater than average topographic slopes). Of the five DTMs, three have slopes significantly lower than the NAC “All” slope values and the other two have slope values that are greater. Of the latter case the “Highland Photometry” (1.10°N, 149.70°E) area includes a relatively fresh (Copernican) crater that is possibly biasing the DTM roughness statistics; the “Highland Ponds” (42.27°N, 167.33°E) area contains several degraded (pre-Eratosthenian) craters that dominate the local topography that may be biasing the average slope to higher values. The remaining three DTMs with slopes below that of “All” (“Highlands Swirl”; 4.33°N, 114.93°E, “Complex Scarps”; 52.69°N, 46.27°E and “Apollo 16”; 9.13°S, 15.54°E) do not have any landforms that stand out as anomalously steep (note that North Ray and South Ray craters together make up simply due to a targeting bias. As more DTMs are produced this issue can be settled definitively.
5.2 Slope Statistics from DTM Mosaics
Many features of interest on the Moon are larger than a NAC-pair FOV; thus, complete topographic characterization requires multiple stereo pairs built to enable a DTM mosaic (see Section 3.2).
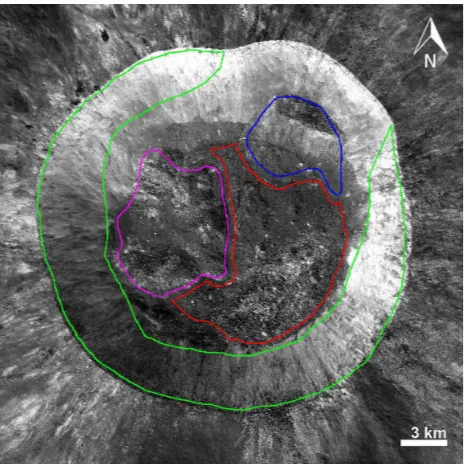
Wagner et al. (2013) used NAC DTM mosaics at 15x15 m baselines to characterize the topography of 20-km Copernican craters, including Giordano Bruno (35.7°N, 102.9°E). They found that interior wall slopes of 36° are common, especially on upper slopes and the termination lobes of large slumps, and that slopes significantly greater than 36° are associated with blocky outcrops and not granular material. They inferred that the angle of repose for dry granular material on the Moon is 36° for both highland and mare targets (consistent with theory and other slope maps were calculated over a 3x3 pixel area. We identified four distinct regions of Giordano Bruno crater for examination: the crater walls, excluding the northeast wall which is
Figure 5. Giordano Bruno crater mosaic indicating regions of study: Crater floor (red), crater wall (green), NE slump (blue),
and SW slump (magenta). calculated based on 5 m post spacing (15x15 m baseline).
We find our results for the crater walls (green unit, Figure 5) to be comparable to wall slopes reported previously (35±4° (Wagner et al., 2013); 34±5° this study; Table 1).
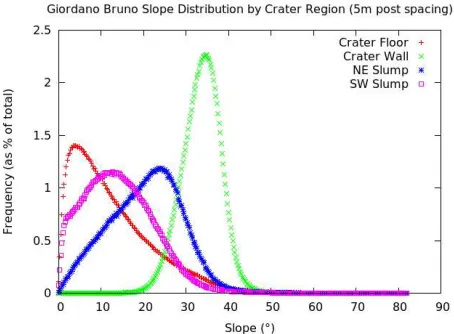
Figure 6. Distribution of slopes over various regions in Giordano Bruno crater, binned at 0.25°. Frequency is given as a
percent of total counts for each region.
We also examined the effects of downsampling on the mean, median, and standard deviation of slopes for each Giordano Bruno region at baselines of 15, 30, 75, and 150 m (Figure 7). Both the mean and median slope values found for crater wall remain steady across the range of baselines, implying relatively consistent slopes from rim to floor at these scales. We also note that the northeast slump has steeper slopes and less variation than the southwest slump. Mean and median slopes for the crater floor decrease rapidly as baselines increase, indicating many small-scale variations (rougher than the walls at the sampled scales).
Figure 7. Mean, median, and standard deviation of slopes for regions of Giordano Bruno crater, calculated for post spacings
of 5 m, 10 m, 25 m, and 50 m.
From these few examples presented here we demonstrate the value of high resolution topography that enables quantitative geomorphic study of all landforms across the Moon. Complete stereo coverage of key targets will enable a quantitative understanding of key geologic processes shaping the Moon relevant to many bodies across the Solar System.
6. CURRENT NAC DTM PRODUCTION
As of December 15, 2015 the LROC NAC has collected over 2400 sets of stereo observations covering ~2.9% of the lunar surface. ASU has processed and released 293 individual stereo pairs covering 167 regions of scientific interest over a total area of ~94,000 km2. ASU DTMs and all the associated products are
released through the PDS every three months and are available at http://wms.lroc.asu.edu/lroc/rdr_product_select.
ACKNOWLEDGEMENTS
We would like to acknowledge Brent Archinal, Annie Howington-Kraus, and Mark Rosiek from the USGS Astrogeology Center for their valuable input, and to thank the LOLA team for making their data available to us.
REFERENCES
Anderson, J. A., S. C. Sides, D. L. Soltesz, T. L. Sucharski, and K. J. Becker. 2004. Modernization of the Integrated Software for Images and Spectrometers. 35th LPSC, Abs. #2039. Houston, TX. Also see http://isis.astrogeology.usgs.gov.
BAE Systems. 2007. Next-Generation Automatic Terrain Extraction (NGATE). White Paper.
BAE Systems. 2009. SOCET SET User's Manual. Version 5.5. Burns, K. N., E. J. Speyerer, M. S. Robinson, T. Tran, et al. 2012. Digital elevation models and derived products from LROC NAC stereo observations. ISPRS Archives XXXIX-B4: 483-488. Melbourne, Australia: XXII ISPRS Congress. Henriksen, M. R., M. R. Manheim, K. N. Burns, P. Seymour, et al. 2016. Extracting and precise topography from LROC Narrow Angle Camera stereo observations. Icarus, submitted. Hiesinger, H., R. Jaumann, G. Neukum, and J. W. Head III 2000. Ages of mare basalts on the lunar nearside, 105, 29239-29275.
Hiesinger, H., J. W. Head III, U. Wolf, R. Jaumann, and G. Neukum 2003. Ages and stratigraphy of mare basalts in Oceanus Procellarum, MarE Nubium, Mare Cognitum, and Mare Insularum, Journal of Geophysical Research, 108, doi:10.1029/2002JE001985.
Horn, B. K. P. 1981. Hill shading and the reflectance map. P IEEE, 69(1), pp. 14-47.
Humm, D. C., M. Tschimmel, S. M. Brylow, P. Mahanti, et al. 2015. Flight calibration of the LROC Narrow Angle Camera.
Space Sci Rev, pp. 1-43.
Lagarias, J. C., J. A. Reeds, M. H. Wright, and P. E. Wright. 1998. Convergence properties of the Nelder-Mead simplex method in low dimensions. SIAM J Optimiz, 9(1), pp. 112-147. Lemoine, F. G., S. Goossens, T. J. Sabaka, J. B. Nicholas, et al. 2014. GRGM900C: A degree 900 lunar gravity model from GRAIL primary and extended mission data. Geophys Res Lett, 41, pp. 3382–3389.
Mahanti, P., M. S. Robinson, D. C. Humm, and J. D. Stopar. 2014. A standardized approach for quantitative characterization of impact crater topography. Icarus, 241, pp. 114-129.
Mattson, S., A. Bartels, A. Boyd, P. Calhoun, et al. 2011. Continuing analysis of spacecraft jitter in LROC-NAC. 42nd LPSC, Abs. #2756. The Woodlands, TX.
Mazarico, E., S. J. Goossens, F. G. Lemoine, G. A. Neumann, et al. 2013. Improved orbit determination of lunar orbiters with lunar and gravity fields obtained by the GRAIL mission. 44th LPSC, Abs. #2414. The Woodlands, TX.McClanahan, T., J. The International Archives of the Photogrammetry, Remote Sensing and Spatial Information Sciences, Volume XLI-B4, 2016
San, P. Calhoun, O. Hsu, et al. 2012. Analysis and mitigation strategies for Lunar Reconnaissance Orbiter's Narrow Angle Camera high-frequency jitter. White Paper.
Nelson, D.M., S. D. Koeber, K. Daud, M. S. Robinson, et al. 2014. Mapping lunar maria extents and lobate scarps using LROC image products. 45th LPSC, Abs. #2861. The Woodlands, TX.
Oberbeck, V. R., F. Hörz, R. H. Morrison, W. L. Quaide, and D. E. Gault 1975. On the origin of lunar smooth plains, The Moon, 12, 19-54.
Robinson, M. S., S. M. Brylow, M. Tschimmel, et al. 2010. Lunar Reconnaissance Orbiter Camera (LROC) instrument overview. Space Sci Rev, 150, pp. 81-124.
Rosenburg, M. A., O. Aharonson, J. W. Head, M. A. Kreslavsky, et al. 2011. Global surface slopes and roughness of the Moon from the Lunar Orbiter Laser Altimeter. J Geophys Res, 116 (E2).
Speyerer, E. J., R. V. Wagner, M. S. Robinson, A. Licht, et al. 2014. Pre-flight and on-orbit geometric calibration of the Lunar Reconnaissance Orbiter Camera. Space Sci Rev, pp. 1-36. Vondrak, R., J. Keller, G. Chin, and J. Garvin. 2010. Lunar Reconnaissance Orbiter (LRO): observations for lunar exploration and science. Space Sci Rev, 150(1-4), pp. 7-22. Wagner, R. V., M. S. Robinson, E. J. Speyerer, and P. Mahanti. 2013. Topography of 20-km diameter craters on the moon. 44th LPSC, Abs. #2924. The Woodlands, TX.
Warmerdam, F. 2008. The Geospatial Data Abstraction Library. Open Source Approaches in Spatial Data Handling, Advances in Geographic Information Science, 2, pp. 87-104.
Zhang, B. 2006. Towards a higher level automation in softcopy photogrammetry: NGATE and LIDAR processing in SOCET SET. GeoCue Corporation 2nd Annual Technical Exchange Conference, p. 32. Nashville, TN.
Zhang, B., S. Miller, K. DeVenecia, and S. Walker. 2006. Automatic terrain extraction using multiple image pair and back matching. ASPRS 2006 Annual Conference, p. 12. Reno, NV. Zuber, M. T., D. E. Smith, R. S. Zellar, G. A. Neumann, et al. 2010. The Lunar Reconnaissance Orbiter laser ranging investigation. Space Sci Rev, 150(1-4), pp. 63-80.