Jurnal Administrasi Bisnis (JAB)|Vol. 53 No. 1 Desember 2017| administrasibisnis.studentjournal.ub.ac.id
58
ANALYSIS EFFECTIVENESS OF MOVING AVERAGE CONVERGENCE
DIVERGENCE (MACD) IN DETERMINING BUYING AND SELLING DECISION
OF STOCK
(Study on Bank Sub-Sector in the Indonesia Stock Exchange Period 2015-2016)
Devinta Anggin Putriningtiyas Mochammad Al Musadieq Faculty of Administrative Science
Univеrsitas Brawijaya
Malang
Email: [email protected]
АBSTRАK
Penelitian ini dilakukan dengan tujuan untuk mengetahui apakah ada perbedaan yang signifikan antara sinyal beli dan sinyal jual saham sebelum dan setelah menggunakan indikator MACD. Sehingga dapat dibuktikan keakuratan dari indikator MACD untuk menentukan keputusan membeli atau menjual saham. Dipilih sub-sector perbankan menjadi populasi untuk penelitian. Dengan menerapkan teknik purposive sampling, terpilih 9 perusahaan yang terdaftar sebagai sub-sector perbankan sebagai sampel. Teknik pengumpulan data dalam penelitian ini adalah teknik dokumentasi dengan jenis data berupa data sekunder. Data yang digunakan merupakan grafik pergerakan harga saham harian. Jenis penelitian ini adalah explanatory menggunakan pendekatan kuantitatif. Teknik analisis data yang digunakan adalah analisis komparatif harga saham sebelum dan setelah menggunakan indikator MACD. Menggunakan format standar indikator MACD yaitu EMA 26 - EMA 12 dan garis sinyal EMA 9. Dari penelitian ini didapat hasil tidak terdapap perbedaan yang signifikan antara sinyal beli dan jual saham sebelum dan sesudah menggunakan indikator MACD dengan nilai signifikan 0,908. Sehingga indikator MACD akurat dalam menentukan sinyal beli dan jual dalam perdangan saham.
Kаtа Kunci:Moving Average Convergence Divergence, Sinyal Beli, Sinyal Jual, Saham.
ABSTRACT
This study was conducted with the aim to know whether there is a significant difference between buy signal and indicator before and after using MACD indicator. So it can be proven accuracy of MACD indicator to determine the decision to buy or sell stocks. Banking sub-sector became population for research. By applying purposive sampling technique generated 9 companies in banking sub-sector as sample. Technique of collecting data in this research is documentation technique with data type in the form of secondary data. The data used is daily stock price movement chart. The type of this research is explanatory using quantitative approach. Data analysis technique used is comparative analysis of stock price before and after using MACD indicator. Using standard format of MACD indicator that is EMA 26 - EMA 12 and signal line EMA 9. From this research got result there is not significant difference between buy and sell signal stock before and after using MACD indicator with significant value 0,908. So that MACD indicator is accurate in determining buy and sell signals in stock trading.
Jurnal Administrasi Bisnis (JAB)|Vol. 53 No. 1 Desember 2017| administrasibisnis.studentjournal.ub.ac.id
59 INTRODUCTION
Investment related to the decision to allocate the funds held on time and certain assets with the purpose to obtain higher returns. Fabozzi & Drake (2009:7) defined investment management as the specialty area within finance dealing with the management of individual or institutions funds. According to Tandelilin (2010: 8) the purpose of investing is to get a better life in the future, reduce inflation, and the impetus to save taxes. Public can do investment through capital market.
Capital market is a means for those who lack in capital with those who have excess capital to meet and conduct the investment process. Husnan (2005:3) state that capital market is market for various long-term financial instruments be traded, either in the form of debt or own capital, whether issued by the government, public authorities, or private companies. In the Capital Market Act 8 of 1995, the definition of capital market is described in more detail as the activities concerned with the Public Offering and Trading of Securities, public companies relating to securities issued, along with institutions and professions related to securities. Capital market in Indonesia known as the Indonesia Stock Exchange. Products are sold in Indonesian Stock Exchange are long-term financial instruments. Long long-term refers to financial instruments with maturity more than one year and perpetual security or without maturity (Fabozzi and Drake, 2009:204). It includes stocks, bonds, warrants, right, mutual funds and other derivative. Stocks are proof letter of company ownership (Husnan, 2005: 3). Stocks are securities that have a number of applicants more than other securities. Based on the Capital Market Statistics Report released by Otoritas Jasa Keuangan (OJK) of 2014, total number of stocks issuer reached 62.5% and Bonds reached 37.5%.
Investing in stocks has two advantages that the investor will receive the capital gain when the stock price rises and receive dividend distribution when the company earned more profit. On the other hand, investing in stocks also brought the disadvantages if the issuer is not based on the right selection of the stocks. These losses can be a capital loss when stock price declines which in turn lowers the profits of investors. These losses experienced by investors who are less able to analyze the company and the stock price movement in the stock market time will be invested. However, these losses can be anticipated to predict stock price movements through proper analysis. Shareholders may obtain the maximum benefit by
understanding the fundamental and technical analysis in the stock selection.
Fundamental analysis takes various consideration factors, such as the performance of the company, business competition analysis, industry analysis, analysis of macro-economic and micro-markets. It is more complicated because need calculation to analysis the stock. For common people, technical analysis is easier to learn than fundamental analysis because it only needs to be able read charts. While Fundamental analysis requires at least knowledge about macro and micro economics (Wira,2014: 4). Technical analysis used historical data market and stock price movements to determine the trend which available in the form of charts that easier to be understand. Historical data in technical analysis can be used to analyze the demand in the future and to predict the stock price will be formed.
In conducting technical analysis, requires tools such as indicators to simplify the analysis process and help to make decision. The indicator is formed from price movement chart which consists of four components, namely opening price (Open), highest price (High), lowest price (Close), and Volume (V). It is useful to provide information about the trends, volumes, and so forth, including providing buy and sell signals. Many of the indicators contained in the technical analysis of stocks. The indicators are categorized as follows: indicators based on volume, the indicators to determine trends and indicators that are oscillators.
To support this research, the researcher use indicators that are Oscillator with the type of Moving Average Convergence Divergence (MACD).MACD was created by Professor Gerald Appel in the 1960s. Formed by assessing the correlation between two EMA (Exponential Moving Average) at different periods of time. MACD has two lines is the signal line and the MACD line. The signal line is usually red and counted in a span of 9 days as its standard. MACD line is difference of the two EMA (EMA 12 and EMA-26) which uses the closing price.
Jurnal Administrasi Bisnis (JAB)|Vol. 53 No. 1 Desember 2017| administrasibisnis.studentjournal.ub.ac.id
60 must be done to ensure accurate buy and sell
signals.
A study conducted by Astri (2016) stated that the buy and sell signals before and after the MACD is not significant. MACD format used is the standard format, with the MACD line EMA 26 - EMA 12 and EMA signal line 9. Obtain the results of buy and sell signals are accurate. In contrast to the results of research Benny (2010) which stated that the MACD is an indicator that rated slow (lagging) for indicating the signal.
The used MACD indicator to analyze because these indicators are very sensitive to income data and the indication can be read quickly. This contrasts with the results of research Benny (2010) which states MACD an indicator that rated slow (lagging) gives an indication but MACD is considered to provide an accurate indication where indications are given rarely wrong. There are still doubt about the accuracy and sensitivity of the MACD indicator on the buy and sell signals, encourage researcher to assess the accuracy.
Picture 1: Statistical Highlight of Market Capitalization by Industry 2015 Source : Indonesia Stock Exchange 2015
Annual Report
In this study, researcher used a stock of the financial sector, especially sub sector bank because it is very promising prospects. According to the 2015 Annual Report of Indonesia Stock Exchange, the amount of market capitalization for financial sector is 25.29%. Indonesia Stock Exchange Statistics Year 2015 recorded market capitalization total 1,232.308 billion. Total sub-sector of banks amounted to 1.1.32,972 billion. This number continues to grow in the next year. Based on Indonesia Stock Exchange 2016, market capitalization statistics for the financial sector amounted to 1,478.250 billion with a bank sub-sector of 1,339,854 billion of the total. This number shows the financial sector, especially the sub-sector of banks holding high amount and growing in market capitalization.
According to Crocket (1997) financial stability is closely related to the health of an
economy. The economic crisis in Asia at 1997-1998 reminded various institutions that the crisis in the financial sector, especially bank, could disrupt the activities of an economy as a whole.
Bank Indonesia continues to monitor and take various steps to maintain the bank health and financial system stability. By conducting more intensive surveillance on indicators that may affect financial stability. Capital market is one indicator that continues to be monitored. This is because the capital market is part of the financial system and a number of banks are listed in the market. From 2014 data by OJK, 41.07% value of emissions is controlled by the financial sector. To maintain financial stability required fund support from investors.
With the condition of the bank sub-sector which is growing and sensitive in economy issue, it is needed an indicator that can help new investors to determine when to buy and sell shares. This research is aimed to test the accuracy of MACD indicator for bank sub-sector. Based on the background that has been described, the researcher interested to examine more about the analysis of stock technical with the title of research "Analysis Effectiveness of Moving Average Convergence Divergence (MACD) Indicators in Determining Buying and Selling Decision of Stocks (Study on bank sub-sector in the Stock Exchange (2015- price movements, which gives a new trend signal or as a confirmation that the ongoing trend will be reversal. The stock price movement data is processed using a formula and displayed into a line on the chart. Moving Average can be used to know trends, reversal direction, and determine the level of support and resistance. However, it should be supported with sufficient trading volume.
Based on Ong (2016:277) Moving Average line divided into 3 types which are SMA (Simple Moving Average), WMA (Weighted Moving Average), EMA (Exponential Moving Average).
Moving Average Convergence Divergence (MACD)
Jurnal Administrasi Bisnis (JAB)|Vol. 53 No. 1 Desember 2017| administrasibisnis.studentjournal.ub.ac.id
61 period of time. The most common combination of
EMA periods is EMA-26 with EMA-12. This MACD technique changes the moving average that basically lagging indicator into a form of momentum oscillator (leading indicator). The oscillator chart is divided into two parts that do not have the lowest limit or the highest limit by the level line 0.
In MACD Indicator, there are 2 lines of signal line and MACD line. Signal line has a short period period, the recommended standard is 9 days. MACD line result of difference of EMA-26 and EMA-12 using closing price. The calculation results are presented in the histogram to facilitate the interpretation.
Buy Signal
A buy signal is a sign that indicates a time for an investor to buy or hold a stock. As described in MACD this signal appears when the MACD line intersects the signal line from the bottom to top in negative area (bellow zero). This condition must be supported by high trading volume confirm the situation (Wira,2014:9). Buy signal appear when the market is in an oversold situation. It is a situation where in the market occurred a lot of stock sales.
Sell Signal
Sell signal is a sign that investors do not buy or sell stock. As described in MACD this signal appears when the MACD line intersects the signal line from the top to bottom in positive area (above zero). Trading volume increases as the market falls (Wira, 2014:9). Sell signal appear when the market is in an overbought situation. It is a situation where in the market occurred a lot of stock buy.
Stock
Stocks are proof letter of company ownership (Husnan, 2005: 3). The amount of capital given in the company reflects a portion of the ownership of the company. Equity stocks is evidence of the individual or entity to the company by buying stocks which are then used as capital to finance production process.
The Relationship between Concept
MACD indicator consists of two lines namely the MACD line and the signal line. MACD is the result of the difference between EMA-12 and EMA-26 where the calculation has been described to be a chart. Consider in the charts that provide data on stock price movements. After that the graph
is made based on certain period and on the other side performs analysis of MACD indicator to determine buy and sell signal. The sell signal is obtained when the MACD is positive and the MACD line intersects the signal line from bottom to top. The sell signal is obtained when the MACD is negative and the MACD line intersects the signal line from top to bottom. Marks each intersection between the MACD line and the signal line by giving a vertical line indicating buy and sell signals. Then find the highest or lowest point closest to the vertical line as a buy and sell signal before using the MACD indicator on the chart. After the data recorded , do a test to find out the effectiveness of buy and sell signal using MACD indicator.
Conceptual Model
Conceptual model in this research as follows:
Picture 2 : Conceptual Model Source : Wira, 2014
Hypothesis Model
Picture 3 : Hypothesis Model
Jurnal Administrasi Bisnis (JAB)|Vol. 53 No. 1 Desember 2017| administrasibisnis.studentjournal.ub.ac.id
62 Based on the concept model that has
been created and developed, then formulation of the hypothesis is :
H0 : There is no significant difference between buy and sell signals before and after using the MACD indicator.
H1 : There is a significant difference between buy and sell signals before and after using the MACD indicator.
RESEARCH METHOD
The research type is explanatory research with quantitative approach. This research used explanatory to test the hypothesis of accuracy MACD indicators to determine buying and selling decision in the bank sub-sector. In this research, location conducted in official website of Indonesia Stock Exchange that is www.idx.co.id because provide accurate information about company that listed as bank sub-sector. Population of this research is companies in bank sub-sector that listed in Indonesia Stock Exchange period 2015-2016. This research was used nonprobability sample, specifically purposive sampling. Based on the criteria of the research sample that has been determined then obtained a sample of 9 banking companies with the period 2015-2016.
Data collection technique in this research was documentation technique which record of a events that has passed. The data required in this study were stock price fluctuations obtained through the application ChartNexus. Data analysis technique used Statistics descriptive test to find out buy and sell signals resulting from intersection of MACD line by looking at stock price chart in bank sub-sector period 2015-2016. This analysis should indicate mean, range, minimum, and maximum for these variable (Creswell, 2014:209). Normality test implemented to determine whether data used is normally distributed. In this research used kolmogorov smirnov test. It is the normality test used to test the two sample comparative hypotheses. If the data normaly distributed, use parametric statisticsto test parameters of population through statistics, or population size through two samples (Sugiyono, 2015:201). If the data is not normally distributed, then it is used non-parametric statistics. Alternative that can be used it wilcoxon signed rank test.
RESEARCH AND DISCUSSION Statistic Descriptive Test
Table 1 : Summary of descriptive statistical test result
Source : Data Processed, 2017
After the data is processed using SPSS 22 for Windows shows the maximum, minimum, and average value. In the table before MACD, minimum value is Rp 68, - occurred on 15th December 2015, maximum value is Rp 15.950 occurred on 4th October 2016 and the average value for stock price before MACD is Rp 5,417,-. In the table after MACD, minimum value is Rp 66, - occurred on 22th November 2016, maximum value is Rp 15,750, - occurred on 20th October 2016, and average value for the stock price after MACD is Rp 5,425.54.
Result Normality Test
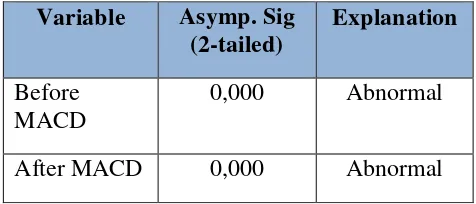
Table 2 : One- Sample Kolmogorov-Smirnov Test
Source : Data Processed, 2017
Based on SPSS 22 for windows test using One Sample Kolmogorov Smirnov Test to determine whether the data is normally distributed yields a significance value before MACD and After MACD within 0.000. Signification value 0.000 is less than 0.05 or 0,000 (p <0.05). So the data is abnormally distributed (abnormal). Because of this result, parametric statistics with paired sample t-test can not be performed.
Jurnal Administrasi Bisnis (JAB)|Vol. 53 No. 1 Desember 2017| administrasibisnis.studentjournal.ub.ac.id
63 Result of Hypothesis Test
Based on previous explanation if the data is not normally distributed then performed non parametric statistical test here is wilcoxon signed rank test to test the hypothesis. Hypothesis of this research, here are :
H0 :There is no significant difference between buying and selling signals before using MACD indicators with buy and sell signals after using the MACD indicator. H1 :There is significant difference between
buying and selling signals before using MACD indicators with buy and sell signals after using the MACD indicator. Basic criteria for decision making using wilcoxon signed rank test as follows :
1) Probability (Asymp.Sig) < 0,05 ,H0 is rejected and H1 accepted.
2) Probability (Asymp.Sig) > 0.05 ,H0 is accepted and H1 is rejected.
Table 3 : Result of Wilcoxon Signed Rank Test
Source : Data Processed, 2017
Based on SPSS 22 for windows test using Wilcoxon Signed Rank Test to test the hypothesis yields a result p- value (Asymp.Sig 2-tailed) within 0,908. This result shows that signification value 0,908 is more than 0,05. Based on the above criteria if the significance value is more than 0.05 then H0 is accepted and H1 is rejected. With the result of Wilcoxon Signed Rank Test decided that there is no significant difference between buy signal and sell signal before using MACD indicator and buy and sell signal after using MACD indicator.
Research Explanation
Investment is activity related to the decision to allocate the funds held on time and certain assets with the purpose to obtain higher returns. People doing investment in capital market. Product that offered in capital market is long-term financial instrument. Stock is one of long-term financial instrument which has largest applicant. Investment in stock give advantages namely capital gain and dividen distribution. Behind that, investment in stock also bring disadvantages if investor is not basically understand about selecting right stock. There are two analysis that can be consideration for investor to avoid disadvantages in stock investment here are fundamental analysis and Technical analysis.
In this research discussed about technical analysis. Based on Ong (2016:1) technical analysis is a method of evaluating stocks, commodities, or other
securities by analyzing the statistics generated by past market activity in order to predict future price movements. Conducting technical analysis need tools such as indicators to simplify the analysis process and help to make decision. The indicators are divided into categorized as follows: indicators based on volume, the indicators to determine trends and indicators that are oscillators.
In this research focused about indicator that are oscillator which is indicator Moving Average Convergence Divergence (MACD). MACD used as an indicator of a buy signal and sell signal of stock. This research aims to prove whether the MACD indicator is effective in predicting buy and sell signal shares. By doing research on bank sub-sector stocks period 2015-2016 by using standard formulation of indicator MACD which is MACD line EMA 26 - EMA 12 and EMA signal line 9.
After analyzing the data and hypothesis testing using program SPSS 22 for Windows , there is no significant difference between buy and sell signal before using MACD indicator with buy and sell signal after using MACD indicator. There is a difference day occured between buy and sell signals before with after using the MACD indicator. However, the resulting price difference between the MACD indicator with the lowest / highest point being the price before using the MACD indicator does not differ significantly. At the minimum price before MACD produces a value of Rp 68, - which is not far away with the value after using the MACD indicator is Rp 66, -. Similarly, the maximum price before using the MACD indicator yields a value of Rp 15,950, - which is not much different from after using the MACD indicator that is Rp 15.750, -. This means that MACD indicator is effective in predicting buy and sell signals in bank sub-sector stocks in Indonesia Stock Exchange period 2015-2016.
CONCLUSION AND RECOMMENDATION Conclusion
The objective of this research was to test effectiveness of indicator Moving Average Convergence and Divergence in determining Buying and Selling Signal on stock. Based on the result of analysis, the conclusions of this research are as follows:
1) There are total of 171 buy and sell signals generated using MACD indicator compared with the lowest and highest points during the period 2015-2016 on 9 sub-bank stocks. 2) There is difference day occurred between buy
Jurnal Administrasi Bisnis (JAB)|Vol. 53 No. 1 Desember 2017| administrasibisnis.studentjournal.ub.ac.id
64 3) Testing hypothesis with signification level =
5% generate buy and sell signal obtained from indicator MACD is effective by yield signification value more than 0,05 that is p- value ( Asymp. Sig. 2-tailed) within 0,908. From explanation above can be concluded that MACD indicator is effectively used in determining buy signals and sell signals in stock trading of the bank sub-sector on the Indonesia Stock Exchange period 2015-2016.
Recommendation
Based on the conclusion, the researcher gives recommendations as follows:
1. For New Investor
1) In the beginning of investing should choose stocks with active stock movement, has a stable trading volume, the movement of its shares experienced uptrend and downtrend. Should consider history stock movements in previous year as a determination of whether the stock is actively sustainable.
2) Short-term investments should use a shorter EMA period to approach a more sensitive value of effectiveness.
3) Long-term investment should use longer EMA period adjusted to the market conditions in the longer term.
4) New investors should do a holding period until the right time. Buy stocks up to large supply and demand volumes and choose stock prices at the lowest point. Sell stocks until price changes increase at the highest point.
2. For Further Researcher
1) It is advisable to add a sample of research to reflect the overall population.
2) This research uses standard format of MACD that is MACD line EMA 26 - EMA 12 and EMA signal line 9. It is suggested to further researcher to use EMA period which is adjusted to the requirement of investment term to produce a more sensitive signal to
price movement as needed with investment time.
3) It is expected that further research can add another indicator in comparison with MACD indicators to analyze stocks technically. Such as Relative Strength Index (RSI) is used to calculate the comparison between the attractiveness and price increase. RSI can know whether a price is overbought or oversold.
REFERENCES
Crockett, Andrew. (1997). Why is Financial Stability a Goal of Public Policy, in Maintaining Financial Stability in A Global Economy, a Symposium Sponsored by The Federal Reserve Bank of Kansas City, Jackson Hole, Wyoming.
Fabozzi, F.J., and P.P Drake.2009. Finance : Capital Market, Financial Management, and Investment Management. New Jersey: John Wiley & Sons,Inc.
Husnan, Suad. 2005. Dasar-Dasar Teori Portofolio dan Analisis Sekuritas. Edisi :4. Yogyakarta : BPFE.
Ong, Edianto. 2016. Technical Analysis for Mega Profit. Edisi : 6. Jakarta :Gramedia.
Sugiyono. 2009. Metode Penelitian Bisnis. Edisi 13. Bandung : Alfabeta.
Tandelilin, Eduardu. 2010. Portofolio dan Investasi Teori dan Aplikasi. Edisi pertama.Yogyakarta : Kanisius.
Wira, Desmond. 2014. Analisis Teknikal untuk Profit Maksimal. Edisi 1. Jakarta : Exceed.
Journals
Asthri, Dian Dwi Parama.2016.Analisis Teknikal Dengan Indikator Moving Average Convergence Divergence Untuk Menentukan Sinyal Membeli dan Menjual Dalam Perdagangan Saham. Fakultas Ilmu
Jurnal Administrasi Bisnis (JAB)|Vol. 53 No. 1 Desember 2017| administrasibisnis.studentjournal.ub.ac.id
65 Websites.
Creswell, J.W. 2014. Research Design:
Qualitative, Quantitative, and Mixed Methods Approaches. 4th Ed. United States of America: Sage Publication, Inc., accessed on 30 Juli at 14.00, 2017 from
https://books.google.co.id/ .
Indonesia Stock Exchange 2014 Annual Report, accessed on 13th August 2017 at 13.20 from www.idx.co.id .
Indonesia Stock Exchange 2015 Annual Report, accessed on 13th August 2017 at 13.43 from www.idx.co.id.
RI Law Number 8 Year 1995. RI Law Number 8 Year 1995, The Capital Market, accessed on 15th July 2017 from