9
THE EFFECT OF APPLYING THE ECONOMIC
ORDER QUANTITY MODEL IN THE FIELD OF
INVENTORY
Dr. Abdul Wahid A.Fadlallh
Prince Sattam Bin Abdul-Aziz University, collage of science, Department of Business Administration, KSA
ABSTRACT
Research conducted to identify the effect of applying the economic order quantity (EOQ) model as a scientific method in the field of inventory. Research determined the relation, association and effect of applying the economic order quantity model in the field of inventory, in the factory of Asalaya (White Nile State – SUDAN).
Research applied (T) Test and examined that there is a moral difference between the average annual costs (M2) by following the traditional method and the average annual costs (M1) by following the economic order quantity model as a scientific method in the field of inventory.
The research concluded that using and applying the economic order quantity model as a scientific method has always an effect in the field of inventory.
Keywords: Inventory, Economic order quantity, Scientific method, Traditional method, Sugar cane, Asalaya
INTRODUCTION
Stocks are expensive, because of the costs of tied-up capital, warehousing, protection, deterioration, loss, insurance, packaging, administration, and so on. An obvious question, then is,’ Why do organizations hold stock? ’ There are several answers to this, all based on the need for a buffer, or cushion, between supply and demand.
Inventory is considered as one of the biggest financial investments in many commercial and industrial establishments. Therefore, it is given good care by many companies, to ensure that it has been used as efficiently as possible and in conformity with ISSN 0976-6502 (Print)
ISSN 0976-6510 (Online)
Volume 6, Issue 4, April (2015), pp. 09-18
© IAEME: http://www.iaeme.com/IJM.asp
Journal Impact Factor (2015): 7.9270 (Calculated by GISI) www.jifactor.com
IJM
10
the objectives and policies of the administration. There are numerous administrative decisions, concerning this stock. How to determine the types to be purchased, the optimum size of the inventory order, and the best time to request or purchase….etc
RESEARCH QUESTIONS
This study explores the answer to the following major research question (MRQ): Does the application of the economic order quantity (EOQ) model as a scientific method has statistically significant effect in the field of inventory.
OBJECTIVES
The main purpose of the study was to identify the effect of applying the economic order quantity (EOQ) model as a scientific method in the field of inventory. In order to ensure that the inventory has been used as efficiently as possible and in conformity with the objectives and policies of the administration. The following specific objectives were considered:
1. Determining the economic optimal quantity that will be requested. According to the traditional method used in the factory in order to compare it to what is determined by following the scientific model.
2. Determining the optimal number of purchase orders according to the traditional method used in the factory in order to compare it to what is determined by following the scientific model.
3. Determining the average annual costs (M2) by following the traditional method and the average annual costs (M1) by following the scientific model.
4. To study about the efficiency of scientific methods and tools that have been used in the factory of Asalaya sugar cane.
Hypothesis
There is a moral difference between the average annual costs by following the traditional method (M2) and the average annual costs by following the scientific method (M1).
Definition of terms
All organizations hold stocks. These are the stores of materials they keep until needed.
▪ Stock consists of all the goods and materials that are stored by an organization. It is a store of items that is kept for future use.
▪ An inventory is a list of the items held in stock.
▪ An item is a distinct product that is kept in stock: it is one entry in the inventory. ▪ A unit is the standard size or quantity of an item.
▪ Inventory management is the function responsible for all decisions about stock in an organization. It makes decisions for policies, activities, and procedures to make sure the right amount of each item is held in stock at any time.
Types of inventory
● Raw material – Basic inputs that are converted into finished product through the manufacturing process.
11
● Finished goods – completely manufactured products ready for sale.
● Supplies – Office and plant cleaning materials that do not directly enter production but are necessary for production process and do not involve significant investments.
Inventory control techniques
The most commonly used techniques are : • EOQ model (Economic order quantity)
- It is also known as standard order quantity, optimum quantity or economic lot size. - By definition economic order quantity that size of order for which the total cost is
minimum.
Computation of EOQ:
The widely used formula is
= √ {2 / ℎ}
Where,
R = Annual quantity to be used in units. Cp = Cost of placing an order.
Ch = cost of holding one unit for one year.
• Re – ordering level.
- It is the point at which if stock of the material in store approaches, the store keeper should initiate the purchase requisition for fresh supply of material.
- This level is fixed somewhere between maximum and minimum level.
• ABC Analysis
- Always better control.
- Also known as PVA (And sim techniques (Selective inventory control)
- Divides inventory into three categories – A, B and C ……. On the basis of their annual consumption value ……….! ! !
- Objective = is to vary expenses associated with maintaining appropriate control. - This idea has drawn from vilfredo Pareto, an Italian economist.
- it categorizes the inventory into a,b,c classes acc to the potential amount to be control. - After classifying, the firm decide where to put efforts, mainly strong control on a items.
Moderate control on B items loose control on cities.
• High medium low (HML)
- The HML classification is same procedure as adopted in ABC.
- The core difference is HML classification unit value is the criterion and not the annual consumption value.
- The inventories should be place in descending order and it is up to mgmt to fix limits of these three categories.
- Example: the mgmt may decide all units with unit value of Rs 2,000 and above will be H items.
•Vital essential desirable
- They are done to determine the criticality of an item and its effect on production and other services.
12
- If the part is vital most it is given ‘ V ’ , if it is essential then is given as ‘ E ’ ,If it is not so essential it is given as ‘ D’ .
- For ‘V’ items large stocks are maintained while for ‘ E ’ items minimum stock is enough.
•SDE classification
- SDE is based upon the availability of items. - Here ‘S’ refers to ‘scarce’ items.
- ‘ D’ refers to ‘ Difficult ’ items. - ‘ E’ refers to ‘ Easy to acquire ’
- This is based on problems faced in procurement, were some strategies are made on purchasing.
•FSN analysis
- The abbreviation for FSN in “Fast moving, Slow moving and Non moving”
- Here is this analysis, the date of receipt or the last date of issue, whichever is later, to determine the no. of months which have lapsed from last transaction.
- FSN is helpful in identifying active items which need to be reviewed regularly and surplus items and non-moving items are examined.
•SOS analysis
- ‘S’ stands for seasonal items and ‘ OS’ – off seasonal items.
- In general it is merit to seller to buy seasonal items at lower price and keep inventory and sell them at high price during off seasons.
- If not the seller has to buy the goods at higher prices during off season. - Decisions are taken based on the fluctuations and availability.
•XYZ analysis
- This classification is based on the value of inventory of materials actually held in store at given time.
- This helps to control the average inventory model value.
- ‘X’ items which are 10% of no. of items stored, but accounting for 70% of the total inventory value.
- ‘ Y’ items are 20% of no. of items stored and account for 10%of the total value. - ‘ Z ’ items are 70% of no. of items stored and account for 10% of the total value. - This analysis focuses on efforts to reduce the inventory of these items.
•GOLF analysis
- This stands for Govt,Open mkt, local or foreign source of supply. - For certain items, imports are canalized through govt agencies
Methods of valuation
An inventory valuation allows a company to provide a monetary value for items that make up its inventory.
Methods
13
FIFO method
● Based on the assumption that the goods that are received first are issued first.
● For purpose of assigning costs and not exactly for purpose of physical flow of goods. ● Goods sold, thus, consist of earliest lots and are valued at the price paid for such lots. ● Balance sheet shows ending inventory costed as perapprox market price.
LIFO method
● Based on the assumption that the goods that are received last are issued first.
● Assumption made for purpose of assigning costs and not for actual physical flow of goods.
● Flows of goods and costs may not coincide.
● goods sold, thus, consist of the latest lots and are valued at the price paid for such lots. ● The ending inventory consists of the earliest lots and is valued as such.
● Balance sheet has an inventory costed at old prices.
Weighted average price method
● Based on the assumption that each issue of goods consists of a due propotion of the earlier lots and is valued at weighted average price.
● Weighted average price is calculated by dividing the total cost of goods in stock by the total quantity of goods in stock.
● This weighted price is used for pricing the issues until a new lot is received when a new weighted average price would be calculated.
● This method evens out the effect of widely varying prices of different lots that make up lots
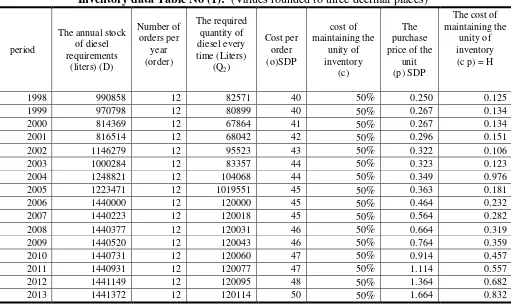
■The below table No (1): Shows the data on inventory of diesel as sample of the study over the extended time series from (1998 until the year 2013):
(The diesel is used as fuel in the plant of Asalaya sugar cane factory- White Nile State - SUDAN):
■ Estimation of the economic optimal quantity (EOQ) and total costs according to the records from the factory: Used to that end the following equations:
Q1 = (2*D*O/H)½ ... (1) Q1 ≡ Economic order quantity D ≡ The annual total requirements
H ≡ The cost of maintaining the unity of repository (It is calculated as a percentage 50% Of the purchase price of the unit)
N1 = D/Q1...(2)
N1 ≡ The optimal number of purchase orders C1= D*O/Q1 + H*Q1/2...(3)
C2= D*O/Q2 + H*Q2/2 ...(4) Q2 ≡ The actual quantity
14
Inventory data Table No (1): (Values rounded to three decimal places)
period
Source: Asalaya sugar cane factory 2015
Table No (2): The optimal quantities, number of orders, actual and optimal costs: (Values rounded to three decimal places)
Total actual
15
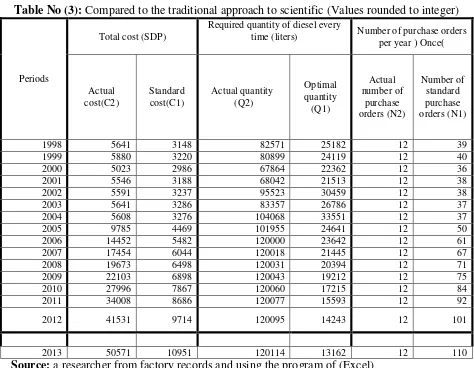
Table No (3): Compared to the traditional approach to scientific (Values rounded to integer)
Periods
Total cost (SDP)
Required quantity of diesel every
time (liters) Number of purchase orders
per year )Once(
Source: a researcher from factory records and using the program of (Excel)
Statistical analysis for the data of the study
The researcher has used a (T) test for paired samples to test the hypothesis as follows: 1. Selecting the study period (1998 – 2013).
2. Secondary data collection from records and books – by the company for the period selected.
3. Use the inventory equations for estimating: the optimal quantity, the optimal number of purchase orders, total optimal costs and total actual costs.
4. Statistical hypotheses were formulated as follows:
H0: M2- M1 = 0 denotes a null hypothesis which means there is no statistically significant difference between the medium-standard costs (M1) and the actual costs (M2).
H1: M2- M1>0 the alternative hypothesis to the null hypothesis. It implies that there is statistically significant difference between the medium-standard costs (M1) and the actual costs (M2).
M2: Average annual costs by following the traditional method.
16 M2 = 1M which means: M2- M1 = 0
The alternative hypothesis H1 means that: there is statistically significant difference between the two mediums that:
The arithmetic mean of the actual cost is greater than the arithmetic mean of the standard costs so:
M2 ≠ M1 M2 > M1
Taking down the actual and standard cost data from the previous table and applying the statistical program (SPSS), we can note the following two tables:
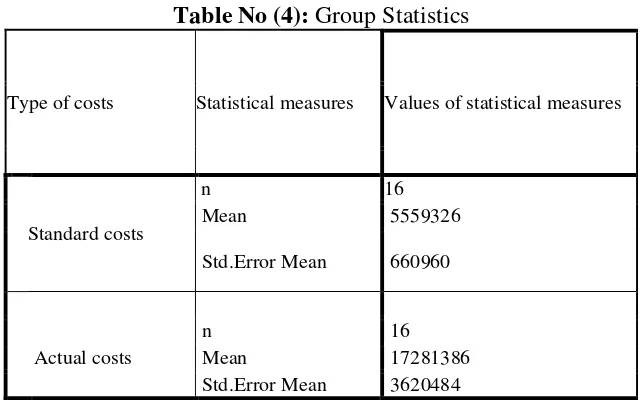
Table No (4): Group Statistics
Type of costs Statistical measures Values of statistical measures
Standard costs
n 16
Mean 5559326
Std.Error Mean 660960
Actual costs
n 16
Mean 17281386
Std.Error Mean 3620484
Source: A researcher using statistical software (SPSS)
Table No (5): t-test for Equality of Means
Source: A researcher using statistical software (SPSS)
Table No (4) shows the following:
1. Number of years (1998 – 2013) = 16 ≡ 1. n
2. The arithmetic mean of the annual standard costs (M1) = 5559326 SDP with standard error (SE) amounted to 660960
3. The arithmetic mean of the actual annual costs (M2) = 17281386 SDP with standard error (SE) amounted to 3620484
4. Seen from the comparison between the two values of the arithmetic means. There is a clear difference between the standard and actual costs.
T Df Sig. (2-tailed) Mean Difference
Std. Error Difference
Equal variances
17
For the schedule of (T) test No (5): It indicates the following:
1. The first column represents the statistical analysis which is based on the assumption of equal differential societal, the standard and actual costs values in the years of the study.
2. The second column shows the value of the test, calculated counted. (t =-3. 185) is a negative signal for the difference between the two means is a negative value as the average standard cost is smaller than the actual average costs.
3. Degrees of freedom (df = 30) is a total data per sample minus 2 (30 = 2- 16 +16 = n1 + n2=df ).)
4. The fourth column means that the value of the calculated moral level (for a test of breedings) equal to = 0.003
5. The fifth column gives the value of the arithmetic mean of all the mathematical community differences between standard and actual costs for all years of study valuing - 11722060 it is the same value which can be obtained by subtracting the actual average costs of the average standard costs namely : ( -11722060 = 17281386-5559326)
6. The last column represents the standard error of the difference between the average total value 3680322
When we make comparison between the value of the actual level of moral which is equaling .003 and the value of moral level (allowable error) that reflects the indexed value of the test, which counted the value (α = 0.05), we find that the calculated value is smaller than the indexed value.
Which means that the calculated value is in the rejected area of the null hypothesis and accept the alternative hypothesis which decides that there is a moral difference between the two arithmetic means. The actual arithmetic mean is greater than the standard arithmetic mean. Which means accepting the hypothesis of the study which states that: There is a moral difference between the average annual costs by following the traditional methods (M2) and the average annual costs by following the scientific methods (M1) in the field of inventory.
CONCLUSION
The following conclusions were drawn in the light of finding of the study:
- Research concluded that there is a moral difference between the average annual costs (M2) by following the traditional method and the average annual costs (M1) by following the economic order quantity model.
- The research concluded that using and applying the economic order quantity model as a scientific method has always an effect in the field of inventory.
RECOMMENDATIONS
- Research recommends that organizations should realize the necessity need for applying inventory control techniques.
- Research recommends that stores ledger, stores control, cards or bin cards should be properly maintained.
- Research recommends the use and application of scientific methods and tools in the field of inventory.
18
REFERENCES
1. Donald Waters-John Wiley & sons Ltd: (Inventory control and management), England, 2003
2. Stuart, F.Heinritz: Purchasing principles and application 3. Srinath Ramakrishn: Inventory control techniques
4. ShaliniCathrine Panna, RajnikantGeorige, SitakantaBehera, Ajay Kongari, Mahendra Prasad- Inventory control
5. Richard, J.Jersine: principles of inventory and materials management: New York. 6. Pratik Tamgadge: Inventory management system, 2012.
7. Sneha, Atul& Ajay K Raina: Inventory management.