CHAPTER III
RESEARCH METHODOLOGY
3.1Subjects of Study
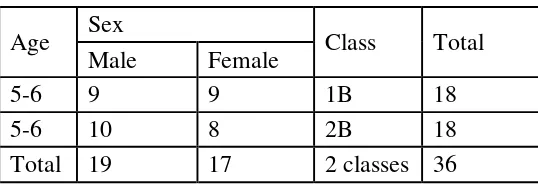
In this research, the subjects of study was all the students of TK
Gethsemane consist of 2 (two) classes and their parents in academic year of
2015/2016. There were 36 students in both classes with 36 pairs of parents.
Table 3.1
Subjects of Study
No. Class Number of Students Number of Parents
1. IB 18 18
2. 2B 18 18
The participants were the children whose social backgrounds were
observed. They were from a kindergarten school in Medan named TK
Gethsemane. The school was chosen randomly. This research used random
sampling in order to minimize the effect of bias on the selection of speakers.
According to Tagliamonte (2001: 18), originally, sociolinguists based their
methodology on sociological methods, attempting to achieve
‘representativeness’ in their data collection practices by constructing a random
sample of their targeted group. But a strict sampling criterion must be
maintained: (1) each person in the total subjects of study sampled must have
2001); (2) anyone within the sample frame has an equal chance of being
selected. (Milroy and Gordon in Tagliamonte, 2001).
Based on Piaget’s theory, in their ages (6-7), they are almost in
concrete operation. This stage is the beginning of verbal understanding, and
the understanding is related to concrete objects. On this background the tests
were designed mostly about their vocabularies of concrete objects.
3.2Research Variables
In this research, there were two variables analyzed, independent
and dependent variables, namely:
1. Independent variables (X)
Independent variable of this research was the social factors which
consist of:
a. Parents’ Economic Level
b. Parents ‘Education Level
c. Environment
d. Parents’ Occupation
2. Dependent Variable (Y)
The dependent variable of this research was the achievement of
The relationship between social factors and the children’s achievement of
acquiring second language can be seen as follows:
Independent Variables (X)
Dependent Variables (Y)
3.3Research Method
The purpose of this study is to explore how social factors affect the
children’s achievement in second language. It used social approaches to
second language acquisition. These approaches are broadly understood to
include any approach that incorporates social factors in its account of
linguistic knowledge and language acquisition. Nevertheless, the term “social
approaches” is to denote those approaches that place social elements of
language learning and language use at the forefront and prioritize the
examination of the influence of social context on language. Geeslin and Yim
Long (2014:79) state that it is important to point out that the range of social
theories included is quite broad and these theories are not necessarily limited Parents’ Economic
Level Parents’ Education
Level Environment
Parents’ Occupation
in scope to the acquisition of sociolinguistic competence or of sociolinguistic
variation.
This research engaged both quantitative and qualitative research.
Since this research is multivariable, quantitative analysis is needed to describe
the data with the aid of numerical data, while quantitative analysis attempts to
‘quantify’ results based on numbers. This research used a survey as part of its
quantitative measure and an interview and observation method to gather
generalized information qualitatively. Generally, the method used in this study
is mixed method, joining quantitative and qualitative method. According to
Creswell and Plano Clark (2007: 5), mixed methods research is a research
design with philosophical assumptions as well as methods of inquiry. As a
methodology, it involves philosophical assumptions that guide the direction of
the collection and analysis of data and the mixture of qualitative and
quantitative data in a single study or series of studies. Its central premise is
that the use of quantitative and qualitative approaches in combination provides
a better understanding of research problems that either approach alone.
3.4Instrument and Data Collection Procedure
The data were collected through survey, observation, and
interview. The social backgrounds of the student were surveyed and observed
during a period of time in their second semester in kindergarten of 2016.
Some instruments were made in this research. The survey
and teaching (in Thorton, 2009) will be modified and used to collect data for
this study. Some survey questionnaires were modified for students’
parents. The writer decides to use a survey, in order to gather data relatively
efficiently from a large number of students and their parents. Besides, the
purpose of using this modified survey is to allow responses to have more
impact, as opposed to a survey with a neutral response position, and allow
respondents a chance to write- in something that they may deem important
that was not mentioned in the survey (Thorton, 2009)
The data, required for this paper, were also collected through
observation and interview of the students, teacher, and parents in the
classroom, house, or playground. Observation is needed to see how their
environments affect their learning activity.
3.5 Data Analysis Procedures
3.5.1 Descriptive Percentage (Descriptive Statistics)
Descriptive statistics was used to provide descriptive or a brief
discussion in this study. The steps taken in using this analytical
technique are:
a. Making the distribution table of answers of the questionnaire X and
Y;
b. Determining the scores of respondents based on the provisions score
c. Summing the score answers obtained from each respondent.
d. According to Ali (in Maftukhah, 2007:47) , the next step is to
decisive the score into this formula:
= 100%
DP = Descriptive Percentage
n = Obtained Score
N = Expected Score
Data which were obtained through a questionnaire (as the
main method) were analyzed with the following steps:
3 Classifying data according to its type.
4 Creating data tabulation.
5 The tabulated data were analyzed using analysis simple regression
to determine how much the influence social conditions/factors to the
student achievement.
To simplify the analysis of the data, which were derived
from the questionnaire, it was needed to make the score of each
question in the questionnaire (Arikunto in Maftukhah, 2007:48). It was
Table 3.2
variables. It is to see the strength of correlation. It is not to see the strength
of influence.
3.5.3 Simple Regression Analysis
This method is used to calculate the extent of influence
between social conditions of parents on student achievement. The steps
undertaken to analyze was as follows:
a. Looking at regression line.
Technique that was used in linear regression analysis of the variables,
was the following equation:
Y = a + bX
Y: the dependent variable (achievement)
a: constanta
b: regression coefficient X
3.6 Validity and Reliability Test
Validity is the extent to which a concept, conclusion or
measurement is well-founded and corresponds accurately to the real world.
The word "valid" is derived from the Latin validus, meaning strong. The
validity of a measurement tool is considered to be the degree to which the
tool measures what it claims to measure; in this case, the validity is an
equivalent to accuracy. According to Situmorang and Muslich (2014: 86), for
a descriptive study that requires data or fact and usually simply uses
questionnaires, validity which is often used is a surface validity. If the
respondents can understand all the questions in the questionnaire without
ambiguity, it is already said to be a valid questionnaires.
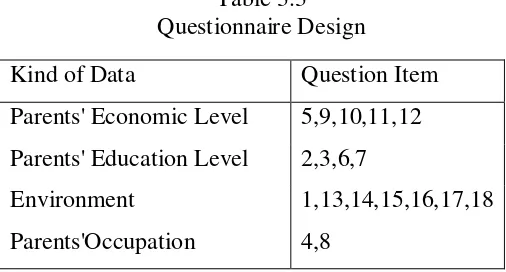
The writer used a questionnaire comprising 18 items of
questions, consists of 5 items for Parents' economic levels, 4 items for
parents' education levels, 7 items for environments, and two items for
parents’ occupation. The design of questionnaire can be seen below:
Table 3.3 Questionnaire Design
Kind of Data Question Item
Parents' Economic Level 5,9,10,11,12
Parents' Education Level 2,3,6,7
Environment 1,13,14,15,16,17,18
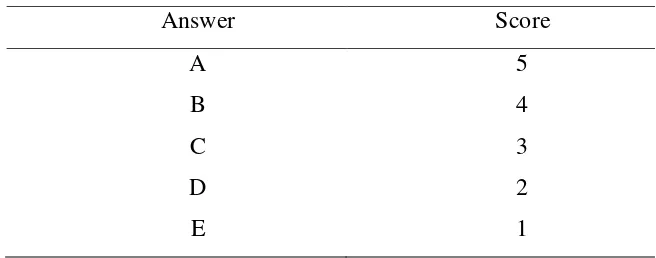
16 items were provided with 5 answer intervals. The highest
score was 5 and the lowest was 1. For 2 confirmative questions, the interval
was 2, with the highest score was 1 and the smallest score was 0. Validity test
of the instrument was addressed to 36 parents. The score for the questionnaire
can be seen as follows:
Table 3.4
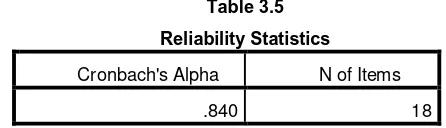
Reliability test result using SPSS is as follows:
Reliability testing in this study shows the value of Cronbach's
Alpha is 0884. A construct or variable is said to be reliable if the value of
Cronbach's Alpha> 0.80 (Situmorang and Muslich, 2014: 98). Based on this,
it is concluded that all items of questionnaire are reliable.
3.7 Hypothesis
The hypothesis of this research was there is a strong relationship
between social factors and children’s achievement of SLA. Parents’ economic
level was the most dominant factor influencing the achievement of children in
SLA.
Table 3.5
Reliability Statistics
Cronbach's Alpha N of Items
CHAPTER IV
DATA ANALYSIS
4.1 Description of The Variables
The data for this research were obtained through a 20 (twenty) items
test for students and an 18 (eighteen) item questionnaire for their parents.
The data obtained, then, were analyzed and tested by using statistics
method. All available data were processed by SPSS 17.0 for descriptive,
correlation, ANOVA, and predictive analysis.
In this research, two kinds if variables were analyzed: the dependent
variable and the independent variables. The dependent variable is the
children’s achievement of second language, in this case, English language;
and the independent variables are:
A. Parents’ Economic Level
B. Parents’ Education Level
C. Environment
D. Parents’ Occupation
4.1.1. Description of Students
The test was administrated to 36 students. The 36 students
were the students of TK Gethsemane Medan. The table below shows
Table 4.1
Data on students’ English language achievement was gathered
through a test-taking on their vocabulary totaling 20 items. The test
and the materials were adjusted to the curriculum the students have
learned. For this reason, the writer had made some interview with the
teacher. From the test conducted, thus obtained the data in the form of
number (see appendix 4).
Based on the test, there are 4 students who got A; 8 (eight)
students got B; 9 (nine) students got C; 11 (eleven) students got D; and
4 (four) students got E. The distribution of the students’ scores is
shown below:
Table 4.2
Description of Students’ Scores
Criteria Interval Frequency Percentage
From the test conducted by the writer, the highest score is 95
and the lowest score is 55 as can be seen in the appendix 4. And from
the table above, only 11.1 % of students got score of 90-100.
The most dominant score is D (60-69) or about 30,6 percent of
the whole students. The second dominant score is C (70-79). Score B (
80-89) is the third place. Score A and score E has same proportion,
only 11.1 %t. To see the average score, which then can show the
average students’ achievement or competence of English language in
general, it is needed to count the mean value. The mean value of the
students’ scores is 71,7. It means, in general, their English grade is
good enough (C).
4.1.2. Description of Parents
Independent variables of the research are the social factors of
the students, namely parents’ economic level, parents’ education level,
environment and parents’ occupation.
Data on social conditions of parents were obtained from the
results of a questionnaire given to parents. The data were processed so
that the data were obtained in the form of number or value, as can be
4.1.2.1. Parents’ Economic Level
After knowing the highest value and the lowest value of
the economic level of parents, it was 29 as the highest value
and the lowest value was 13, the next step was to find the
interval of these values. The formula used was: R = H - L + 1.
R = H-L+1
= 29-13+1
= 17
The following formula was used to find the interval:
i=
i=
= 6
Explanation:
R= Range
i=interval
Table 4.4
Economic Level
Criteria Interval Frequency Persentage
High
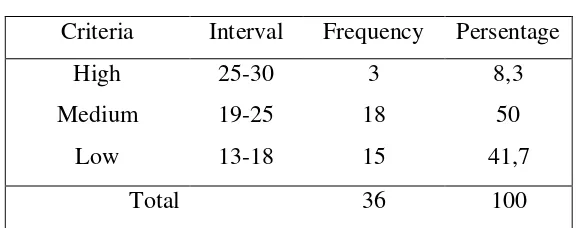
From the table above, economic level was described as follows:
a. High category was 3 students or 8,3 %
b. Medium category was 18 students or 50%
c. Low category was 15 students or 41,7%
The above data shows that the most dominant
economic level of parents of TK Gethsemane is classified to the
second criteria, namely 50% of the students are from the
medium-income families. Economic level of the parents of
students can be of income, ownership of property or facilities
and environmental conditions. The expected highest value of
the questionnaire is 30 that there was no one of the students’
4.1.2.2.Parents’ Education Level
The same formula was used to find the data interval
value of parents’ education level. The highest value was 12 and
the lowest is 4. So it was obtained:
R = H-L+1
Criteria Interval Frequency Percentage
High
The highest value expected was 12. From the table
above it can be seen that the educational level of parents of TK
research about 50%. While 38, 9 % are the middle category, and
2,8% in the category of low. This means that as many as 50% of
parents of students enrolled in higher formal education
(university level), 38,9 % in senior high school, 2,8% in the
junior high school and elementary school.
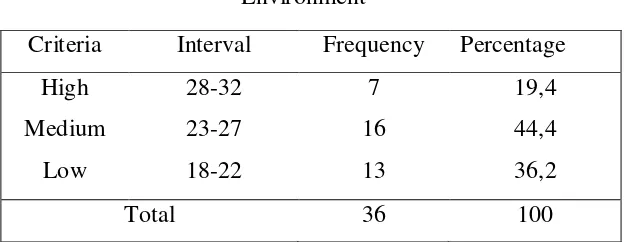
4.1.2.3. Environment
Data related to environment was taken in terms of
the condition of parents’ marital status, home stay, the number
of people who live together, and education dominant
neighborhood residents, long-playing at home and with whom
children spend the most time. From some of the variables
above, the following data were obtained:
Table 4.6
Environment
Criteria Interval Frequency Percentage
High
A total of 19,4% of children live in an environment
that is conducive. A total of 44,2% live in an adequate
environment; and 36,2% live in an environment that is not
approximately 90% of children living in congested residential
area.
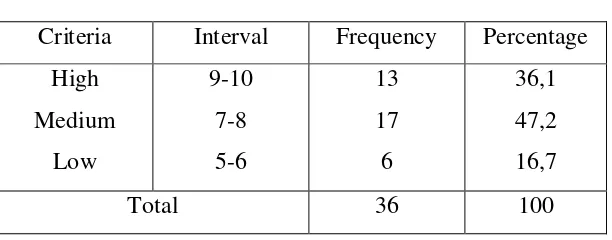
4.1.2.4.Parents’ Occupation
Tabel 4.7
Parents’ Occupation
Criteria Interval Frequency Percentage
High
found in the low category were farm workers and construction
workers. A total of 36,1% of respondents are included into the
high category which most of them are lawyers, entrepreneurs,
4.2. The Correlation between Social Factors and Children’s
Achievement of Acquiring Second Language
One of the methods of data analysis which is more efficient
and effective in relation to the purpose of the research is the use of
statistics technique. This technique provides a systematic structure for
organizing data and answers that is objective by using minimum
resources.
The table above explains that the descriptive
statistics of the independent variables, which consists of parents
'economic level (X1), parents' education level (X2), environment
(X3), and parents' occupations ( X4) states that:
a. The number of variable is 36.
b. The minimum value in X1 is 13.00 and the maximum value is
29, and mean value is 17.75;
c. The minimum value in the X2 is 4.00 and the maximum is 12,
mean value of 9.8;
Table 4.8
Descriptive Statistics
N Minimum Maximum Mean Std. Deviation X1 36 13.00 29.00 19.7500 3.69846
X2 36 4.00 12.00 9.8333 1.76473
X3 36 18.00 31.00 24.3333 3.88403
X4 36 5.00 10.00 8.0556 1.35107
d. The minimum value at X3 is 18.00 and the maximum is
31.00. the mean value of 24.33
e. The minimum value at X4 is 5.00 while the maximum value is
10.00, with mean value of 8.05.
Furthermore, multiple linear regressions was
conducted to determine how much the influence of the
independent variables (social factors) on the dependent variable
(children’s achievement of SLA). The analysis was performed
with the aid of SPSS version 17.00 using enter method. Enter
method was used to determine whether the independent variables
have a positive and significant influence on the dependent
variable.
Table 4.9
Variables Entered/Removedb
Model Variables
Entered
Variables
Removed Method
dimension0 1 X1, X2, X3, X4a . Enter
a. All requested variables entered.
The table shows that there is no variable removed. In other words,
the dependent variables were already incorporated into regression
calculation, so that the equation found was:
Y= a+b1X1+ b2X2 + b3X3 + b4X4 + e
Ex:
Y = Children’s achievement of SLA
a = Constanta
b1,2,3,4, = Regression Coefficient
X1 = Economic Level
X2 = Education Level
X3 = Environment
X4 = Parents’ Occupation
E = Error Standard
Then, F-Test was conducted to test whether the
variables X1, X2,X3, X4 have a simultaneously influence on
variable Y. Testing steps are as follows (Situmorang and Muslich,
2014:178-180):
a. Determining the hypothetical model for H0 and H1;
b. Looking for a table value by determining the error rate (α) and
determine the degree of freedom;
d. Finding calculation the value by using SPSS application
version 17.00;
e. Conclusion.
The test results are:
a. Hypothetical model used in the F test is as follows:
H0: b1 = b2 = 0
That is, collectively there is no positive and significant
influence of the independent variables, namely X1, X2, X3,
X4 on the dependent variable Y.
Ha: b1 ≠ b2 ≠ 0
That is, together there is a positive and significant influence of
the independent variables, namely X1, X2, X3, X4 on the
dependent variable Y.
b. F table can be seen at α = 5%
With the degree of numerator = k - 1 = 5-1 = 4 (k=variables)
With degrees denominator = n - k = 36-5 = 31 (n=samples)
Then F table 0, 05 (4,31) = 2.67
c. Decision-making criteria:
H0 (Ha rejected) if F count ≤ F tables at α = 5%
The test results of F-count are shown in the following table:
Table 4.10
ANOVAb
Model Sum of Squares df Mean Square F Sig. 1 Regression 4713.333 4 1178.333 68.065 .000a
Residual 536.667 31 17.312
Total 5250.000 35
a. Predictors: (Constant), x4, x1, x2, x3 b. Dependent Variable: y
Table 4.10 shows the F count with a significant
level of 0,000 while the F table at 2,67 with a significance level
of 0.05 (5%). It can be concluded that the F count> F table while
a significant level of 0.000 <0.05. The conclusion that can be
obtained that the free variables in this study, consisting of
variable X1, X2,X3, X4 have a positive and significant effect.
Social factors have a positive and significant influence, so they
can be used to predict the children’s achievement of SLA.
Besides, to see the strength of relationship between
social factors and children’s achievement, SPSS R-square test
was conducted.
The coefficient of determination (R2) aims to
determine how much the ability of independent variables to
explain the dependent variable. The coefficient of determination,
in SPSS output lies in the Model Summary tables and is written as
R-square is, the closer/stronger the correlation/relationship
between the variables (Situmorang and Muslich, 2014:163).
Correlation is an effect size and so it can be verbally described
the strength of the correlation using the guide that (Situmorang
and Muslich, 2014:163) suggest for the absolute value of R:
Table 4.11
Strength of Relationship between Variables
Value Interpetation
The R square test result can be seen in the table below:
89.8% of dependent variable (children’s achievement of SLA)
can be explained by the independent variables (social factors)
discussed in this thesis. The rest, 10.2%, can be explained by
other social factors that have not been discussed in this thesis.
4.2.1. Parents’ Economic Level and Children’s Achievement
Parents’ economic level discussed in this thesis is
about family income, and ownership of vehicles. To see the
relationship between parents’ economic level and children
achievement, the writer used Spearman Bivariate Correlation.
Correlation is a bivariate analysis that measures the strengths of
association between two variables. In statistics, the value of the
correlation coefficient varies between +1 and -1. When the value
of the correlation coefficient lies around ± 1, then it is said to be a
perfect degree of association between the two variables. As the
correlation coefficient value goes towards 0, the relationship
between the two variables will be weaker. Correlation analysis is
used to measure the level of relationship between the variables,
not the influence of one on another (Situmorang and Lufti,
Table 4.13
Correlations
X1 Y
Spearman's rho X1 Correlation Coefficient 1.000 .809** Sig. (2-tailed) . .000
N 36 36
Y Correlation Coefficient .809** 1.000 Sig. (2-tailed) .000 .
N 36 36
**. Correlation is significant at the 0.01 level (2-tailed).
Based on table 4.13, the relationship between
parents’ economic level and children’s achievement have a
significant relationship. They have positive correlation. Positive
correlation is a relationship between two variables in which both
variables move in tandem. A positive correlation exists when one
variable decreases as the other variable decreases, or one variable
increases while the other increases. In statistics, the Spearman
Correlation interpretations are as follows:
level is, the higher the achievement of children in language
acquisition (see appendix 5).
Parents’ economic level also has a strong influence
on the achievement of children. The significant level of
regression test is 0.00. It means that parents’ economic level, such
us income and vehicles ownership, determine the success of the
children in learning second language.
4.2.2. Parents’ Education Level and Children’s’ Achievement
Based on the description of parents discussed
previously, parents’ education levels of TK Gethsemane students
are included into high category. Spearman Correlation shows that
there a strong correlation between the two variables.
Table 4.15
Correlations
X1 Y
Spearm an's rho
X1 Correlation Coefficient 1.000 .706**
Sig. (2-tailed) . .000
N 36 36
Y Correlation Coefficient .706** 1.000
Sig. (2-tailed) .000 .
N 36 36
**. Correlation is significant at the 0.01 level (2-tailed).
Table 4.15 shows that the correlation between the
between parents’ education level and children’s achievement. But,
although they have strong relationship, it is found, from
regression test, that parents’ education level does not influence
the children’s achievement. The significant level is greater than
0.05. The higher the parents’ education does not followed by the
higher the students’ scores. Some students whose parents are
highly educated have got low score (See appendix 6). So, parents’
education does not influence directly to the achievement of the
students.
Education of parents does not directly impact the
achievement of their children. But higher education give parents
more opportunities to have better job that in turns will give them
more income to support their children in learning activities.
Parents will be able to provide good facilities for their children.
4.2.3. Environment and Children’s’ Achievement
Linear regression test shows that environment
influences the achievement of students. The significant level is
less than 0.05. Environment has a great impact on the
achievement of students. The condition of their home stay, with
whom they spend their time mostly and other environmental
Correlation also shows that environment and the achievement of
children has a perfect correlation.
Table 4.16
Correlations
X1 Y
Spearman's rho X1 Correlation Coefficient 1.000 .909** Sig. (2-tailed) . .000
N 36 36
Y Correlation Coefficient .909** 1.000 Sig. (2-tailed) .000 .
N 36 36
**. Correlation is significant at the 0.01 level (2-tailed).
4.2.4. Parents’ Occupation and Children’s Achievement
Parents’ occupation does not influence the children’s
achievement. Spearman Correlation test also shows medium
correlate.
Table 4.17
Correlations
X1 Y
Spearman's rho X1 Correlation Coefficient 1.000 .521** Sig. (2-tailed) . .000
N 36 36
Y Correlation Coefficient .521** 1.000 Sig. (2-tailed) .000 .
N 36 36
4.3 The Most Dominant Factor Influencing The Children’s Acquisition
To see the most dominant factor influencing SLA, a an SPSS
T-Test was conducted. A T-test is a statistical examination of two subjects of
study means. The test is to show how the independent variables respectively
have influence on dependent variable. Test were conducted to determine
whether the independent variables and dependent variable have positive
influence or not. T-count was compared to t-table in an error rate (α) of 5%
and with the degree of (df) = (n-k). T-test was done under these steps
(Situmorang and Muslich, 2014:172-174):
a. Determining the hypothetical model for H0 and H1;
b. Finding the table value by determining the error rate (α) and determine the
degree of freedom;
c. Specifying the criteria of decision-making;
d. Finding the count value by using SPSS application 17.00;
e. Conclusion.
The results of the t-test were:
a. Hypothetical model used in the t test was:
H0: b1 = 0, it means there is no significant relationship between the
variables Xs with the variable Y.
H0: b1 ≠ 0, it means that there is a significant relationship between the
b. The error rate (α) = 5% and the degrees of freedom (df) = (n-k)
independent variable to the dependent variable.
a. T value in variable X1 is 3.96 and table value is 1.5. So, t count>
t-table. The significance level in the variable X1 is 0.00 <0.05. This
means that the result of the t-value of 3.96 and a significant level of
0.000 indicates that there is a positive and significant influence
positive relationship between parents’ economic level and children's
achievement of SLA.
b. T value in variable X2 is 1.64 and t-table is 1.5. So, t count> t-table
and the significance level is greater than 0.05 that is 0.10. This means
that the result of the t-value of 1.64 and a significant level of 0.10
indicates that there is no significant correlation between variables X2
to Y. This means that there is no significant relationship between
parents’ education level and children's achievement of SLA.
c. T value in the variable X3 is 3.75 and the t-table is 1.5 from the table it
can be seen that t-count> t-table and the significance level is less than
0.05, that is 0.01. This means that the result of t-test value of 3.75 and
a significant level of 0.01 indicates that there is a significant
correlation between the variables X2 to Y. This means that there is a
positive and significant relationship between the environment and
children's achievement of SLA.
d. T value in the variable X4 is 1.99 and the t-table worth 1.5 so t count>
t-table, but the significance level is greater than 0.05 that is 0.055. This
means that the result of the t-test 1,94 and the significant level of 0.05
indicates that there is a correlation between the variables X2 to Y. This
means that there is a relationship between parents’ occupation and
T-test shows that among the five independent variables,
there are two variables that have positive and significant correlation to
the dependent variable, namely parents’ economic level (X1),
environment (X3), and children’s length of study time. Parents’
occupation also has a relationship, but the effect is not so significant.
And the most dominant factor that influences the achievement of
children’s achievement of acquiring second language is parents’
economic level.
4.4The Reasons of Parents’ Economic Level As The Most Dominant
Factor Influencing The Achievement of Children’s Second Language
Acquisition
To find the reasons why parents’ economic level is the most
influencing factor, the writer conducted observation both on the student
of the highest score and the student of the lowest score. The subjects of
this qualitative research were the two students.
Respondent number 12 is the student with the highest economic
level and one of the students of the highest score. From the observation
and the interview with his parents, it is found that the student goes to a
private English course three times a week. Based on the parents, the
private English course their child goes to is a good and qualified English
course. They have to spend extra money to pay the fee. Every day, one
parents also provide all the learning necessities of the child, including
books, VCD, toys, magazines, etc.
Respondent number 5 is the student of the lowest economic
level and the lowest score. Through the interview with the parents,
student of respondent number 5 does not go to any other extra courses.
The parents told that they have no extra money to send their child to an
English course. They think that what the child have got from the school
is already more than enough. The writer also found that supported
learning materials such as books, VCD, magazines, etc. are not
completely provided by the parents.
4.5 Findings and Discussion
Through the analysis, it is found that parents’ economic level the
first social factor that impact greatly to the growth and learning
achievement of the children. Ideally development of children will be
optimal when they live with the good economic level family, that all
their needs can be fulfilled.
Students from high economic class have more access to
education and its supported facilities. They will be easier to meet all the
needs of schools, unlike those from low economic class that, generally,
experience difficulty in school funding, as well as other needs.
The ownership of property or facilities is associated with
motivated when parents can give everything in relation to learning
facilities in order to improve their learning achievements. The ownership
of property, such us vehicle, will help the mobilizations of students in
doing all their learning activities. A simple example, the students can go
to a very good school, although the school is so far from their house.
Vehicles will be able to accelerate the mobilization of student.
High economic level family, middle economic level family and
low economic level family have different facilities. Low economic level
family has is incomplete facilities when compared to the family of
middle economic level and high economic level.
Socio-economic situation of the family has a role on the
development of the child. A student from a good economic level will
have a greater opportunity to acquire a variety of skills in developing his
skill or achievement, for example, a student who is gifted in English
language, will be able to optimize his ability by taking other English
course or go to a good school.
This finding is supported by previous research conducted by
Butler (2013). Economic level is definitely related to children’s second
language learning in case of resource availability and/or access to target
language (TL). The study conducted by Hartas (2011) consistently
shows that economic level of parents remained powerful in influencing
The second factor that impacts the language learning
achievement is environment. According to behaviorists, represented by
Skinner, environment influences the language of children. Children who
live in an English community will be easier to learn English, they will be
more competent from those who live in indigenous language
community.
According to this theory the most important thing is the
feedback or input in the form of stimulus and output or output in the
form of response. From the analysis, it is found that children given good
stimulus in relation to English language will give good response if
compared to those who live in an environment with no English input.
In this theory, learning behavior will change if there is a
stimulus and response. Stimulus may be the treatment given to the
students, while the response in the form of behavior that occurs in
students.
Parents’ education level and parents’ occupation influence the
children’s achievement in relationship to the way parents support their
children. The two factors do not have very strong impact on the
children’s language ability. It has an indirect impact. Education level
does not influence directly to the children’s language use. Many students
from uneducated parents, in fact, have good English, while others from
educated parents cannot speak English. But education level will impact
generally known that a person with a high education level will be easier
to get a high occupation level that then will give him a high salary which
CHAPTER V
CONCLUSION AND SUGGESTION
5.1 Conclusions
1. Based on the research results and discussion, it can be concluded that social
factors and children’s achievement of SLA are in high correlation. Social
factors are found influence the achievement of students in learning second
language. R-square test shows the result of 0.898 which means 89.8% of
dependent variables can be explained by independent variables. It also
means that 89.8% of children’s achievement of SLA is influenced by social
factors discussed in this thesis.
2. Parents’ economic level is the most dominant factor influencing the
achievement of children/students. It is found that the higher the parents’
economic level is; the higher is the student’s score is. Environment is the
second most dominant factor influencing. Children, who live in good
environment, got higher scores. Meanwhile, parents’ education level and
parents’ occupation have no strong influence on children’s achievement of
SLA.
3. Parents’ economic level is the most powerful in influencing children’s
achievement of SLA. Higher parents’ economic level gives more chance to
students to fulfill all their needs in learning activities. It is found that,
students from higher economic level have higher scores and students from
lower economic level have lower scores. Low economic status prevent
affects all aspects of children’s life including academic achievement, in this
case SLA achievement.
5.2 Suggestions
1. Because there is a strong relationship between parents’ economic level and
children’s learning achievement, it is important for parents, especially from
low economic, to increase the family income in order to fulfill all the needs
of their children. The fulfillment of students’ needs is a motivation for them
in learning activities. Good parents’ economic level helps them optimize
their talents and abilities.
2. Parents should try to raise their children in good environment. Because
environment influences the children’s achievement, beside the parents’
economic level. Children, who are raised up in a good environment, will
have good attitude and good achievement.
3. For teachers, this research informs what factors that should be given more
attention. By knowing the students’ background, teachers are expected to
have strategies in helping their students.
4. Social factors discussed in this thesis 89.8 % influence the children’s
achievement of SLA. It means that there are about 11.2% other factors
influencing the children’s achievement. It suggested to other researchers
interested in second language studies to conduct another research, to find
another factors influencing SLA. The writer suggests discussing other
5. Because this research is about the influence of social factors, it means that
it relates to the external factors of the students. The writer also suggests that
other researchers conduct some studies on the internal factors, so it can be
seen which factor, internal or external, is the most influential in learning a