Increasing corn for biofuel production reduces
biocontrol services in agricultural landscapes
Douglas A. Landis
a,1, Mary M. Gardiner
a, Wopke van der Werf
b, and Scott M. Swinton
cDepartments ofaEntomology andcAgricultural, Food, and Resource Economics, Michigan State University, East Lansing MI 48824; andbCentre for Crop
Systems Analysis, Department of Plant Sciences, Wageningen University, P.O. Box 430, 6700 AK Wageningen, The Netherlands
Edited by May R. Berenbaum, University of Illinois, Urbana, IL, and approved November 5, 2008 (received for review May 22, 2008)
Increased demand for corn grain as an ethanol feedstock is altering
U.S. agricultural landscapes and the ecosystem services they
pro-vide. From 2006 to 2007, corn acreage increased 19% nationally,
resulting in reduced crop diversity in many areas. Biological control
of insects is an ecosystem service that is strongly influenced by
local landscape structure. Here, we estimate the value of natural
biological control of the soybean aphid, a major pest in agricultural
landscapes, and the economic impacts of reduced biocontrol
caused by increased corn production in 4 U.S. states (Iowa,
Mich-igan, Minnesota, and Wisconsin). For producers who use an
inte-grated pest management strategy including insecticides as needed,
natural suppression of soybean aphid in soybean is worth an
average of $33 ha
ⴚ1. At 2007–2008 prices these services are worth
at least $239 million y
ⴚ1in these 4 states. Recent biofuel-driven
growth in corn planting results in lower landscape diversity,
altering the supply of aphid natural enemies to soybean fields and
reducing biocontrol services by 24%. This loss of biocontrol
ser-vices cost soybean producers in these states an estimated $58
million y
ⴚ1in reduced yield and increased pesticide use. For
producers who rely solely on biological control, the value of lost
services is much greater. These findings from a single pest in 1 crop
suggest that the value of biocontrol services to the U.S. economy
may be underestimated. Furthermore, we suggest that
develop-ment of cellulosic ethanol production processes that use a variety
of feedstocks could foster increased diversity in agricultural
land-scapes and enhance arthropod-mediated ecosystem services.
bioenergy兩biological control兩ecosystem services
H
igh recent prices of oil and a growing interest in developing
alternative liquid fuels has driven a rapid expansion of the
corn ethanol industry in the United States. Continuing growth
of ethanol production facilities in major corn-producing areas
has significantly increased demand for corn grain (1) and is
restructuring agricultural landscapes. In 2007, corn plantings in
the U.S. totaled 37.9 million ha, a 19% increase over 2006 (ref.
2 and http://usda.mannlib.cornell.edu/usda/nass/CropProd//
2000s/2008/CropProd-08-12-2008
㛭
revision.pdf). In 2008 corn
plantings declined 7% from 2007 levels but still represent the
second highest since 1946 (ref. 3 and
http://usda.mannlib.cor-nell.edu/usda/ers/FDS//2000s/2008/FDS-08-14-2008.pdf). The
Energy Independence and Security Act of 2007 mandates a
nearly 5-fold expansion of biofuel production (4), which will
likely drive further expansion of corn area. Increases in corn
production are already having repercussions, driving up the
prices of other major field crops that compete with corn for land.
Increased corn acreage for biofuel production has raised
con-cerns regarding the potential for increased food prices, fertilizer
and pesticide pollution, soil erosion, biodiversity losses, and
greenhouse gas emissions (5–7). Here, we consider a largely
unrecognized impact, the effect of a change in landscape
struc-ture on arthropod-mediated ecosystem services and its
implica-tions for the sustainability of agricultural production systems (8).
It has been estimated that insects provide human society with
ecosystem services valued at
⬎
$57 billion yr
⫺1in the United
States (9). Of this, $4.5 billion yr
⫺1has been attributed to natural
pest control in agricultural crops. Much of this pest control
service is provided by generalist natural enemies that suppress
populations of a variety of native and exotic insect pests. Diverse,
small-scale agricultural landscapes with a high proportion of
noncrop habitats frequently support a greater abundance of
natural enemies and lower pest populations than large-scale,
monoculture landscapes with little noncrop habitat (10).
Expan-sion of bioenergy crop production on arable lands is likely to
change the habitat characteristics that enable these landscapes to
support biological control. Increased planting of biofuel crops
such as corn, that already dominate large areas in agricultural
landscapes, may well reduce biocontrol services.
The soybean aphid (
Aphis glycines
Matsumura) is an invasive
insect pest that has become the most significant threat to soybean
production in the United States (11). Soybean aphid is consumed
by a diversity of natural enemies, including predators and
parasitoids (12, 13), that can provide strong top-down regulation
of its populations (14), resulting in increased crop yields (15).
The natural enemy complex of soybean aphid is currently
dominated by generalist predators, in particular ladybird beetles
(Coleoptera: Coccinellidae) (16, 17). The main effect of
preda-tion on aphid populapreda-tion growth occurs when aphid populapreda-tions
are still small and vulnerable to predation losses (18, 19). Our
recent studies show that these predators are responsive to
landscape structure and that habitat diversity at the 1.5-km scale
surrounding a soybean field is strongly related to the level of
soybean aphid suppression. Landscapes with high levels of corn
and soybean production had low habitat diversity and
signifi-cantly reduced biocontrol services in soybean fields (20). Here,
we specifically examine how increasing amounts of corn
pro-duction alters the value of arthropod biological control as an
ecosystem service in agricultural landscapes.
Results
Biocontrol Services in Changing Agricultural Landscapes.
Annual
crop production dominates agricultural landscapes in our study
area of Iowa, Michigan, Minnesota, and Wisconsin, and the
composition of these landscapes is rapidly changing because of
increased demand for corn as a biofuel feedstock (Table 1). In
2007, harvested corn acreage increased by 12%, 20%, 14%, and
17% in Iowa, Michigan, Minnesota, and Wisconsin, respectively,
compared with 2006 acreage (2). This increase was primarily at
the expense of harvested soybean acreage, which declined by
16%, 13%, 15%, and 20%, respectively. We found that the
proportion of corn (
R
2⫽
0.66,
P
⬍
0.0001) and soybean (
R
2⫽
Author contributions: D.A.L., M.M.G., W.v.d.W., and S.M.S. designed research; M.M.G. and W.v.d.W. performed research; M.M.G. and W.v.d.W. analyzed data; and D.A.L., M.M.G., W.v.d.W., and S.M.S. wrote the paper.
The authors declare no conflict of interest.
This article is a PNAS Direct Submission.
Freely available online through the PNAS open access option.
1To whom correspondence should be addressed. E-mail: [email protected].
This article contains supporting information online atwww.pnas.org/cgi/content/full/ 0804951106/DCSupplemental.
0.20,
P
⬍
0.0327) in the local landscape (1.5-km scale) were both
negatively associated with landscape diversity; however, these
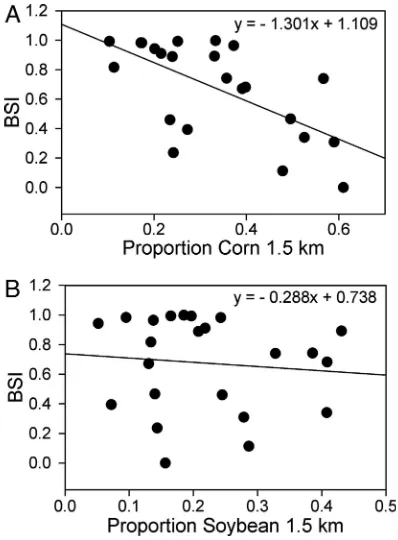
crops had differing impacts on biocontrol services. Using data
from 23 site-year combinations on the growth of soybean aphid
populations in treatments with and without natural enemies, we
calculated a biocontrol services index (BSI) defined as the
proportional decrease in aphid population growth in the
pres-ence of natural enemies. We found that BSI declined
signifi-cantly with increasing proportion of corn in the landscape (Fig.
1
A
;
R
2⫽
0.39,
P
⫽
0.001) but BSI was not significantly related
to the proportion of soybean (Fig. 1
B
;
R
2⫽
0.01,
P
⫽
0.646).
Thus, exchanging corn for soybean does not have a neutral effect
on biocontrol services. Rather, as corn area increased in the local
landscape, biological control services to soybean decline.
To estimate the economic impact of these landscape changes
on biocontrol services, we used the estimated relationship
between area of corn and BSI (Fig. 1
A
), in conjunction with
established models for soybean aphid population dynamics (21)
and aphid-induced yield loss (11), to project the effect of changes
in corn area on biocontrol services in soybean and the resulting
effects on aphid population dynamics and crop damage. We
considered 2 soybean aphid management strategies, integrated
pest management (IPM) and biocontrol that encompass the
range of management approaches currently used by producers.
We defined IPM to include weekly field scouting with
applica-tion of convenapplica-tional insecticides when populaapplica-tions exceed the
established economic threshold of 250 soybean aphids per plant
(11). The biocontrol strategy relies solely on the capacity of the
prevailing natural enemy complex to suppress soybean aphid.
Data from predator exclusion experiments (20) were used to
initialize and run the aphid population growth model and to
project outcomes from the 2 management strategies.
Output from the population dynamics model for 1 of the 23
site-year combinations is depicted in Fig. 2. Under biocontrol
alone (Fig. 2
A
), the observed aphid population on the natural
enemy-free plants grows rapidly over the 14-day experiment.
Table 1. Corn and soybean plantings in Iowa, Michigan, Minnesota, and Wisconsin showing changes in ha harvested from 2006 to
2007 and state average soybean yields
State
Corn ha harvested Soybean ha harvested
Soybean yield, Mg ha⫺1*
2007, thousands ha
Change from 2006, %
Percentage of national
2007, thousands ha
Change from 2006, %
Percentage of national
Iowa 5,604.9 ⫹12 16 3,447.9 ⫺16 14 3.16
Michigan 951.0 ⫹20 3 704.2 ⫺13 3 2.59
Minnesota 3,156.4 ⫹14 9 2,488.9 ⫺15 10 2.79
Wisconsin 1,327.4 ⫹17 4 538.2 ⫺19 2 2.96
Total 11,039.8 ⫹14 32 7,179.2 ⫺18 28 —
*Ten-year median soybean yield, 1997–2006 from U.S. Department of Agriculture crop production summary reports (1999, 2002, 2005, 2008)
Fig. 1. Relationship between the BSI in soybean fields and proportion of corn (A) and soybean (B) in the local landscapes (1.5-km radius). BSI, the propor-tional decrease in aphid population growth in the presence of natural ene-mies, declines significantly with increasing corn (R2⫽0.39,P⫽0.001) but not
soybean (R2⫽0.01,P⫽0.6738).
Fig. 2. Example model output of soybean aphid population growth with and without natural enemies under 2 management strategies biocontrol alone (A) and IPM (B). Solid lines represent observed data, and dotted lines indicate model projections. Caged plants are free of natural enemies that consume soybean aphid, while open plants have ambient levels of natural enemies present. Steep population declines simulate insecticide sprays triggered by the population exceeding the economic threshold of 250 aphids per plant. Sprays were applied 4 days after reaching threshold to simulate an average producer response time.
SUSTAINABILITY
From this point the model projects continued population growth
of aphids until changes in host plant quality cause their decline.
By contrast, in the open field with natural enemies present,
population growth is greatly suppressed. Using the same initial
experimental data, the IPM example yields a markedly different
result (Fig. 2
B
). Here, the observed aphid population on the
natural enemy-free plants again rises throughout the initial 14
days, which in the model projection, triggers an insecticide
application that reduces the population by 98%. In the presence
of natural enemies, the open-field population grows more slowly
but eventually exceeds the economic threshold, also triggering an
insecticide treatment. The above 4 trajectory projections were
replicated for each site-year combination under a landscape
change scenario where corn area was increased to 2007 levels for
each state. The resulting data were analyzed to determine the
overall value of biocontrol services to soybean producers and the
impact of landscape change on this ecosystem service under
varying aphid infestations and management strategies.
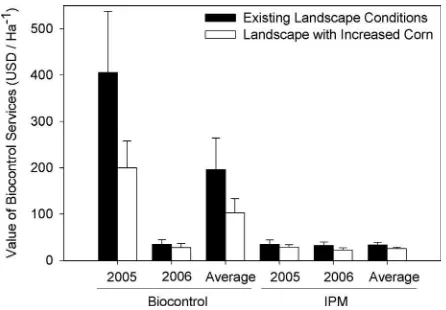
Value of Biocontrol Services.
The value of soybean aphid
biocon-trol services varies with soybean aphid abundance, management
strategy, and amount of corn in the landscape. Soybean aphid
populations fluctuate from year to year (22), resulting in
differ-ent values of ecosystem services provided in years of high (2005)
versus low (2006) soybean aphid abundance (Fig. 3). In 2005,
yield losses were high for growers who relied solely on natural
biocontrol. Consequently, the value of the ecosystem service of
biological control mitigating these losses was also high, averaging
$406 ha
⫺1across the 4 states. An increase of corn in these
landscapes to 2007 levels reduced the value of the biocontrol
service to an average of $199 ha
⫺1. Using the IPM strategy
greatly reduced economic losses to soybean aphids; however,
IPM users still received an average of $35 ha
⫺1in biocontrol
services in 2005. This benefit decreased to an average of $29 ha
⫺1when corn was increased to 2007 levels.
In 2006, soybean aphid abundance was dramatically lower
across the study region, resulting in similar biocontrol service
values for the IPM and biocontrol approaches (Fig. 3). For
growers who rely on biocontrol alone, the presence of natural
enemies was worth an average of $35 ha
⫺1across the 4 states.
Modeling an increase in corn in these landscapes to 2007 levels
reduced the value of the biocontrol service to an average of $28
ha
⫺1. In 2006, IPM users received an average of $32 ha
⫺1in
biocontrol services, which decreased to an average of $23 ha
⫺1when corn was increased to 2007 levels.
The value of biocontrol services in soybean depends in part on
the number of fields in which aphids exceed the economic
threshold and thus trigger costly insecticide applications to
protect yield. In 2005, model projections show that 100% of the
fields where natural enemies were excluded exceeded the
eco-nomic threshold. In contrast, where natural enemies were not
excluded, 30% of these fields remained below the threshold. In
2006, 62% of fields reached threshold in the absence of natural
enemies; however, in the presence of natural enemies no fields
required insecticide sprays. Using typical pesticide and
applica-tion costs of $24.5 ha
⫺1(11), it is clear that the action of natural
enemies in preventing the need for insecticide applications is a
major factor contributing to the value of the biocontrol service.
Additional information on the range of biocontrol service values
as influenced by aphid abundance, soybean price, management
scenarios, and land-use change are given in
SI Text
and
Tables
S1 and S2
.
Aggregate Values.
Averaged over the 23 site-year combinations,
the value of biocontrol services decreased from $196 ha
⫺1to
$103 ha
⫺1as a result of increased corn in the landscape when
biological control was the sole pest management strategy (
Table
S2
). Under IPM, the average value of biocontrol services
decreased from $33 ha
⫺1to $25 ha
⫺1. This change of $8 ha
⫺1amounts to nearly a quarter of average crop chemicals cost of $35
ha
⫺1or 3.4% of total operating costs of $235 ha
⫺1for
conven-tional soybean farmers in the U.S. ‘‘heartland’’ and ‘‘northern
crescent’’ states during 2006 (ref. 23 and www.ers.usda.gov/Data/
CostsAndReturns). The overall percentage of fields reaching
threshold with natural enemies present increased from 30%
under the 2005/2006 landscape conditions to an estimated 43%
with an increase in corn acreage to the 2007 level.
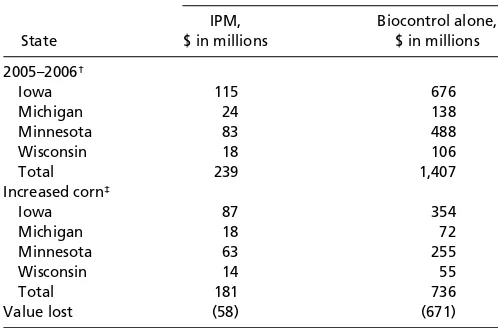
If all producers used IPM, we estimate the value of natural
biocontrol services against soybean aphid in the 4 target states
at $239 million y
⫺1or $1,620 farm
⫺1y
⫺1under 2007–2008
‘‘biofuel-influenced’’ soybean prices of $380 Mg
⫺1⫽
$10.40
Bu
⫺1(Table 2). With corn increased to 2007 levels, the value of
biocontrol services in these states declines by an estimated 24%,
equivalent to $58 million y
⫺1or $390 farm
⫺1y
⫺1. Because of
increased risk of yield loss, sole reliance on natural biocontrol is
a much less common grower strategy. However, if followed by all
growers, it would yield aggregate annual biocontrol services
against soybean aphid exceeding $1.4 billion y
⫺1in the 4 target
states. With corn increased to 2007 levels, the annual value of
these services would be reduced by 48% or $671 million y
⫺1.
Thus, in the world of corn ethanol-driven prices the IPM-based
figure of $239 million y
⫺1is a lower bound for the value of these
services in these 4 states as some growers realize greater gains
by relying entirely on natural biocontrol.
Discussion
Increased corn prices and production provide an immediate
profitability benefit to corn growers; however, many of these
same growers incur hidden costs to their soybean production
because of the attendant landscape change. These impacts
extend to neighboring producers and society as a whole through
an overall reduction in biocontrol services from these
land-scapes. From 2006 to 2007, U.S. corn acreage increased
dramat-ically, primarily at the expense of soybean but also from reduced
production of minor crops and cultivation of formerly fallow
areas such as Conservation Reserve Program acreage. The
overall impact of these changes is agricultural landscapes with
lower habitat diversity, which has been associated with reduced
biological control. A recent metaanalysis found that simple
agricultural landscapes had lower abundance of natural enemies
(76% of studies) and increased pest pressure (45% of studies)
Fig. 3. Value (mean⫾SEM) of biocontrol services against soybean aphid in Iowa, Michigan, Minnesota, and Wisconsin in years of high (2005,n⫽10 sites) or low (2006,n⫽13 sites) aphid abundance. Average values represent means across the 2 years. Values shown are based on 2007–2008 projected soybean price of $380 Mg⫺1for 2 aphid management strategies: biocontrol alone or
(10). The lack of alternative prey, food sources, and shelter are
among the most common mechanisms cited for such reductions
in natural enemies and subsequent reduced biocontrol in
sim-plified landscapes. In our study area, corn supports relatively low
numbers of aphids and thus few aphidophagous Coccinellidae
(24, 25) that are key to soybean aphid suppression (16). In
contrast, wheat, alfalfa, vegetable crops, and many noncrop
habitats support alternative aphid prey and thus serve as sources
of these predators to the entire landscape.
The current and future value of biological control services is
subject to strong ecological and economic drivers. For example,
year-to-year fluctuations in soybean aphid populations strongly
influence the realized value of biocontrol services in our study.
As such, the impact of increased corn will be much greater in
years of high aphid abundance, specifically for growers who rely
on natural biological control. In addition, market forces impact
prices and consequently, producers’ planting intentions.
Con-tinued high prices for competing crops such as wheat and
soybean may dampen corn production in these landscapes as
occurred in 2008 (3).
Table S1
documents the large effects of
soybean prices and year-to-year variability in aphid populations
on the value of biocontrol services. Other influences in our
model framework include site-specific variation in soybean aphid
population dynamics and the relationship of cumulative aphid
load to yield loss. These phenomena have been explored in depth
in previous studies, leading to models with good predictive
precision (11, 21). We feel that coupling our 23 site-years of
predator/aphid data with long-term crop yield data constitute a
solid platform for projection to the 4-state level. However, any
inaccuracies in predictions of model components accumulate in
the final outcomes; hence, it is safer to interpret our estimates in
comparative rather than absolute and exact terms.
Even with these caveats, we believe our IPM scenario to be a
conservative estimate of the value of biocontrol services in
soybean. First, we use only the 14-day predator impact data that
we empirically obtained, assuming no further impact of
preda-tors. Although natural-enemy feeding undoubtedly occurs
be-yond 14 days, our previous studies suggest that the largest effect
of natural enemies on aphid colony growth typically occurs soon
after establishment and that limiting experimental
manipula-tions to this period avoids potential cage effects (12). Second,
although we account for the actual cost of insecticides and their
application, we do not include any environmental costs of
insecticide use, which would increase the estimated value of
biocontrol services. Third, all of our estimates are based on
prices for conventional soybean. For those producers who
mar-ket organically and experience price premiums, the value of
these services is substantially greater. Fourth, we do not include
the value of natural enemies to other crops and to soybean for
pests other than aphids. Many of the natural enemies that attack
soybean aphid are generalists that inhabit multiple ecosystems
(13, 24, 25). Therefore, increased corn in the landscape will also
likely reduce biocontrol services in other nearby habitats. For
example, coccinellid predators that commonly attack soybean
aphid also provide control of aphids in wheat and alfalfa and
contribute to biocontrol in fresh market crops, urban and
suburban landscapes, and natural areas.
These results have several implications. First, they suggest that
prior estimates of the value of arthropod biocontrol services in
agricultural crops may be conservative. Previous authors (9)
have attributed $4.5 billion yr
⫺1to natural pest control of native
pests in all of U.S. agriculture. Using historic soybean prices
comparable with theirs, we estimate a value of at least $131
million yr
⫺1for suppression of a single soybean pest in 4 states
that account for just 28% of total U.S. soybean area. The large
estimated value for biocontrol of soybean aphid alone compared
to the aggregate estimate for all arthropod pest control services
suggests that further elucidation of the true value of
arthropod-mediated ecosystem services may exceed previous estimates.
Second, our estimates suggest that increased reliance on corn as
a biofuel feedstock will have negative impacts on biocontrol
services in agricultural landscapes. As corn area increases,
agricultural landscapes become less diverse and biocontrol
vices decline. In the face of decreased natural biocontrol
ser-vices, producers will experience increased yield losses or be
forced to rely to a greater extent on pesticides, increasing costs
of production. In addition, increased use of insecticides may
further reduce the suitability of these landscapes for natural
enemies, exacerbating both pest and environmental problems
(26). Such impacts will be keenly felt by organic producers who
lack effective insecticides against the soybean aphid.
The Energy Independence and Security Act of 2007
acceler-ates targets for biofuel production from agricultural landscapes
(4). The ultimate sustainability of these systems will depend on
the type of feedstocks produced, which in turn will be driven by
the available methods for their processing. Development of
biorefineries that rely primarily on corn grain or residues as
feedstocks will foster a landscape of increased corn production
within their feedstock supply region. Our analysis suggests that
expanded corn in the landscape will reduce biocontrol services,
and increase reliance on pesticides. Alternatively, development
of cellulosic ethanol-processing capabilities that can use a variety
of feedstocks such as switchgrass, mixed prairie, and woody
biomass (27–29), create the potential to diversify agricultural
landscapes and support multiple ecosystem services. For
exam-ple, production of switchgrass, a native perennial grass, can
increase wildlife habitat while reducing fertilizer use, water use,
and soil erosion (30, 31). Mixed prairie communities could be
used as a low-input high-diversity biofuel crop (28), contributing
to flowering plant diversity and supporting a variety of pollinator
and natural enemy arthropods (32). The vital services these
arthropods provide to other crops may make such multispecies
biofuel crops especially beneficial components of agricultural
landscapes. Evaluation of the landscape-level impacts of biofuel
Table 2. Estimated annual value of natural biocontrol services
against soybean aphid in 4 north-central U.S. states under a
crop landscape typical for the period 2005–2006 and under a
biofuel-influenced landscape of increased corn
State
Biocontrol alone reflects value of the service if all producers rely exclusively on natural biocontrol. IPM reflects value of the service if all producers use IPM practices to reduce aphid damage, including scouting and insecticide appli-cations.
*Based on 2007– 08 projected soybean price $380 Mg⫺1⫽$10.40 Bu⫺1. †Based on actual 2005–2006 landscapes in study areas.
‡Projected landscape composition using actual 2007 corn ha increases per
state.
SUSTAINABILITY
crop production, and increased communication between
scien-tists, policy makers and the biofuels industry, is critically needed
to inform decisions on development of sustainable biofuel
production technologies (33).
Materials and Methods
Biocontrol Services Data.Gardineret al.(20) measured the biocontrol service supplied by natural enemies of the soybean aphid,A. glycines, in soybean fields across 2 years (2005 and 2006) and 4 states (Iowa, Michigan, Minnesota, and Wisconsin). Within each state, 3- 8 sites were studied over the 2 seasons, for a total of 23 site-year combinations. To determine the impact of natural enemies on soybean aphid populations, 2 treatments were compared: an open treatment where natural enemies had full access to aphid-infested soybean plants, and a caged treatment where exclusion cages prevented natural enemies from colonizing plants and consuming aphids. At each loca-tion, treatments (n⫽4 replications) were established when fields reached an average of 10 aphids per plant, and plants in both treatments were manipu-lated to start with this aphid density at day 0. Aphid counts were made 7 and 14 days after the treatments were established. We have previously established that this time period allows observation of the critical predator impacts while minimizing potential for cage effects (12). Based on these data, we calculated a BSI, which is the relative reduction in aphid density caused by predator access over a period of 14 days:
BSI
⫽
whereAcis the number of aphids on the caged plant on day 14,Aois the number of aphids on the open plant on day 14,pis plot, andnis the number of replicates for a given site.
Evaluating Biofuel Landscapes.From 2006 to 2007 harvested corn acreage increased by 12–20% in Iowa, Michigan, Minnesota, and Wisconsin (Table 1). To account for this shift in production, we first determined the corn acreage present within a 1.5-km radius surrounding each of the 23 soybean field sites where BSI was measured in 2005 and 2006. Next, we increased corn acreage for each of these landscapes by the proportional increase recorded for the state in which each individual site was located. Finally, we used the equation from the linear regression of corn and BSI (y⫽ ⫺1.301x⫹1.109) to determine new predicted BSI values for each site based on the increased corn acreage. These BSI values allow for the calculation of adjusted aphid abundance values for the open, i.e., predator-exposed treatment at 14 days of the experiment. We then compare the service provided by natural enemies under 2 landscape regimes, the 2005–2006 landscape (based on land cover data collected in 2005 and 2006) and a biofuels-influenced landscape (incorporating the 2007 corn in-crease).
Predicting Aphid Population Growth.To predict the value of biocontrol services obtained under both landscape regimes, it was necessary to project aphid population growth beyond the timeframe of the 14-day experiment. To accomplish this we used an aphid population growth model (21) that is based on the growth of natural enemy-free (i.e., caged) soybean aphid populations. We used a linear interpolation to estimate aphid populations during the experimental period 0 –14 days then projected the population for the remain-der of the season by using Eq.2:
N
t⫽
N
0e
rt
冉
1⫺12at
冊
,
[2]
whereNis the aphid population size,tis thermal time since sowing (degree days base⫽10 °C),ris the intrinsic rate of increase of soybean aphid at thermal time 0, andaexpresses the effect of plant age (thermal time) on the rate of population increase of soybean aphid on soybean plants (34). This model showed good to excellent predictions of soybean aphid population dynamics in the absence of predators withRprediction2 from independent data ranging
from 0.86 to 0.99 (21). The population projection after the 2-week period of the field measurements does not account for further predation effects and therefore provides a lower bound for predator impact.
Soybean Aphid Pest Management Scenarios.We used 2 scenarios to describe producer responses to soybean aphid infestations. The first was IPM, where
producers scout soybean aphid populations every 7 days and make insecticide applications 4 days after a population reaches the economic threshold. Our second strategy was a biocontrol-alone strategy, where producers rely com-pletely on natural biocontrol. IPM strategies represent profit-maximizing behavior for those soybean growers that use pesticides. The economic thresh-old for pest control is the level at which a pest population will cause crop yield losses that exceed the cost of control, in this case, insecticide treatment. The established economic threshold is 250 aphids per soybean plant (11). Because many producers rely on custom applicators for field spraying services, the 4-day delay represents a realistic average response time. We assume insecti-cide applications induce 98% mortality and prevent aphid population growth for 7 days.
Estimating Soybean Damage.To estimate the damage caused by soybean aphid in the presence and absence of natural enemies, cumulative aphid days (CAD) were calculated by integrating the area under each curve (aphid population with and without predation) by application of the trapezoidal rule over daily time intervals. To translate CAD into yield loss, we applied a yield loss coefficient of 0.688% per 1,000 aphid days per plant, derived from yield loss studies from 19 location-year combinations in 6 Midwestern states, in-cluding all 4 states included in our study (linear regression of yield loss on CAD, R2⫽0.665) (11). To avoid crop loss⬎100%, the proportional crop loss was
truncated at a value of 1.
Calculation of Value of Biocontrol Services.To calculate the monetary value of yield loss caused by soybean aphid we used the 10-year median yields in Mg䡠ha⫺1from 1997 to 2006 for Iowa (3.16), Michigan (2.59), Minnesota (2.79), and Wisconsin (2.96) (35). Pesticide application costs of $24.5 ha⫺1represent
a midrange control cost representative of hired ground application of a moderately-priced soybean aphid insecticide (11). For each year and field we estimated the value of income loss ha⫺1caused by soybean aphid with or
without natural enemies, including yield loss, insecticide, and scouting costs for IPM strategies ($5 ha⫺1) (36). We calculated the mean for each set ofn⫽
23 site-years per scenario. By subtracting the mean loss with natural enemies present from the loss in their absence, we obtained the value of biocontrol services (VBS) for that scenario. The loss ha⫺1was multiplied by the area of
soybean harvested in each state to provide a statewide estimate of VBS. The difference in VBS ha⫺1between 2005–2006 and 2007 landscapes was used to
calculate the reduced VBS in a biofuel landscape that was scaled to the state level.
Monetary Valuation Method.We adopted the production function approach to monetary valuation (37), which allows the value of biocontrol services to be inferred from their effects on the production of a marketed product, such as soybean. Critics of prior attempts to place monetary values on ecosystem services have highlighted the importance of focusing on marginal changes, consideration of most likely alternatives, and recognition of market price feedback effects (38, 39). For followers of the IPM strategy, the value of biocontrol services comes from both avoiding insecticide application costs and averting yield loss. For producers relying solely on biocontrol, the value of biocontrol services comes entirely from reduced yield loss. Although the relative size of these grower groups is not well known, U.S. Department of Agriculture surveys in 2005–2006 in the 4 states studied found the percentage of soybean acreage with insecticide use ranges from 4% (Wisconsin) to 56% (Minnesota), with a 2-year median of 23% (ref. 40 and http://usda.mannlib. cornell.edu/MannUsda/viewDocumentInfo.do?documentID⫽1560). In con-trast, only 0.2% of U.S. soybean land is certified for organic production (ref. 41 and www.ers.usda.gov/Data/Organic) and hence committed to a strategy like sole reliance on biocontrol. Given the current situation, we judge the IPM scenario to be the most representative strategy for purposes of valuation of biocontrol as an ecosystem service.
The importance of market-price feedback effects is evident from the recent fluctuations in agricultural commodity prices. Soybean prices more than dou-bled from their recent historic levels of 1997–2006 to early 2008, when soybean futures market prices reached levels considerably higher than the 2007–2008 U.S. Department of Agriculture price projection of $380 Mg⫺1⫽
$10.40 Bu⫺1(ref. 42 and http://usda.mannlib.cornell.edu/usda/ers/OCS//2000s/
and total operating cost for soybean producers in our region (ref. 23 and www.ers.usda.gov/Data/CostsAndReturns).
ACKNOWLEDGMENTS.We thank Steve Scott for programming assistance and Risk Avoidance and Mitigation Program collaborators for supplying the orig-inal data and G. Philip Robertson, Douglas Schemske, James R. Miller, Bruce E. Dale, Holger Meinke, Rufus Isaacs, and 3 anonymous reviewers for useful comments that improved the manuscript. This work was supported by the U.S.
Department of Agriculture Cooperative State Research, Education, and Ex-tension Service Risk Avoidance and Mitigation Program Grant 2004-51101-02210), Department of Energy Great Lakes Bioenergy Research Center Grant DE-FC02-07ER64494), the National Science Foundation Long-Term Ecological Research Program at the W.K. Kellogg Biological Station (through Grant 0423627), and the Michigan Agricultural Experiment Station. W.v.d.W. was supported by the C.T. de Wit Graduate School for Production Ecology and Resource Conservation.
1. Westcott PC (2007)Ethanol Expansion in the United States: How Will the Agricultural Sector Adjust?(Department of Agriculture Economic Research Service, Washington DC). 2. US Department of Agriculture (2008)Crop Production 2007 SummaryCrPr2-2(8-08).
(National Agricultural Statistics Service, Washington DC).
3. Baker A, Allen E, Lutman H (2008).Feed OutlookFDS-08g. (Department of Agriculture Economic Research Service, Washington, DC).
4. Rahall N,et al.(2007)HR 6:. Energy Independence and Security Act of 2007(Library of Congress, Washington, DC).
5. Nash S (2007) Decrypting biofuel scenarios.BioScience57:472– 477.
6. Searchinger T,et al.(2008) Use of U.S. croplands for biofuels increases greenhouse gases through emissions from land-use change.Science319:1238 –1240.
7. Donner SD, Kucharik CJ (2008) Corn-based ethanol production compromises goal of reducing nitrogen export by the Mississippi River.Proc Natl Acad Sci USA105:4513–4518. 8. Swinton SM, Lupi F, Robertson GP, Landis DA (2006) Ecosystem services from
agricul-ture: Looking beyond the usual suspects.Am J Agric Econ88:1160 –1166. 9. Losey J, Vaughan M (2006) The economic value of ecological services provided by
insects.BioScience56:311–323.
10. Bianchi FJJA, Booij CJH, Tscharntke T (2006) Sustainable pest regulation in agricultural landscapes: A review on landscape composition, biodiversity, and natural pest control. Proc R Soc London Ser B273:1715–1727.
11. Ragsdale DW,et al.(2007) Economic threshold for soybean aphid (Hemiptera: Aphi-didae).J Econ Entomol 100:1258 –1267.
12. Fox TB, Landis DA, Cardoso FF, DiFonzo CD (2004) Predators suppressAphis glycines Matsumura population growth in soybean.Environ Entomol33:608 – 618. 13. Rutledge CE, O’Neil RJ, Fox TB, Landis DA (2004) Soybean aphid predators and their use
in IPM.Ann Entomol Soc Am97:240 –248.
14. Costamagna AC, Landis DA (2006) Predators exert top-down control of soybean aphid across a gradient of agricultural management systems.Ecol Appl16:1619 –1628. 15. Costamagna AC, Landis DA, DiFonzo CD (2007) Suppression of soybean aphid by
generalist predators results in a trophic cascade in soybeans.Ecol Appl17:441– 451. 16. Costamagna AC, Landis DA (2007) Quantifying predation on soybean aphid through
direct field observations.Biol Control42:16 –24.
17. Costamagna AC, Landis DA, Brewer MJ (2008) The role of natural enemy guilds inAphis glycinessuppression.Biol Control45:368 –379.
18. Landis DA, van der Werf W (1997) Early-season aphid predation impacts establishment and spread of sugar beet yellows virus in the Netherlands.Entomophaga42:499 –516. 19. Ives AR, Settle WH (1997) Metapopulation dynamics and pest control in agricultural
systems.Am Nat149:220 –246.
20. Gardiner MM,et al.(2008) Landscape diversity enhances the biological control of an introduced crop pest in the north-central U.S.Ecol Appl, in press.
21. Costamagna AC, van der Werf W, Bianchi FJJA, Landis DA (2007) An exponential growth model with decreasingrcaptures bottom-up effects on the population growth Aphis glycinesMatsumura (Hemiptera: Aphididae).Agr Forest Entomol9:297–305. 22. Donaldson JR, Myers SW, Gratton C (2007) Density-dependent responses of soybean
aphid (Aphis glycinesMatsumura) populations to generalist predators in mid- to late-season soybean fields.Biol Control43:111–118.
23. US Department of Agriculture (2008)Conventional Soybean Production Costs and Returns per Planted Acre, by Region, Excluding Government Payments, 2006 (Eco-nomic Research Service, Washington DC).
24. Maredia KM, Gage SH, Landis DA, Wirth TM (1992) Ecological observations on pred-atory Coccinellidae (Coleoptera) in southwestern Michigan.Great Lakes Entomol 25:265–270.
25. Colunga-Garcia M, Gage SH, Landis DA (1997) Response of an assemblage of Coccinel-lidae (Coleoptera) to a diverse agricultural landscape.Environ Entomol26:797– 804. 26. Barducci TB (1972) inThe Careless Technology: Ecology and International
Develop-ment, eds Farvar MT, Milton JP (Natural History Press, Garden City, NY), pp 423– 438. 27. Schmer MR, Vogel KP, Mitchell RB, Perrin RK (2008) Net energy of cellulosic ethanol
from switchgrass.Proc Natl Acad Sci USA105:464 – 469.
28. Tilman D, Hill J, Lehman C (2006) Carbon-negative biofuels from low-input high-diversity grassland biomass.Science314:1598 –1600.
29. Perlack RD,et al.(2005)Biomass as a Feedstock for a Bioenergy and Bioproducts Industry: The Technical Feasibility of a Billon-Ton Annual Supply(Oak Ridge National Laboratory, Oak Ridge, TN).
30. Murray LD, Best LB, Jacobsen TJ, Braster M (2003) Potential effects on grassland birds of converting marginal cropland to switchgrass biomass production.Biomass Bioen-ergy25:167–175.
31. McLaughlin SB, Kszos LA (2005) Development of switchgrass (Panicum virgatum) as a bioenergy feedstock in the United States.Biomass Bioenergy28:515–535. 32. Isaacs R, Tuell J, Fiedler A, Gardiner M, Landis D (2009) Maximizing
arthropod-mediated ecosystem services in agricultural landscapes: The role of native plants.Front Ecol Environ, 10.1890/080035.
33. Robertson GP,et al.(2008) Sustainable biofuels redux.Science322:49 –50. 34. Williams IS, van der Werf W, Dewar AM, Dixon AFG (1997) Factors affecting the relative
abundance of two coexisting aphid species on sugar beet.Agric Forest Entomol 1:119 –125.
35. U.S. Department of Agriculture (1999, 2002, 2005, 2008)Crop Production Summary Reports(National Agricultural Statistics Service, Washington DC).
36. Song F, Swinton SM, DiFonzo C, O’Neal M, Ragsdale DW (2006)Staff Paper 2006-24, Department of Agricultural Economics(Michigan State University, East Lansing). 37. Freeman AM (2003)The Measurement of Environmental and Resource Values: Theory
and Methods(Resources for the Future, Washington DC), 2nd Ed, pp 259 –267. 38. Bockstael NE, Freeman AM, Kopp RJ, Portney PR, Smith VK (2000) On measuring
economic values for nature.Environ Sci Tech34:1384 –1389. 39. Pearce D (1998) Auditing the earth.Environment40:23–28.
40. US Department of Agriculture (2006/2007)Agricultural Chemical Usage Field Crops Summary(National Agricultural Statistics Service, Washington DC).
41. US Department of Agriculture (2008)Data Sets: Organic Production(Department of Agriculture Economic Research Service, Washington DC).
42. Ash M, Dohlman E (2008)Oil Crops Outlook(Department of Agriculture Economic Research Service, Washington, DC).
SUSTAINABILITY