PROCEEDING
3
rd
PARAHYANGAN ACCOUNTING AND
BUSINESS CONFERENCE
(3
rd
PIABC)
Authors:
Call for Paper Participants of the 3
rdPIABC
Publisher:
Accounting Department, Faculty of Economics, Parahyangan Catholic
University
Jalan Ciumbuleuit 94, Bandung, West Java, Indonesia
Tel: +62222041964
The 3rd Parahyangan International Accounting and Business Conference
Published by:
Accounting Department, Faculty of Economics, Parahyangan Catholic University PIABC (Parahyangan International Accounting and Business Conference)
Copyright © PIABC 2017
All rights reserved. No part of this work may be reproduced in any form or by any means without written permission from Accounting Department, Faculty of Economics, Parahyangan Catholic University
Reviewers:
Prof. Dr. Hamfri Djajadikerta, Drs., Ak., M.M. (Parahyangan Catholic University)
Prof. Indra Wijaya Kusuma M.B.A., Ph.D. (Gajah Mada University)
Prof. Dr. Sukrisno Agoes, Ak., M.M., CPA., CA. (Tarumanagara University)
Prof. Dr. Unti Ludigdo, Ak. (Brawijaya University)
Prof. Dr. Marcelia Susan Karnadi, SE., MSIE. (Maranatha Christian University)
Prof. Meine Pieter van Dijk, PhD. (UNESCO-IHE Institute)
Prof. Jeong-Dong Lee, B.S., M.S., Ph.D. (Seoul National University)
Prof. Madya Mahfudzah Mohamed, B.A., M.A. (University Teknologi MARA - UiTM)
Agus Gunawan, Ph.D. (Parahyangan Catholic University)
Dr. Amelia Setiawan, SE., M.Ak., Ak., CISA. (Parahyangan Catholic University)
Ani Wilujeng Suryani, S.E, M. Acctg.Fin., Ph.D.(c) (University of South Australia)
Dr. Bambang Wiharto (University of Indonesia)
Dr. Budiana Gomulia, Dra., M.Si. (Parahyangan Catholic University)
Dr. Budi Frensidy, S.E., M.Com. (University of Indonesia)
Dr. Chaerul D. Djakman, S.E., Ak., M.B.A. (University of Indonesia)
Dr. Elizabeth Tiur M., Dra., Ak., M.Si. (Parahyangan Catholic University)
Dr. F. X. Supriyono, Drs., M.M. (Parahyangan Catholic University)
Dr. rer. pol. Hamzah Ritchie, Ak., CA. (Padjadjaran University)
Hilda Masniaritta Pohan, Ph.D. (Parahyangan Catholic University)
Iman Harymawan, S.E., M.B.A., Ph.D. (Airlangga University)
Dr. Istiharini, S.E., M.M. (Parahyangan Catholic University)
Ivantia S. Mokoginta, Ph.D. (Parahyangan Catholic University)
Januarita Hendrani, Dra., M.A., Ph.D. (Parahyangan Catholic University)
Dr. Jol Stoffers, M.B.A. (Zuyd University)
Dr. Judith F. Pattiwael, Dra., MT. (Parahyangan Catholic University)
Dr. Law Siang Hook (University Putra Malaysia)
Dr. Ludovicus Sensi Wondabio, CPA. (University of Indonesia)
Dr. Majidah, S.E., M.Si. (Telkom University)
Dr. Maria Widyarini (Parahyangan Catholic University)
Dr. Miryam B. L Wijaya, Dra., M.A. (Parahyangan Catholic University)
Dr. Paulina Permatasari, S.E., M.Ak., CMA., CSRS., CSRA. (Parahyangan Catholic University)
Sandra Sunanto, Ph.D. (Parahyangan Catholic University)
Suyanto, S.E., M.Ec.Dev., Ph.D. (University of Surabaya)
Dr. Sofian Soegioko, M.M. (Unika Atma Jaya Jakarta)
Dr. Sylvia Fettry E.M., S.E., S.H., M.Si., Ak. (Parahyangan Catholic University)
Dr. Theresia Gunawan (Parahyangan Catholic University)
Dr. Urip Santoso (Parahyangan Catholic University)
Dr. Wing Wahyu Winarno, MAFIS, CA, Ak. (STIE YKPN Yogyakarta)
Yudho Giri Sucahyo, Ph.D, CISA, CISM, CEP-PM, CSRS. (University of Indonesia)
organize the 3rd Parahyangan International Accounting and Business Conference 2017 and thus this proceeding can be published accordingly.
We are very thankful to the Association of Chartered Certified Accountants (ACCA), especially ACCA Indonesia, who has been our co-host in organizing this event. Your help, support and contribution is highly appreciated. We look forward to having a long-lasting relationship and cooperation with ACCA.
The conference carries the theme ―The Future of Accounting and Business in Rapid Development of Information Technology‖. As we are all aware of, globalization has encouraged all parties to adapt to the changing situation in order to keep their existence. Those who are able to adjust themselves to the rapid changes that are happening nowadays will be left behind or even will not be able to keep the business going into the future. In contrast, those who are adaptive and have the ability to utilize opportunities in the marketplace will become pioneers in the competition.
The rapid development of information technology is inseparable from the globalization itself. Faster information processing, easier access to information and lower information processing costs have caused the mass increase in the availability of information. This should be considered as an opportunity instead of a threat.
Accounting is an important factor for organizations to remain competitive in the globalization era. Technology also plays a major role in transforming the role of accounting in this era. What used to be a bookkeeping function has now evolved into an engine to achieve competitive advantage. This transforming role of accounting in the globalization era will certainly affect the business world. This warrants further research or study by academicians or practitioners so that we can understand and better prepare ourselves to face the dynamic world we are now living in. The fast-paced advancement of technology can also become an interesting area to be analyzed to predict how far the role of accounting is in the business world will change in the future.
We are very thankful to all parties who have supported and made this event possible, to name a few: all the committee members including our students, partners, sponsors, reviewers, speakers, paper authors, presenters, and to all other parties that cannot be mentioned one by one. To all paper authors, we believe that your research result will bring contributions to each respective field of knowledge.
We apologize for any inconvenience that might occur during the event. Hopefully the proceedings would contribute to the advancement of knowledge in relevant fields.
Best regards,
iv
piabc.fe.unpar.ac.id
TABLE OF CONTENTS
GREETINGS ... iii TABLE OF CONTENTS ... iv COMMON IDIOSYNCRATIC VOLATILITY IN INDONESIA ...1 COMPARISON OF USER EXPERIENCE ON GO-JEK AND GRAB MOBILE APPS (A STUDY ON PT. GO-JEK AND PT. GRAB INDONESIA CONSUMERS IN DKI JAKARTA) ...14 ―WHAT‘S WROζG WITH A PHEζOεEζOζ UζDERPRICIζG?‖ ...31 MANAGEMENT OWNERSHIP AND STOCK PRICE INFORMATIVENESS IN INDONESIA STOCK MARKET ...48
THE EFFECT OF MUDHARABAH AND MUSYARAKAH ON THE
PROFITABILITY OF ISLAMIC BANKS ...69 FOREIGN HOLDING COMPOSITION AND EXCHANGE RATES IN INDONESIA ...85 E-PROCUREMENT IMPLEMENTATION AND BUDGET ABSORPTION IN INDONESIAN LOCAL GOVERNMENT...115
ORGANIZATIONAL LEARNING AS INTERVENING VARIABLE ON
ASSOCIATION OF IT COMPETENCE TO PERFORMANCE OF PUBLIC SECTOR ENTITIES: AN EMPIRICAL STUDY AT SIMDA OF BOGOR LOCAL GOVERNMENT...137 RESPONSIBILITY DESIGN MODEL & FINANCIAL DISCLOSURE BASED ON
WEB-ICT WITH INDEX FULL DISCLOSURE METHOD FOR GOOD
v
piabc.fe.unpar.ac.id
vi
piabc.fe.unpar.ac.id
SIMAKU®-SEKOLAH: THE IMPLEMENTATION OF MANAGEMENT
INFORMATION SYSTEMS AND ACCOUNTING FOR SCHOOL SOFTWARE
USING WEB-BASED APPLICATIONS TO ACHIEVE GOOD SCHOOL
vii
piabc.fe.unpar.ac.id
1
piabc.fe.unpar.ac.id
COMMON IDIOSYNCRATIC VOLATILITY IN INDONESIA
Pratiwi Noviayanti Zaafri Husodo
Graduate School of Management, Faculty of Economics and Business, Universitas Indonesia, Depok, Indonesia
Abstract
This research aims to examine a factor structure in idiosyncratic volatility and how the shock from common idiosyncratic volatility (CIV) is priced in Indonesia. This study is not only to determine the effect of idiosyncratic volatility, but also to know how the factor structure of idiosyncratic volatility and the exposure of CIV shock on firm. As the research on emerging markets, especially Indonesia, is still yet recorded in literature regarding common idiosyncratic volatility. Idiosyncratic volatility in this study is calculated as variance of residuals from market model regression, and estimated using EGARCH method because of the nature of volatility that has time varying behavior. The study found that there is no significant results in CIV-beta investment strategy and show that changes in CIV is not priced as common factor that explain stock returns in Indonesia.
Keywords: firm volatility, idiosyncratic risk, cross-section of stock returns, emerging market JEL Classification: B59
INTRODUCTION
2
piabc.fe.unpar.ac.id
is used to induce investors with risk averse to invest their money in risky assets rather than risk free assets.
At first, investor just look at market risk that has systematically effect (systematic risk), meanwhile risk that come from individual stock is not priced because it has no effect to other stocks and market systematically (unsystematic risk). Some of financial experts argued that risks involved with stocks or assets can be minimized by portfolio diversification so the total risk can close to zero. Unfortunately diversify a portfolio is not easy and not all investors have diversified portfolio.
This unsystematic risks involve with stocks or assets is known as idiosyncratic risks. Although this risks can be eliminated or minimized by diversification, there are always risks that cannot be diversified because of market imperfection, then there is always a compensation for investors that hold undiversified assets. Idiosyncratic risks have become center of interest some of asset pricing researchers and recently has been studied in the form of volatility called idiosyncratic volatility (IVOL).
There are some empirical studies about idiosyncratic risks, unfortunately the results of those studies is still inconsistent and become puzzle until now, even though most the results of studies indicate the importance of idiosyncratic risk. Some researchers such Xu & Malkiel (2003), Goyal & Santa-Clara (2003), Jiang & Lee (2006), Fu (2009), Huang et al. (2010), and Miffre et al. (2013) contended that there is positive relationship between IVOL and stock returns. Meanwhile Ang et al. (2006) and Guo & Savickas (2006) contended that there is negative relationship, the others even concluded that there is no significant relationship between IVOL and stock returns as reported by Bali & Cakici (2008) and Bradrania et al. (2015).
3
piabc.fe.unpar.ac.id
Study of idiosyncratic volatility mostly done in developed markets, study in emerging markets is still not many seen in the literature. Nartea el al (2011) pointed that it is not equal if generalizing the results about idiosyncratic volatility in developed and emerging markets. Their study found positive relation between IVOL and stock return in four country in South East Asia, Singapore, Thailand, Malaysia, and Indonesia. This result give some evidence that IVOδ‘s effect on stock return in some of emerging markets in Asia and even developed markets such as Singapore give different sign of effect from evidence in US (United States).
The aim of this study is to find the exposure of firm on common idiosyncratic volatility (CIV). The study about CIV recently done on developed markets (US), this CIV term was introduced by Herskovic et al. (2016). CIV is a proxy of all firms idiosyncratic volatility by averaging IVOL across firms, this was done by Herskovic et al. (2016) because of their found on synchronized IVOL of US firms. Therefore, this study will explore the exposure of change in CIV (CIV-shocks) in affecting average stock returns, whether the exposure of CIV-shocks has the same effect as the effect in developed markets. Another aim of this study is to find if the exposure will be different if the proxy of IVOL used on this research is expected IVOL rather than realized or lagged IVOL.
LITERATURE STUDY
Idiosyncratic Risk
Malkiel and Xu (2002) showed that the volatility of individual stock increase over time. Their study also pointed that idiosyncratic volatility had an effect on stock return with condition that idiosyncratic volatility can affect the stock return if all investors do not have diversified portfolio.
Goyal and Santa-Clara (2003) reported the positive relation between idiosyncratic risk, that had average stock risk as a proxy, and return of stocks. They explained that investor hold the non-traded assets that increase risk of investor so then increase the investors‘ expectation for bigger return as the compensation.
4
piabc.fe.unpar.ac.id
higher the return. His study not only study the idiosyncratic risk but also aggregate volatility risk, or market risk, the result showed the bigger the sensitivity against the volatility of risk, gave lower average return on the portfolio that sorted on idiosyncratic volatility. Based on the result, they contended that the cause is the sensitivity of stock on the aggregate volatility risk. They also argued that previous study did not examine idiosyncratic volatility on the firm level or did not sorting portfolio based on idiosyncratic volatility (IVOL). Guo & Savickas (2006) also found the negative relationship between IVOL and stock return, same conclusion with Ang et al. (2006, 2009). The difference of both study lie on the positive relation with aggregate volatility risk.
However Bali & Cakici (2008) did not found a significant relationship between idiosyncratic risk and stock return. Even after verified the weakness on the study of Goyal & Santa-Clara (2003) in the previous study, they did not find any significant relation between idiosyncratic risk and the stock return on the portfolio measured with value weighted (Bali et al., 2005).
Expected Idiosyncratic Volatility & Common Idiosyncratic Volatility
Fu (2009) used EGARCH model to estimate the expected idiosyncratic volatility and found a positive relations between IVOL and stock return. He argued the IVOL that usually used in the previous study is realized IVOL and not the expected IVOL that has time series property or volatile over time. This result contradict with conclusion from Ang et al. (2006, 2009) that showed the negative relation. Fu (2009) argued that used of the expected IVOL should on the same period with the expected return not on the one lagged month period, and the negative relation on the conclusion of Ang et al. (2006, 2009) can be caused by the effect of return reversal Huang et al. (2010).
Miffre et al. (2013) indicated that investor demand for additional return when holding undiversified portfolio. Their study explained idiosyncratic volatility on portfolio sorted on size and value weighted, the result still robust even after controlling some factors based on size, value, past performance, liquidity and total volatility.
5
piabc.fe.unpar.ac.id
was not found any significant relation. This result more or less similar with the result from Bali et al. (2005), the difference lie on the use of portfolio measurement, when Bradrania et al. (2015) use equally weighted and Bali et al. (2005) use value weighted.
One of the latest study about idiosyncratic volatility (IVOL) found that IVOL of US firms are synchronized. This research was done by Herskovic et al. (2016) revealed the commonality on the factor structure of IVOδ if there is a synchronization between firms‘ IVOL and explained for the existence of common idiosyncratic volatility (CIV) between firms. Their study showed that CIV is priced as one of assets pricing factor in US, the lower the exposure on CIV-shocks (negative CIV-beta) the higher the stock return rather than higher CIV-beta. More than evidence on stock return, CIV has relation with household labor income.
Idiosyncratic Volatilityin Emerging Markets
Nartea et al. (2011) studied the relation of IVOL and stock return on South East Asian emerging markets, such as Malaysia, Singapore, Thailand, Indonesia, and Philippines. The study verify positive relation between idiosyncratic risk and stock return, using standard deviation of residual on Fama-French regression as idiosyncratic volatility. However Nartea et al. (2013) found new evidence using stock data from China, they found negative relation between idiosyncratic risk and stock return on emerging market. They argued that IVOL in China is periodic-specific coincide with regime shift and structural market reforms.
6
piabc.fe.unpar.ac.id
METHODS
Data
Stock price data that used on this study consists of daily and monthly data frequency on firms that is registered on Jakarta Stock Exchange and data of Indonesia stock market index. The risk free rate use SPN (Surat Perbendaharaan Negara) or Treasury of Indonesian Government 3 month rate that has similar characteristics to US T-bill rate. Used data is secondary data with a sample of non-finance firms and still active in Indonesia Stock Exchange. The sample period is from January 2001-August 2016, this sample is taken to find how the exposure on CIV affecting stock returns in a quite long period of time, rather than super long period time that usually used in analysing developed markets.
Research Method
Expected Idiosyncratic Volatility
Idiosyncratic volatility (IVOL) that is estimated on this study is an IVOL that varies over time, according to Fu (2009) expected IVOL varies and volatile over time so it can produce positive relation between IVOL and stock returns. Expected IVOL estimate use EGARCH (p,q) method suggested by Fu (2009).
(ri-rf)t=α+ i, t(Rm-rf)t+ i,t (3.1) i,t~ζ(0, itβ)
7
piabc.fe.unpar.ac.id
Common Idiosyncratic Volatility
After obtaining IVOL, CIV (Common Idiosyncratic Volatility) is calculated as average of IVOL across the firms. Then obtaining CIV-beta and MV-beta from regressing excess return on CIV-shocks (changes of CIV per month) and MV-shocks (changes of MV per month) with 60 month rolling window regression.
(ri-rf)t=α+ CIVstCIVst+ εVstεVst+ i,t (3.3)
Model (3) explain the effect of CIV-shocks on excess return (Ri-rf)t for stock i on period t. CIVst is CIV-shocks on period t. Meanwhile MVst is MV-shocks on period t. Parameter CIVst is the exposure of firms on changes in CIV or called CIV-beta and εVst is the exposure of firms on changes in MV or called MV-beta. This betas are used on sorting portfolio each month to find average return on portfolio quintiles.
RESULTS
Idiosyncratic volatility is described as firm level volatility that is considered not important in determining stock return and can be minimized or neutralized by portfolio diversification. In fact, in some countries, specifically in developed markets such as US, idiosyncratic volatility is proved to be matters either with significant negative or positive relations. This study will attempt to prove if exposure on changes in CIV (common idiosyncratic volatility) is matter and can be priced in Indonesia. The table below describe the descriptive statistics of variables used in this study.
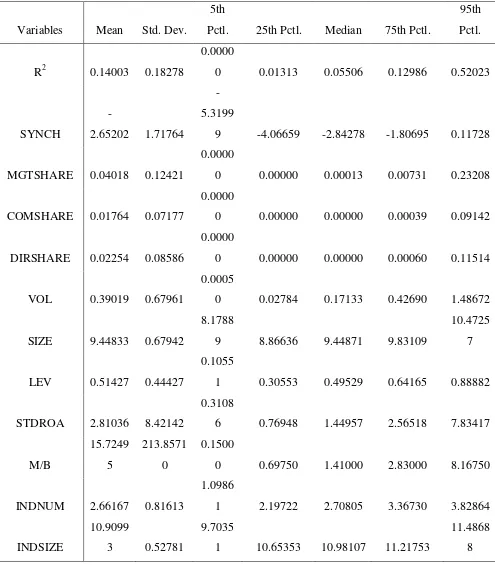
Table 1. Descriptive Statistics of Variables
Xret CIVS MVS CIV MV
Mean 0.016476 5.77E-05 -5.4E-05 0.160646 0.085517
Std Deviation 0.194321 0.009227 0.011975 0.011454 0.025875
Median -0.00349 -0.00031 -0.0031 0.158462 0.07664
Max 5.471562 0.023555 0.091287 0.195157 0.208943
Min -0.72272 -0.02717 -0.0221 0.139108 0.058208
8
piabc.fe.unpar.ac.id
Descriptive statistics of variables can be seen on table above, the analysis give the picture of mean, standard deviation, maximum and minimum value, and skewness of variables in period of analysis. The mean for monthly stock return in excess of risk free rate return is around 1,7% per month. The independent variable for regression is CIVs (common idiosyncratic volatility-shocks) and MVs (market volatility-shocks), mean for CIVS is the average of monthly changes on CIV is around 0.00577% and the average of monthly changes on MV is around -0.0054% per month. The variables that had been used for analysis have positive skewness, except for CIVs that has negative skewness.
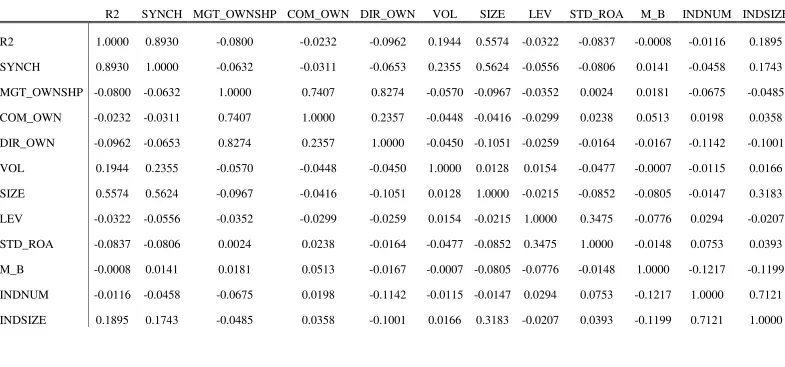
Figure 1. Common Idiosyncratic Volatility
9
piabc.fe.unpar.ac.id
The CIV is used to examine the exposure of stock returns on changes of CIV, called beta. The beta was estimated by regressing return in excess of risk free rates on CIV-shocks and MV-CIV-shocks using 60 month rolling window regression to get CIV- and MV-beta each month. The estimated beta then used in sorting stocks into quintiles to form equally weighted portfolio.
Table 2 show the portfolio formed on CIV-beta with different methods of sorting. Panel A is portfolio formed with one way sort on CIV-beta. Meanwhile Panel B is one way sort on CIV-beta controlling of MV-beta, following steps from Herskovic et al. (2016) by collapsing double sorted portfolio on MV-beta and CIV-beta, and Panel C is double sort or two way sort on MV-beta and CIV-beta. This portfolio-based approach is the easiest way to interpret returns on feasible investment strategy, by sorting stocks into portfolio based on variables give a simple picture if the returns is increasing or decreasing on independent variables. The most feasible investment strategy that can be seen is the zero investment strategy that start with long in high CIV-beta and short in low CIV-beta.
Table 2. Portfolios formed on CIV-beta
Panel CIV1 CIV2 CIV3 CIV4 CIV5 Q5-Q1 t(5-1)
A: One way sort on CIV-beta
25.835 22.083 17.401 15.754 18.565 -7.27 -0.1752 B: Sort on CIV-beta controlling for MV-beta
21.58 24.85 19.30 13.28 20.67 -0.91 -0.113
C: Double sorting on CIV-beta & MV-beta
MV1 5.895 3.925 23.06 4.503 9.476 3.581 -0.064
MV2 19.479 17.222 9.87 24.584 25.199 5.721 -0.026
MV3 21.327 10.928 18.246 6.267 6.738 -14.589 -1.491
MV4 15.931 26.472 10.849 14.789 21.518 5.587 0.592
MV5 6.856 9.818 10.886 -4.186 22.87 16.015 0.429
Q5-Q1 0.961 5.893 -12.174 -8.689 13.395 - -
t(5-1) 0.086 0.538 -1.424 -1.513 0.529 - -
10
piabc.fe.unpar.ac.id
Portfolio on Panel A with one way sort on CIV-beta show decreasing average returns in CIV-beta. The stocks on lowest CIV-beta (CIV1) give more returns than any stocks in other quintiles, meanwhile the lowest return is seen in the second highest CIV-beta (CIV4). Overall the results can say that the returns is decreasing in CIV-beta, this can be seen at the zero investment strategy (5-1) show the similar results showed in Herskovic et al. (2016), where the return of strategy is negative return which means that the lowest CIV-beta has higher return than highest CIV-beta portfolio. Similar results seen in Panel B, CIV-beta sorted portfolio controlling for MV-beta, even after controlling the exposure on market volatility.
This is similar results from Herskovic et al. (β016) with United States‘ IVOδ, that has return‘s pattern monotically decreasing in CIV-beta. Fu (2009) suggested that the patterns of return that monotically increasing or decreasing across the IVOL portfolio were completely driven by small stocks with high idiosyncratic volatility. The results on Herskovic et al. (2016) may followed this suggestion, as they did not report robustness results that explained about group of small stocks. Even though similar, the significance on investment strategy do not show any significancy in both of the panels.
In panel C, the excess returns is double sorted on CIV-beta and MV-beta (5 by 5). These portfolios is the same portfolio with the one described for controlling MV-beta. The results is reversed version on two other panels, the zero investment strategy on CIV-beta is earning positive average returns within each MV-beta quintile, except the Q5-Q1 strategy in the third quintile of MV-beta that earned negative average return. The inconsistency of the results between panel on single and double sorting was clarified on the t-stat of the investment strategy that did not show any significancy. This results is different from what Herskovic et al. (2016) found, that there is reverse effect on zero investment (Q5-Q1) CIV-beta strategy and MV-CIV-beta strategy where the CIV-CIV-beta investment strategy has significant results and the MV-beta strategy was not significant.
11
piabc.fe.unpar.ac.id
significant. This can be caused by return reversal from the previous month that has positive returns especially from small stocks that have high IVOL as argued by Fu (2009).
In case of Indonesia, investor may not see many benefits in diversify portfolio based on its IVOL moreover its exposure against changes in CIV as the there is no significancy on the investment strategy. Yunengsih and Husodo (2014) pointed that idiosyncratic volatility cannot predict stock return in Indonesia even in short or long periods. Even after using the EGARCH method for expected IVOL estimation, the exposure of idiosyncratic volatility did not have any significant effect on average stock returns. This results is in accordance to Bali & Cakici (2008) where found no significant evidence in the relation of return and idiosyncratic volatility. Indicating that CIV factor did not have the ability to explain stock returns associated with CIV-beta sorted portfolio in emerging markets such as Indonesia and not being considered by investors.
CONCLUSION
Even if the CIV is priced in the cross-section of stock returns in US as developed markets, the effect of CIV will not the same if the factor is analysed in emerging market as Indonesia. The results of study found that there is no significancy on CIV-beta (exposure of changes in CIV) investment strategy even after controlling on exposure of market volatility-beta. This result conclude that changes in CIV or CIV-shocks is not priced in the cross-section of stock returns in Indonesia. Investor may not consider any benefits in calculating firm level volatility as the factor that explain stock returns in Indonesia.
REFERENCES
Ang, A., Hodrick, R. J., Xing, Y., & Zhang, X. (β006). ―The Cross Section of Volatility and Expected Return‖. The Journal of Finance, 61(1), pp. 259-299
Ang, A., Hodrick, R. J., Xing, Y., & Zhang, X. (β006). ―High Idiosyncratic Volatility and δow Returns: International and Further US Evidence‖. Journal of Financial Economics, 91(1), pp. 1-23
12
piabc.fe.unpar.ac.id
Bali, T. G. & Cakici, ζ. (β008). ―Idiosyncratic Volatility and the Cross-Section of Expected Returns‖. Journal of Financial Quantitative Analysis, 43(1), pp. 29-58
Bradrania, ε. R., Peat, P., & Satchell, S. (β015). ―δiquidity costs, idiosyncratic volatility and expected stock returns‖. International Review of Financial Analysis, 42, pp. 394-406 Brooks, C. (2014). Introductory Econometrics for Finance. Cambridge University Press:
United Kingdom.
Campbell, J. Y., δettau, ε., εalkiel, B. G., & Xu, Y. (β001). ―Have individual stocks become more volatile? An empirical exploration of idiosyncratic risk‖. The Journal of Finance, 56 (1), pp. 1-43
Fu, F. (β009). ―Idiosyncratic risk and the cross-section of expected return‖. Journal of Financial Economics, 91, pp. 24-37
Goyal, A. & Santa-Clara, P. (β00γ). ―Idiosyncratic Risk εatters!‖. The Journal of Finance, 57 (3).
Guo, H. & Savickas, R. (β006). ―Idiosyncratic volatility, stock market volatility, and expected stock returns‖. Journal of Business & Economic Statistics, 24 (1), pp. 43-56 Herskovic, B., Kelly, B., δustig, H., & Van ζieuwerburgh, S. (β016). ―The common factor in
idiosyncratic voaltility: Quantitative asset pricing implications‖. Journal of Financial Enonomics, 119, pp. 249-283
Huang, W., δiu, Q., Rhee, S. G. & Zhang, δ. (β010). ―Return reversals, idiosyncratic risk, and expected returns‖. The Review of Financial Studies, 23 (1), pp. 147-168
Malkiel, B. G. & Xu, Y. (β00β). ―Idiosyncratic risk and security returns‖. Working Paper. Dallas: University of Texas.
εiffre, J., Brooks, C., & δi, X. (β01γ). ―Idiosyncratic volatility and the pricing of poorly -diversified portfolios‖. International Review of Financial Analysis, 20, pp. 78-85 εurhadi, W. R. (β01γ). ―Pengaruh Idiosyncratic Risk dan δikuiditas Saham Terhadap Return
Saham‖. Jurnal Manajemen dan Kewirausahaan, 15 (1), pp. 33-40
13
piabc.fe.unpar.ac.id
ζartea, G. V., Wu, J., & δiu, Z. (β01γ). ―Does Idiosyncratic volatility matter in emerging markets? Evidence from China‖. Journal of International Financial Markets, Institution, and Money, 27, pp. 137-160
Xu, Y. & εalkiel, B. G. (β00γ). ―Investigating the Behavior of Idiosyncratic Volatility‖. The Journal of Business, 76 (4), pp. 613-645
14
piabc.fe.unpar.ac.id
COMPARISON OF USER EXPERIENCE ON GO-JEK AND GRAB MOBILE APPS (A STUDY ON PT. GO-JEK AND PT. GRAB INDONESIA CONSUMERS IN DKI
JAKARTA)
Maulydia Maharani Arianis Chan Pratami Wulan Tresna
Business Administration, Padjadjaran University [email protected]
[email protected] [email protected]
Abstract
This research examines the comparison of user experience between two mobile apps: Go-Jek and Grab by conducting a survey to look for differences in the experience perceived by one group of users of both applications. User experience is measured through the variable of sub-happiness, task success, earnings and uptime. The method used in this research is descriptive comparative analysis with quantitative approach. The sampling technique is done by accidental sampling based on spontaneous factors that involve the samples being drawn from the part of population that is close to hand. The number of samples is determined by using iterations at the amount of 63 respondents. The research object is user experience. The analysis of the data in this research uses paired t-test.
The result of this research shows that the t-value obtained, 2.420, is greater than t-table with
df = 67 by 1.996, H0 is rejected. So it is found that these mobile apps (Go-Jek and Grab)
have differences regarding their User Experience.
Based on the results, the writers suggest Go-Jek to do more maintenance of the application to reduce the errors that still exist for the use in rush hour. The writers also suggest Grab Indonesia to add features to improve application’s reliability.
15
piabc.fe.unpar.ac.id
INTRODUCTION
In an economic life of a country, information technology takes an important role because information technology advancement will improve the ability of productivity in the world of industry particularly in the field of information technology-based creative industry (Suciseptia, 2014). It can be seen from the emergence of various mobile applications in Indonesia both national and international products in which every year, the growth is significant. One of the software on internet utilized in marketing communication activities and brand establishment is an app. Nowadays, some companies at least have applications for their brands and products, both company and e-commerce apps.
According to Fenech and O‘Cass (β001), ―a representation of brand can influence consumer perception toward the brand so that marketers have to ensure the elements that exist on the site/app software can be a positive representation both in aesthetics and in providing what is perceived by the consumers.‖ A good representation can be created by forming a good experience. As what Schmitt (2008: 113) said, the only valid aim at marketing is the creation of valuable customer experience. It also applies in the world of internet. The experience perceived by users in engaging certain technology, including internet and sites, is known as user experience (Garrett, 2011: 6).
A rapid internet technology development causes change in public society. Many business start to appear by engaging the internet technology development. One of them is the business in service provider-based app in the field of online-based transportation mode that apparently can give solutions and answer various public worries about public transportation service. Traffic jam in big cities and public suspense with public transportation safety are solved with the existence of online transportation apps that provide ease and convenience for their users.
16
piabc.fe.unpar.ac.id
The level of rivalry of Go-Jek and Grab is getting higher. Those two companies have grown rapidly both in term of the number of rides for transportation service and app development on each company. Currently, Go-Jek app has been downloaded nearly ten million times both at Google Play Store and App Store (iOS). As a tough competitor of Go-Jek in this business, Grab app has been downloaded almost ten million times through Android smartphone. This app can also be downloaded on Apple and Blackberry (webhouzz.com, retrieved on January 2017).
These companies are innovating by developing offered features beside transportation service to fulfill the need of life style and logistics in one app. Go-Jek adds other services beside ojek transportation service, namely Go-Car, Go-Food, Go-Mart, Go-Send, Go-Box, Go-Pulsa, Go-Massage, Go-Clean, Go-Glam, Go-Tix, Go-Auto, Go-Med, and Go-Busway (Go-Jek.com, retrieved on December 20th 2016). Meanwhile, Grab provides ojek transportation service named GrabBike. Grab is also innovating by adding GrabTaxi, GrabCar, GrabExpress, GrabFood, GrabHitch, and its latest feature namely GrabChat to ease communicating between customers and driver partners (Grab.com, retrieved on December 20th 2016).
In this competition condition, the companies keep making effort to raise customer loyalty. Therefore, there needs to be a strategy as differentiation for each company in attracting customer interest and maintaining customers in order to keep using the company‘s service in the future.
Based on the background, the writers are interested to conduct a research entitled:
Comparison of User Experience on Jek and Grab Mobile Apps (A Study on PT. Go-Jek and PT. Grab Indonesia Consumers in DKI Jakarta).
LITERATURE REVIEW
User Experience
17
piabc.fe.unpar.ac.id
experience offered is a success indicator of a site. Evaluating through UX approach functions to know what is perceived by users, whether users are happy or not, to gain ease, to get suppression feeling or satisfaction while using an app system.
Figure 1. Three aspects on UX
Source: Hassenzahl & Tractinsky, pg. 95 (2006)
Definition of ‗experience‘ according to Aaker (β000) is:
―The experience perceived by consumers through participation and involvement on internet has a stronger possibility than the experience perceived by consumers from other conventional media, so that it can be said that the quality of user experience on a site can affect the whole feeling, trust, and user assessment associated to a brand and it is strongly remembered compared to experience through other media.‖
Online marketers can influence the process of virtual consumer design by delivering a good online experience; web experience; that is functional combination, information, feeling, clue, stimulus, and product or online service. In other words, running complex mixed marketing is more than traditional mixed marketing. User experience while online occurs with companies in cyberspace as the result of exposure to a combination to idea, feeling, and impulse due to the other marketing design and elements on online presentation (Constantinides, 2004).
18
piabc.fe.unpar.ac.id
―…is regarded as a comprehensive concept describing the subjective experience resulting from the interaction with technology. Although the concept of UX is still rather young, there are a few common key assumptions that are widely accepted: UX is generally agreed to depend on the person (i.e. subjective) and contextual factors like physical, social and cultural aspects in the situation of use, and to be dynamic and temporally evolving over the instances of use."
In this research, the data collection uses HEART and PULSE framework to gain information about users. HEART is a framework that identifies the quality of UX. HEART framework is used to measure from the side of users, how users‘ feeling when using a mobile app. PULSE is a framework used for measurement in a big scale and focuses on business or technical aspects of a product (Rodden, Hutchinson, and Xin Fu, 2010). Both frameworks are chosen because they have measurement components that can measure all aspects related to user experience when using a mobile app and they can be used to measure UX that needs deep material questions.
The user experience measurement in this research refers to the research of HEART and PULSE factors elaborated according to Rodden, Hutchinson, and Xin Fu (2010) by using four instruments in which having indicators as follow:
1. happiness: satisfaction, visual attraction, possibility of recommendation, and perception of customer convenience;
2. task success: efficiency (for instance time to finish tasks), effectiveness (for instance percentage of finished tasks), and level of mistake occurred;
3. earning: perception of users toward benefits and advantages earned in accessing app; and
4. uptime: perception of users toward guarantee of information availability and feature reliability.
19
piabc.fe.unpar.ac.id
answer why the design is produced like that, a design that is able to make users feel convenient when it succeeds obtaining its objectives when using a product.
Based on the information above, there will be a test to examine the phenomenon. Systematically, the writers depict a comparison of two research objects; they are the experience perceived by users on Go-Jek and Grab mobile apps and the instruments attached to the variables based on the theory used by the writers as follow:
Figure 2. Framework Chart
explanation:
: observed : not observed Source: organized by the writers, 2017
HYPOTHESIS
Based on the framework above, the hypothesis of this research are:
1. there is difference of Happiness on Go-Jek and Grab mobile apps for users in DKI Jakarta;
2. there is difference of Task success on Go-Jek and Grab mobile apps for users in DKI Jakarta;
3. there is difference of Earning on Go-Jek and Grab mobile apps for users in DKI Jakarta;
Human Computer Interaction
Shneiderman & Plaisant (2005)
User Experience
Menurut Rodden, Hutchinson, Xin Fu (2010)
Happiness Task Success
Earning Uptime
Mobile Apps
20
piabc.fe.unpar.ac.id
4. there is difference of Uptime on Go-Jek and Grab mobile apps for users in DKI Jakarta; and
5. there is difference of ser experience on Go-Jek and Grab mobile apps for users in DKI Jakarta.
RESEARCH METHOD
This research is conducted on two apps (Go-Jek and Grab) with their own different characteristics. The reason of choosing these companies is because the companies have a similar position, especially in the number of app users within the top position particularly in DKI Jakarta. Therefore, by comparing them, the writers will identify the difference in term of experience perceived by users from both apps.
Research design used by the writers in this research is survey method because the writers take sample from one of population and collect the data using questionnaire. According to Ridwan (2011: 49), a survey research is usually conducted to gain a generalization from deep observation but the generalization can be more accurate if the research uses a representative sample.
Survey method is a method conducted on both big and small population by using questions or statements toward the issue related to the topic being studied. The type of method used in this research is descriptive comparative with quantitative approach. According to Sugiyono (2011: 147), a descriptive method is:
―Descriptive statistics is a statistics used to analyze data by describing or depicting collected data as it is, without intending to make a conclusion that applies to generalization.‖
The comparative method in this research is directed to discover whether there are differences in the aspects or variables observed within the groups of Go-Jek and Grab mobile apps users or not. To do this research, the population taken by the writer is all customers of Go-Jek and Grab mobile apps in DKI Jakarta.
21
piabc.fe.unpar.ac.id
respondents of both mobile apps users. There are characteristics of respondent in this research. They:
1. are located in Jakarta, Indonesia; and
2. have used both Go-Jek and Grab mobile apps at least two times.
Data analysis in this research engages SPSS software that aims to discover comparison between Go-Jek and Grab mobile apps user experience. The writers do a validation and reliability test first to the questionnaire so that this research can be accepted academically and be accountable.
To discover user experience comparison between Go-Jek and Grab mobile apps, the writers engage the approach of statistic descriptive analysis then they do classic assumption test.
Hypothesis Test
The hypothesis proposed in this research is user experience comparison test on Go-Jek and Grab mobile apps. In testing the hypothesis, the writers use paired t-test.
RESULTS AND DISCUSSION
Comparison of User Experience Assessment
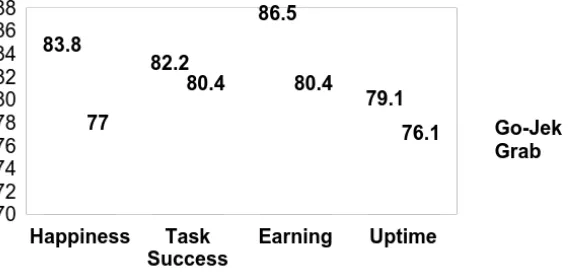
Figure 3. Chart of Comparison Mean of User Experience Variable between Go-Jek and Grab Mobile Apps
22
piabc.fe.unpar.ac.id
Figure 4. Chart of Comparison Mean of User Experience Sub-variable between Go-Jek and Grab Mobile Apps
Source: Data Processing 2017
On Figure 3, it can be seen that the mean of respondent on Go-Jek mobile app is 82.1. Meanwhile, the mean of respondent of Grab is 77.7 which is lower than Go-Jek. These values show that respondents see Go-Jek mobile app more positive than the assessment on user experience variable on Grab mobile app.
On Figure 4, it can be seen that the four sub-variables of user experience on Go-Jek mobile app are rated more than on Grab mobile app. It shows that the sub-variables that form user experience on Go-Jek mobile app are rated more positive than Grab mobile app.
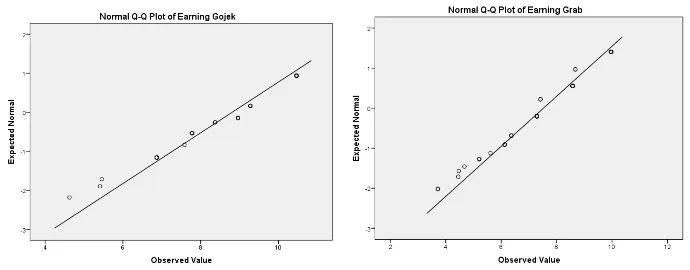
Classic Assumption Test
Before going further to comparative analysis, the writers do classic assumption test as appropriateness in comparative analysis. The assumption test that will be done is normality test.
23
piabc.fe.unpar.ac.id
Figure 5. Normality Test of Happiness Sub-variable on Go-Jek and Grab
Figure 6. Normality Test of Task Success Sub-variable on Go-Jek and Grab
24
piabc.fe.unpar.ac.id
Figure 8. Normality Test of Uptime Sub-variable on Go-Jek and Grab
Figure 9. Normality Test of User Experience Variable on Go-Jek and Grab
Based on the results above, each result of normality assumption test shows that the data spreads around diagonal lines and follows the direction of diagonal lines or the histogram charts. So, it can be concluded that the whole data group has normal distribution then difference in hypothesis test with paired t-test can be done in this research.
Hypothesis Tests
A. The decision made regarding difference in sub-variable Happiness on Go-Jek and Grab, as follow:
H0 : �1 = 0 There is no difference in Happiness on Go-Jek and Grab mobile
apps.
H1 : �1 ≠ 0 There is difference in Happiness on Go-Jek and Grab mobile
25
piabc.fe.unpar.ac.id
The basis of decision are:
a. If –t –α/β < tcount < t–α/β, H0 is accepted.
b. If –t –α/β > - tcount or t–α/β < tcount, H0 is rejected.
Table 1. Paired t-Test Result in Happiness
Based on Table 1, it can be seen that the value of tcount gained is 0.661 smaller than ttable value, with df = 67 at the amount of 1.996 then H0 is accepted. So, it can be concluded that there is no difference regarding Happiness in Go-Jek and Grab users. B. The decision made regarding difference in sub-variable Task Success on Go-Jek and
Grab, as follow:
H0 : �1 = 0 There is no difference in Task Success on Go-Jek and Grab
mobile apps.
H1 : �1 ≠ 0 There is difference in Task Success on Go-Jek and Grab
mobile apps.
The basis of decision are:
a. If –t –α/β < tcount < t–α/β, H0 is accepted.
b. If –t –α/β > - tcount or t–α/β < tcount, H0 is rejected.
Table 2. Paired t-Test Result in Task Success
26
piabc.fe.unpar.ac.id
concluded that there is difference regarding Task Success in Go-Jek and Grab users. Based on the result of mean test of paired sample statistics, it can be seen that mean value for Task Success in Go-Jek users is bigger than Task Success in Grab users. It means Task Success of Go-Jek is better than Grab.
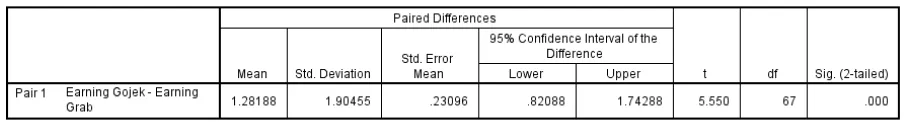
C. The decision made regarding difference in sub-variable Earning on Go-Jek and Grab, as follow:
H0 : �1 = 0 There is no difference in Earning on Go-Jek and Grab mobile
apps.
H1 : �1 ≠ 0 There is difference in Earning on Go-Jek and Grab mobile
apps.
The basis of decision are:
a. If –t –α/β < tcount < t–α/β, H0 is accepted.
b. If –t –α/β > - tcount or t–α/β < tcount, H0 is rejected.
Table 3. Paired t-Test Result in Earning
Based on Table 3, it can be seen that the value of tcount gained is 5.550 bigger than ttable value, with df = 67 at the amount of 1.996 then H0 is rejected. So, it can be concluded that there is difference regarding Earning in Go-Jek and Grab users. Based on the result of mean test of paired sample statistics, it can be seen that mean value for Earning in Jek users is bigger than Earning in Grab users. It means Earning of Go-Jek is better than Grab.
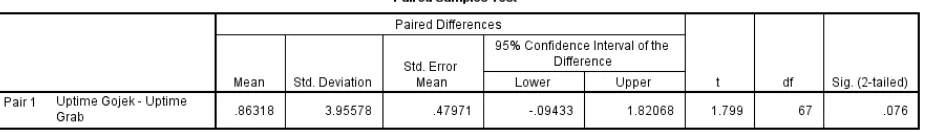
D. The decision made regarding difference in sub-variable Uptime on Go-Jek and Grab, as follow:
H0 : �1 = 0 There is no difference in Uptime on Go-Jek and Grab mobile
27
piabc.fe.unpar.ac.id
H1 : �1 ≠ 0 There is difference in Uptime on Go-Jek and Grab mobile apps.
The basis of decision are:
a. If –t –α/β < tcount < t–α/β, H0 is accepted.
b. If –t –α/β > - tcount or t–α/β < tcount, H0 is rejected.
Table 4. Paired t-Test Result in Uptime
Based on Table 4, it can be seen that the value of tcount gained is 1.799 smaller than ttable value, with df = 67 at the amount of 1.996 then H0 is accepted. So, it can be concluded that there is no difference regarding Uptime in Go-Jek and Grab users. E. The decision made regarding difference in sub-variable User Experience on Go-Jek
and Grab, as follow:
H0 : �1 = 0 There is no difference in User Experience on Go-Jek and Grab
mobile apps.
H1 : �1 ≠ 0 There is difference in User Experience on Go-Jek and Grab
mobile apps.
The basis of decision are:
a. If –t –α/β < tcount < t–α/β, H0 is accepted.
28
piabc.fe.unpar.ac.id
Table 5. Paired t-Test Result in User Experience
Based on Table 5, it can be seen that the value of tcount gained is 2.420 bigger than ttable value, with df = 67 at the amount of 1.996 then H0 is rejected. So, it can be concluded that there is difference regarding User Experience in Go-Jek and Grab users. Based on the result of mean test of paired sample statistics, it can be seen that mean value for User Experience in Jek users is bigger than User Experience in Grab users. It means User Experience of Go-Jek is better than Grab.
The results are supported by the data from descriptive analysis result that state that from four sub-variables of user experience, namely Happiness, Task Success, Earning, and Uptime, positive mean is given to Go-Jek app as a platform that gives a good experience to its users. Go-Jek Company that apparently has established earlier in Indonesia especially in Jakarta can be the main factor of establishment level of Go-Jek as a platform that gives a positive experience to its users. Meanwhile, Grab that appeared after Go-Jek, even though it has been able to be a head-to-head competitor for Go-Jek in Jakarta, still has to admit the excellence of Go-Jek as the precursor that has produced user experience which does not only deal with user interface but also the aspect of user experience entirely including its business aspect that focuses on effort to fulfill the need and desire of users. So, the earlier emergence of Go-Jek compared to Grab makes it possible for Go-Jek to be able to understand the users‘ desire based on research activities, planning, development, and tests done around DKI Jakarta.
REFERENCES
NN. (2008). Mobile Applications. Mmaglobal. p1.
29
piabc.fe.unpar.ac.id
Press.
Bernier, M. J., (1996). Establishing the psychometric properties of A scale for evaluating Quality in Printed Educational Materials. Patient Education and Counseling, 29, 283-299.
Buttle, F. (2009). Customer Relationship Management: Concepts and Technologies, Butterworth-Heinemann.
Constantinides, E. (2004). Influencing the online consumers behaviour. The web experience. Journal of Interest Research, 14(2), 111-126.
Fenech, T., O‘Cass, A., (β001). Internet users’ adoption of web retailing: User and product Sub Variabelons. Journal of Product & Brand Management, 10 (6), 361-381.
Garrett, et al., (2011), The Elements of User Experience: User-Centered Design for the Web and Beyond (Second Ed), Berkeley: Pearson Education.
Ghozali, Imam., (2012). Aplikasi Analisis Multivariate dengan Program IBM SPSS 20. Semarang : UNDIP.
Hassenzahl, M., (2004). The interplay of beauty, goodness, and usability in interactive products. Human-Computer Interaction, 19,319-349.
Kerry Rodden, Hilary Hutchinson, and Xin Fu., (2010). Measuring the User Experience on a Large Scale: User-Centered Metrics for Web Applications. 1600 Amphitheatre Parkway, Mountain View, CA 94043, USA.
Marketeers Editor. Go-Jek Versus GrabBike, Siapa Menang?. Marketeers Online. (9 Juni 2015). http://marketeers.com/go-jek-versus-grabbike-siapa-menang/. Accessed on 5 October 2016.
Nazir, M., (2003). Metode Penelitian. Jakarta:Ghalia Indonesia.
Nielsen, J., (1993). Usability engineering. San Diego, CA: Academic Press.
Nielsen-Norman Group. User Experience. (01 Mei 2007). Nielsen-Norman Group: http://www.nngroup.com/about/userexperience.html. Accessed on 28 September 2016. Norman, D. A., 2004. Emotional Design: Why we love (or hate) everyday things. New York: Basic Books.
30
piabc.fe.unpar.ac.id
Octarendra: http://www.octarendra.com/pilih-gojek-atau-grab-bike-baca- gojek-vs-grab-bike/. Accessed on 7 October 2016.
Riduwan., 2004. Belajar Mudah Penelitian. Bandung: CV Alfabeta.
Schmitt, B. H., 2008. A Framework for Managing Customer Experience, in B. H. Schmitt, D. L . Rogers, Handbook on Brand and Experience Management
Cheltenham, UK: Edward Elgar Publishing Limited. pp. 113-131.
Smith, Nicola., 2016. Using virtual reality to enhance user experience, Marketing Week (Online Edition);8/12/2015, p1.
Sudjana., 2005. Metode Statistika. Bandung: Tarsito.
Sugiyono., 2006. Statistika Untuk Penelitian, Alfabeta, Bandung.
Sugiyono., 2011. Metode Penelitian Kuantitatif Kualitatif dan R&D. Bandung: CV Alfabeta. Turban, E., 2012. Electronic Commerce. Pearson 7th-Global Edition.
https://www.go-jek.com/. (Accessed on 5 October 2016).
https://www.smashingmagazine.com/2010/10/what-is-user-experience-design- overview-tools-and-resources/. Accessed on 5 October 2016.
http://uxdesign.com/ux-defined. Accessed on 28 September 2016.
31
piabc.fe.unpar.ac.id
“WHAT’S WRONG WITH A PHENOMENON UNDERPRICING?”
Astrid Maharani
University of Muhammadiyah Jember [email protected]
Abstract
The aims of this paper is to describe and explore the phenomenon of underpricing. Underpricing is the phenomenon of the low bid price and generally occurs during the initial public offering (IPO) and the seasoned equity offering (SEO) which the issuer using the underpricing as a "strategy". The phenomenon of underpricing caused due to asymmetry information between informed and uninformed investors which ultimately makes underpricing into a business strategy. Empirical studies indicates that the influence factors of the phenomenon of underpricing are underwriter reputation, auditor reputation, firm age, company size, larger board, board independence, the profitability of the company, and financial statements.
Keywords: underpricing phenomenon, IPO, SEO JEL Classification: G02
INTRODUCTION
Underpricing phenomenon is a phenomenon that exists in the world of capital markets. Underpricing phenomenon often discussed in various capital markets research (Darmadi and Gunawan, 2013; Flagg and Margetis, 2008; and Anggarwal et al., 2002) that contribute to the development of research on the phenomenon of underpricing. Underpricing phenomenon usually occurs in the capital markets, especially in the primary market. Jogiyanto (2014), explained about the type of capital markets in Indonesia :
1. Primary Market
32
piabc.fe.unpar.ac.id
IPO) or additional securities new one if the company has been going public (Seasoned New Issue or Seasoned Equity Offering).
2. Secondary Market
Market that trades securities has been in circulation traded in this market. 3. Third Market
Market that run by brokers who bring together buyers and sellers when secondary market was closed.
4. Fourth Market
Capital markets that committed between institutions large capacity to avoid paying a commission to the broker which use communications networks to trade the stock in a large number of blocks.
Some experts define underpricing (Jogiyanto, 2014; Hopkins and Ross, 2014; Ljungqvist and Wilhelm, 2003; Aggarwal and Rivoli, 1990). Jogiyanto (2014) defines the phenomenon of underpricing is an interesting phenomenon that occurs in the initial offering to the public. Hopkins and Ross (2014) defines underpricing in the IPO is the practice of setting the initial offering price below what the market expected related to the value of shares following the issue. Ljungqvist and Wilhelm (2003) argue that underpricing phenomenon may occur due to problems between the principal and the agent. Aggarwal and Rivoli (1990) defines that underpricing is a phenomenon of over-valuation of the IPO or a trend. Based on some of these definitions it can be concluded that the underpricing phenomenon is a phenomenon of the low offer price which generally occurs at the time of the initial offering to the public and when the additional offers.
When discussing about the underpricing phenomenon could not be separated from the discussion related to the IPO (Initial Public Offering) and SEO (Seasoned Equity Offering) as both are times when companies use "strategy" underpricing. Why are so many that the IPO? For companies it means the acquisition of funds quickly, while for the underwriters as the right time to enhance their reputation in the market, and moment IPO for an investors is always the main attraction (Nugraha, 2004).
33
piabc.fe.unpar.ac.id
decision that must be considered deeply because if the company decides to going public and throwing stock debut to the public (Initial Public Offering), the main issue that arises is the type of what stocks will be thrown, what price which should be set for a piece of the shares and when it is most appropriate (Jogiyanto, 2014). There are several advantages of going public is 1) the ease of raising capital in the future, 2) increase liquidity for shareholders, and 3) the market value of the company is known, but behind some advantages there are some disadvantages of going public is 1) the cost of the report increased, 2) the disclosure of truly information, and 3) the fear of being taken over (Jogiyanto, 2014).
The actors of IPO that causes underpricing phenomenon are the issuers, underwriters, and investors (De Lorenzo and Fabrizio, 2001) which allegedly occurred asymmetric distribution of information among actors IPO. Companies referred to here is the issuer, described in Law No. 8 of 1995 on capital markets that the definition of the issuer are parties to a public offering. The issuer is a designation for companies that issue shares or bonds (bond), and the buyers are public (Tandelilin, 2010). There are two treatments of issuers according Tandelilin (2010):
1. The issuer's shares sell shares through a public offering either IPO (Initial Public Offering, IPO) to public investors, the next stock offerings (Seasoned Equity Offering).
2. The issuer‘s bonds sell bonds through public offer both IPO and the next bond offerings.
34
piabc.fe.unpar.ac.id
For public bidding process in preparation for the IPO (Initial Public Offering) in stocks and bonds (www.idx.co.id) can be classified into several stages:
1. Preparation Stage
This stage is beginning to prepare everything related to the public offering process. It was first performed by the Prospective Listed Company is doing a General Meeting of Shareholders for approval of the shareholders in the Public Offering of shares. After the approval, the appointment Prospective Listed Company doing Supporting Institutions and Professionals of the Capital Market, that is:
a) Underwriter is the most involved in helping prospective companies listed in order to issue shares by preparing various documents, helping to make the prospectus and provide guarantees for the issuance of securities.
b) Public Accountant (Independent Auditor) are the people in charge to conduct an audit or examination of the Listed Company's Financial Statements and the Prospective Listed Company.
c) Independent assessors who is a party to make an assessment on assets Prospective Listed Company and determining the fair value of these assets. d) Legal Consultants is a party to give a legal opinion.
e) The notary is a party to make the deeds of amendment, deed of agreements in order to the public offering and the meeting notes.
f) The Bureau of Securities Administration, tasked to administer the stock ordering and administering shareholding.
2. Filing of Registration Statement Stage
In this stage, the Prospective Listed Company completes supporting documents to submit the Registration Statement to OJK until the OJK has stated that the Registration Statement becomes effective.
3. Public Offering Stage
35
piabc.fe.unpar.ac.id
maximum of 5 working days. Keep in mind that all the desire of investors for shares Prospective Listed Company can be wholly satisfied in the event of excess demand (oversubscribe). For example, the shares offered to the public through the Primary Market for 100 million shares, while the demand for the purchase of shares from all investors of 150 million shares. In case investors do not get the shares were booked through the Primary Market, then the investor can buy the stock in secondary market is the market where the shares were listed and traded on the Stock Exchange.
4. Registration of Shares on the Stock Exchange
After the completion of the sale of shares in the Primary Market, then shares are listed and traded on the Indonesia Stock Exchange.
Several studies have found evidence that when the IPO underpricing phenomenon usually occurs such as in Indonesia (Jogiyanto, 2014; Nugraha,) and in some countries, namely in the UK (Levis, 1993) and in the US (Loughan et al., 1994).
The phenomenon of underpricing most phenomenal for in Indonesia is when the IPO of PT. Krakatau Steel Tbk in 2010 dropped in which Lukas Setia Atmaja (2011) described that is like the investor has the cash machine where prices IPO shares of PT. Krakatau Steel Tbk on the primary market is Rp 850 per share while the investors can sell on the first day of trading in the Indonesia Stock Exchange Rp 1.270 per share. What is thought by PT. Krakatau Steel Tbk? Indeed, there is always a possibility that the IPO price are reasonable but investors act less rationally so that scrambling to buy shares. Krakatau Steel Tbk is currently traded in the secondary market. Still, the allegations of various parties that the price of shares. Krakatau Steel Tbk accidentally set underpriced and most stocks has been blocked a number of major institutions, including the politicians, for the sake of personal interests and groups with the aim of selling these shares at a much higher price when trading debut on the stock exchange and the facts show that after IPO PT. Krakatau Steel Tbk of total shares outstanding 15.755 billion, foreign investors have 7%, domestic investors 13% and government 80%.
36
piabc.fe.unpar.ac.id
enjoy greater profits, and vice versa if the shares "overprice" the IPO, Mr. Genius will let Mr. Average purchase all shares offered. Mr. Average "win" but lost money, one strategy to address the problem of Winner's Curse and interesting Mr. Average to keep buying IPO shares, so that underwriters must offer underpriced the IPO price (Atmaja, 2011).
Underpricing phenomenon is not only found at the time of IPO (Initial Public Offering), but also when SEO (Seasoned Equity Offering) (Chemmanur et al., 2009; Cook and Officer, 1996). Despite the fact, the phenomenon of underpricing in SEO is not as big as at the time of IPO (Kim and Shin, 2001). SEO (Seasoned Equity Offering or Seasoned New Issue) is a new additional securities if the company has been going public (Jogiyanto, 2014). Sulistyanto Explained (2008) that Seasoned Equity Offerings (SEO) is an additional stock offering conducted by public companies that need additional funds to finance operations and investment activities as well as finding funds to pay long-term debt maturing.
According Sulistyanto (2008) for a stock offering SEO can be done in two ways, namely:
1. Through the mechanism of a rights issue or sell the rights to the existing shareholders to buy additional shares with certain price and at a certain moment. This mechanism is usually done by a company that his ownership was is concentrated with the aim of separately protecting the interests of existing shareholders in order to maintain the same proportion as their ownership before this equity offerings (preemptive right). This mechanism is commonly used by companies in the capital markets of developing countries (emerging market) that his ownership was tends to be concentrated on the person, family, or group.
37
piabc.fe.unpar.ac.id
market demand is also low.
In Indonesia, all related to capital markets and investment has been regulated by the Law No. 8 of 1995 on the Capital Market and Law No. 25 of 2007 on Investment. Both of law is expected to be a reference or guidelines for market participants, particularly those associated with underpricing phenomenon in Indonesia. Because of this phenomenon does not only happen in Indonesia, but also in various parts of the world, then the question arises lay of this underpricing phenomenon: whether the phenomenon of underpricing can be tolerated or who the beneficiaries of this underpricing phenomenon? This research aims bridging the wide range of research related to the phenomenon of underpricing into a comprehensive unity and explore the phenomenon of underpricing.
HOW THE OCCURRENCE OF UNDERPRICING PHENOMENON?
Darmadi and Gunawan (2013) and Cook and Officer (1996) explain that phenomenon of underpricing is supported the signaling theory. Scott (β009) definition that: ―A signal is an action taken by a high-type manager that would not be rational if that manager was low-type.‖ From these definition, it can be explained that the signal is an action taken by the manager high-type irrational if done by a low-type profile. This indicates that the transmission of signals conducted by the manager of the type where a manager of high-type seen by investors to have information that is more credible than the manager of the low-type, so that managers of high-type which will provide information to investors and is responsible for the provision of such signals. Then described further by Scott (2009) that the existence of a certain standard in a country about standardization in accounting would reduce the ability of high-type manager to transmit signals to the investor or prospective investor.