Parental Educational Investment and
Children’s Academic Risk
Estimates of the Impact of Sibship Size and
Birth Order from Exogenous Variation in
Fertility
Dalton Conley
Rebecca Glauber
a b s t r a c t
This study uses exogenous variation in sibling sex composition to estimate the causal effect of sibship size on boys’ probabilities of private school attendance and grade retention. Using the 1990 U.S. Census, we find that for second-born boys, increased sibship size reduces the likelihood of private school attendance by six percentage points and increases grade retention by almost one percentage point. Sibship size has no effect for first-born boys. Instrumental variable estimates are largely consistent across racial groups, although the standard errors are larger for nonwhites as they have smaller sample sizes and this renders them insignificant at traditional alpha levels.
I. Introduction
One of the more robust descriptive findings to emerge from research over the past few decades is that children from larger families fare worse educationally
Dalton Conley is a University Professor at New York University and Director of NYU’s Center for Advanced Social Science Research (CASSR). He is also Adjunct Professor of Community Medicine at Mount Sinai School of Medicine and a Research Associate at the National Bureau of Economic Research (NBER). Rebecca Glauber is a Ph.D. candidate in Sociology at New York University. The authors thank Jonathan Gruber, Joshua Angrist, and other participants at the 2005 NBER Summer Institute as well as participants at the 2003 IRP Summer Institute and two anonymous reviewers. This material is based upon work supported by the National Science Foundation under Grant No. 9983636 and the Robert Wood Johnson Foundation under Grant No. 038651. Any opinions, findings, and conclusions or recommenda-tions expressed in this material are those of the authors and do not necessarily reflect the views of the National Science Foundation or of the Robert Wood Johnson Foundation. The data used in this article can be obtained beginning March 2007 through February 2010 from Dalton Conley, 295 Lafayette Street, Department of Sociology, 4thFloor, New York, NY 10012, <dalton.conley@nyu.edu.>
[Submitted May 2005; accepted January 2006]
ISSN 022-166X E-ISSN 1548-8004 © 2006 by the Board of Regents of the University of Wisconsin System
than children from smaller families (see, for example, Featherman and Hauser 1978; Blake 1981, 1989; Heer 1985; Powell and Steelman 1993). However, researchers have only recently begun to examine if this association reflects a truly causal effect of fam-ily size on children’s well-being. We build on recent studies that have analyzed chil-dren’s educational outcomes using exogenous variation in family size induced by twin births (Black, Devereux, Salvanes 2005; Ca´ceres-Delpiano 2006) and we suggest an alternative instrumental variable approach where we exploit exogenous variation in family size induced by sibling sex composition. Families with two same-sex children (either two boys or two girls) are about seven percentage points more likely to have a third child than are families with two opposite sex children. This provides a source of randomized variation in the propensity to have three children as opposed to two, and this variation is not associated with any measurable family background characteristics. Using an instrumental variable approach, we analyze data from the Census 5 per-cent Public Use Microdata Sample (PUMS) and we report two main findings. First, instrumental variable (IV) estimates show that increased sibship size reduces second-born boys’ likelihood of private school attendance by six percentage points and increases second-born boys’ likelihood of being held back a grade in school by almost one percentage point. These instrumental variable estimates are largely consistent in sign and magnitude across racial groups, although the standard errors are larger for nonwhite groups, rendering IV parameter estimates for these groups insignificant. Second, we find that increased sibship size has no discernable effect for first-born boys regardless of their race.
II. Background on Sibship Size and Children’s
Educational Outcomes
Most studies have found that sibship size is negatively associated with children’s education. For example, Featherman and Hauser (1978) find that each addi-tional sibling costs about a fifth of a year of schooling (see also Blake 1981, 1989; Heer 1985; Powell and Steelman 1993). Becker and Lewis (1973) and Becker and Tomes (1976) propose that additional children strain the monetary and nonmonetary resources of families and that parents make tradeoffs between the quantity and the quality of their children within their given budget constraints. An alternative theory attributes the neg-ative effect of sibship size to the psychological climate within the family so that fami-lies with many children spaced close together have a relatively inferior intellectual climate due to the lower average age of the household (Zanjonc 1976).
Finally, others have suggested that the negative association between sibship size and children’s educational outcomes is due to selection processes. Sibship size reflects parental choices, and as such, it is endogenous. Parents with lower cognitive abilities may choose to have larger families than parents with higher cognitive abili-ties (Grotevant, Scarr, Weinberg 1977). Guo and VanWey (1999) attempt to reduce this endogeneity bias through the use of sibling fixed effects models. The authors find that the effect of sibship size on children’s education is not significantly different from zero. However, sibling fixed effects models do not effectively deal with endogeneity bias that results from parents adjusting their fertility patterns in response to the qual-ity of their earlier children or that results from unobservable variables that may vary
over time and across siblings. Because of these limitations, it is possible that Guo and VanWey’s zero estimates are downwardly biased.
Some recent studies have attempted to isolate the exogenous effect of sibship size on educational attainment using twin births (Rosenzweig and Wolpin 1980; Black, Devereux, Salvanes 2005; Ca´ceres-Delpiano 2006). Ca´ceres-Delpiano (2006) finds that increased sibship size induced by twin births does not negatively affect U.S. chil-dren’s educational attainment, but does negatively affect chilchil-dren’s likelihood of pri-vate school attendance. This effect appears to be most robust for two-plus sibships with older mothers. Black and coauthors (2005) find that increased sibship size has only a negligible effect on Norwegian children’s educational attainment once birth order is controlled for.
Building on these previous analyses, we propose the use of a different source of exogenous variation in sibship size—sibling sex composition.1 Angrist and Evans
(1998) introduced this instrument in their study of adults’ labor market outcomes. Goux and Maurin (2005) have recently used this instrument in their analysis of over-crowded housing and children’s school performance, and Currie and Yelowitz (2000) have used this instrument in their analysis of public housing and children’s educa-tional outcomes. The sibling sex composition instrument may improve on the twin instrument because it allows for a generalization of findings beyond twin families. And though Black and coauthors (2005) address this potential problem by examining children born priorto their twin siblings, the arrival of twins is not the same as the arrival of consecutive singletons. It is possible that the zero spacing between births may put an additional strain on parental monetary and nonmonetary resources. For this reason, we build on Caceres-Delpiano’s (2006) and Black, Devereux, and Salvanes’ (2005) research but we propose the use of a sibling sex composition instru-ment to isolate exogenous variation in sibship size.
We also extend previous analyses by examining heterogeneous treatment effects by race. Guo and VanWey (1999) report zero estimates of the effect of family size on chil-dren’s educational outcomes for White, Black, and Hispanic racial groups, but as we mentioned above, their zero estimates may be downwardly biased. Further, we think that the issue of heterogeneous treatment effects by race is still open for debate, as budget constraints certainly differ between racial groups in the United States, and cultural ori-entations to (religious) private schooling differ as well. Finally, minorities and whites face different residential mobility choices given the high degree of racial residential segrega-tion and documented housing discriminasegrega-tion in the United States (Massey and Denton 1993). In other words, as family size increases for whites, parents may face two choices: to move to a larger home in a well-funded school district or to stay put and pay for pri-vate schooling. Nonwhite families—and African Americans in particular—face addi-tional obstacles to exercising the first option which may increase the probability of relying disproportionately on private schooling, even at higher sibship sizes.
The Journal of Human Resources
724
III. Data and Statistical Approach
In this analysis, we use the 1990 Census 5 percent PUMS. The unit of analysis is the first-born or second-born boy older than four and younger than 18. Our sibship size instrument—the sibling sex composition of the first two children—requires that we locate households where all currently residing children are the biological chil-dren of the householder (and where the householder does not have other chilchil-dren living elsewhere). To make this assumption more reasonable, we limit the sample according to six household composition constraints: (1) parents in the household are married; (2) there are at least two children residing; (3) there are no children residing who are not the biological child of the head of household; (4) there are the same number of children currently residing as the primary female adult has ever given birth to; (5) there are no subfamilies residing in the unit; and, (6) there are no twins in the household. These deci-sions limit the generalizability of our findings, but they are necessary to produce a clean instrument.
We would ideally like to have retrospective educational attainment data, but the Census provides us only with educational measures for children currently coresiding in the household. Given this limitation, we examine two measures: boys’ probability of attending a religious or secular private school and boys’ probability of having been held back a grade in school. While it certainly may be the case that a particular pri-vate school represents a worse educational alternative than a particular public school, privately schooled children typically receive more resources than publicly schooled children. For example, in 1990, the average pupil-to-teacher ratio in U.S. elementary and secondary public schools was 17.2 and it was 14.7 in private schools (National Center for Educational Statistics 2001). Smaller class sizes also have been linked to enhanced test performances and increased probability of taking college-entrance exams, especially among minority students (Krueger and Whitmore 2001).2These
racial differences in class size effects may translate into race heterogeneous treatment effects of sibship size on parental investment in private schooling.
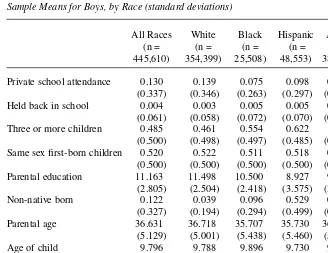
Our second outcome measure is a very conservative estimate of the probability that a child is held back a grade in school. We ascertain grade retention by comparing a child’s age to the highest grade that he or she has completed. Because birthday cut-offs may result in children starting late, we use a two-year conservative estimate. For example, a seven year-old must not have completed kindergarten in order to be clas-sified as being held back. One complication to this measure stems from the Census collapsing Grades 7–10 into one category which results in an underestimation of the proportion that we deem age inappropriate for their level of schooling. It therefore comes as no surprise to find that the mean percent of eldest two children that we clas-sify as being held back (from 0.3 percent to 0.5 percent depending on racial-ethnic group) is much smaller than the 11.1 percent of U.S. adults held back in 1992 reported by the National Center for Educational Statistics (1997), and the 15 percent of chil-dren held back that Oreopoulos, Page, and Stevens (2004) estimate using the 1980 Census.
Conley and Glauber 725
A recent study by Currie and Yelowitz (2000) examining the effect of public hous-ing on children’s likelihood of behous-ing held back a grade (among other outcomes) ushous-ing the 1990 Census reports a larger percentage of children held back than we do. We attribute differences between our sample means and Currie and Yelowitz’s sample means to their reliance on two datasets, the March Current Population Survey (CPS) and the Census, and a two-sample IV approach. They do not report using as strict a set of Census data sample constraints that we use to produce a valid instrument (dis-cussed above) and without these constraints, they report higher percentages of chil-dren that are held back a grade in school.
We also include in our analyses control variables for parental average years of schooling, parental average age, nativity status, and the age and sex of children. Age is measured through 13 dummy variables for each age from five to 17. Descriptive sta-tistics for all variables used in the analysis are presented in Table 1 and most variables display mean values similar to other nationally representative reports.
Our parameter estimates apply to families who go on to have an additional child because the eldest two children are of the same sex. This is the strict local average The Journal of Human Resources
726
Table 1
Sample Means for Boys, by Race (standard deviations)
All Races White Black Hispanic Asian
(n = (n = (n = (n = (n =
445,610) 354,399) 25,508) 48,553) 38,471)
Private school attendance 0.130 0.139 0.075 0.098 0.096 (0.337) (0.346) (0.263) (0.297) (0.294)
Held back in school 0.004 0.003 0.005 0.005 0.005
(0.061) (0.058) (0.072) (0.070) (0.067) Three or more children 0.485 0.461 0.554 0.622 0.586
(0.500) (0.498) (0.497) (0.485) (0.493) Same sex first-born children 0.520 0.522 0.511 0.518 0.517
(0.500) (0.500) (0.500) (0.500) (0.500) Parental education 11.163 11.498 10.500 8.927 9.601
(2.805) (2.504) (2.418) (3.575) (3.907)
Non-native born 0.122 0.039 0.096 0.529 0.677
(0.327) (0.194) (0.294) (0.499) (0.468)
Parental age 36.631 36.718 35.707 35.730 36.780
(5.129) (5.001) (5.438) (5.460) (5.701)
Age of child 9.796 9.788 9.896 9.730 9.858
(3.300) (3.298) (3.304) (3.302) (3.317) Age difference of children 3.089 3.064 3.520 3.050 3.030
(1.808) (1.744) (2.250) (1.945) (1.921)
treatment effect (LATE) and it does not tell us anything about families that have one or two children or have three children where the eldest two are of mixed sex. Our approach also does not tell us anything about the effect of having ten children as opposed to nine. Even to interpret this estimate as unbiased locally, we must make a couple of assumptions. First, we must assume that assignment to the treatment group (same sex) or the control group (mixed sex) is really random. This is a reasonable assumption given that there are no systematic differences in the likelihood of having two boys, two girls, or a mixed-sex pair across the population (Bennett 1980). Further, we must also assume monotonicity—that for no subgroup does having same sex children make them less likely—on average—to have additional children.3
We also must assume that sibling sex mix affects our educational measures only through an increase in sibship size. If, for example, there were significant returns to scale for same sex children, then IV estimates might be biased (Rosenzweig and Wolpin 2000). The evidence on sex composition’s direct effects is mixed (see, for example, Powell and Steelman 1990; Butcher and Case 1994; Kaestner 1997; Hauser and Kuo 1998; Conley 2000; Dahl and Moretti 2004). We limit our presentation of analyses to boys only as some recent research indicates that sex composition may directly affect girls but not boys (Butcher and Case 1994). And more importantly, we find that sibship size has stronger and more consistent effects on boys than on girls.
Our analysis proceeds as follows. We report first stage results in Table 2, and we use these predicted values—from ordinary least squares (OLS) regressions including all other variables—in the second stage. Linear probability models are reported in both stages, since Heckman and Macurdy (1985) argue that this is the ideal specifi-cation when faced with a set of simultaneous equations where the instrument, the variable being instrumented, and the dependent measures are dichotomous. The first stage equation predicting the likelihood of three or more children is as follows:
(1) MORETWO= β0+ β1SAMESEX + β2X+ ν
where MORETWOis a dummy variable equal to one if a family has three or more children residing at home (subject to the sample constraints discussed above), SAME-SEXis a dummy variable equal to one if the eldest two children are of the same sex, and Xis a vector of control variables.
The second stage uses the predicated probabilities from the first stage to estimate the likelihood of private school attendance and the likelihood of being held back a grade in school. The second stage equation is as follows:
(2) OUTCOME = γ0+ γ1MORETWO* + γ2X+ ε
where OUTCOMEis a dummy variable equal to one if a child has been held back a grade in school or attends a private school and MORETWO* is the first stage predicted probability. Standard errors in the second stage are adjusted to account for our use of a predicted probability.
Conley and Glauber 727
IV. Results
A. Estimates of the Effect of Same Sex Sibling Composition on Sibship Size
Table 2 presents the first stage estimates of the effect of same sex eldest siblings on the likelihood that the family has three or more children. Estimates are presented sep-arately by race and by parity. As with all of our analyses, we limit the sample to the eldest two boys who are aged 5 to 17 (inclusively) and we control for nonnative-born, parental educational attainment, parental age, the age of the child, the race of the child (in the overall model), and the age difference between the children. Using a narrower age restriction, such as those aged six to 16, does not alter our point estimates.
The first stage estimates for all racial groups are positive and statistically signifi-cant. For the sample of White first-born boys, same sex sibling composition increases the likelihood of a third child by 7.1 percentage points. For the sample of Black, Hispanic, and Asian first-born boys, same sex sibling composition increases the like-lihood of a third child by 4.1, 6.0, and 5.0 percentage points, respectively.4 For
the sample of second-born boys, our first stage estimates are roughly similar. The F-statistics from this first stage are all above ten. Our estimate for the entire sample combined is on par with Angrist and Evans’ (1998) finding of a 6.9 percentage point increase in the likelihood that women of all racial groups have a third child if their first two children are of the same sex.5The racial differences in probabilities of
hav-ing a third child given havhav-ing two same sex eldest children might be due to cultural differences in the desire for a sex-mix, or due to our imposed sample constraints. The samples for Whites and Asians are more representative of the national population, whereas the samples for Blacks and Hispanics are truncated at the higher end.
B. Instrumental Variables Estimates of Private School Attendance
Tables 3 and 4 present a comparison of IV and OLS results for the probability of pri-vate school attendance for first-born and second-born boys. Ten columns are pre-sented, two for each racial group where the first column within each racial group presents OLS estimates and the second column presents IV estimates. The key inde-pendent measure in the OLS models is an indicator variable of whether a family has three or more children; the key independent measure in the IV models is a variable indicating the first stage predicted probability of having three or more children. Control variables are not shown, but their effects are relatively consistent with other research findings. For example, parents with more education are more likely to send their children to private school.
Table 3 presents estimates for first-born boys for all races and then separately by race. The OLS estimate indicates a positive association between increased sibship size The Journal of Human Resources
728
4. When we run the first stage separately by race and by gender mix of the first two children, we find that while Whites have equal propensities to go on to have additional children irrespective of whether the first two are boys or girls, nonwhites are more likely to go on to have three or more children when the first two are girls; this is particularly true for the Asian group.
Conle
y and Glauber
729
Table 2
Linear Probability OLS Estimates of the Effect of Same Sex First-born Children on the Probability of Three or More Children in the Household, by Race and Birth Order (standard errors)
First-born Boys
Predictor All Races White Black Hispanic Asian
Same sex first-born children 0.067*** 0.071*** 0.041*** 0.060*** 0.050***
(0.001) (0.002) (0.008) (0.006) (0.007)
Constant 1.321*** 1.263*** 1.583*** 1.569*** 1.747***
(0.010) (0.011) (0.040) (0.029) (0.032)
R2 0.120 0.104 0.151 0.189 0.203
Number of cases 219,481 176,190 12,232 22,872 17,990
Second-born Boys
Predictor All Races White Black Hispanic Asian
Same sex first-born children 0.074*** 0.080*** 0.052*** 0.049*** 0.039***
(0.002) (0.002) (0.009) (0.007) (0.007)
Constant 1.443*** 1.374*** 1.813*** 1.768*** 1.950***
(0.012) (0.014) (0.047) (0.034) 0.036
R2 0.092 0.074 0.119 0.128 0.163
Number of cases 179,226 144,286 10,074 17,979 14,580
The Journal of Human Resources
730
Table 3
First Born Boys: Linear Probability OLS and IV Estimates of Three or More Children on the Probability of Private School Attendance (standard errors)
All Races White Black Hispanic Asian
Predictor OLS IV OLS IV OLS IV OLS IV OLS IV
Three or more 0.026*** −0.027 0.034*** −0.032 −0.014*** −0.037 −0.010** 0.011 −0.006 0.039
children (0.002) (0.020) (0.002) (0.022) (0.005) (0.115) (0.004) (0.066) (0.005) (0.088)
Constant −0.374*** −0.301*** −0.374*** −0.286*** −0.330*** −0.293 −0.414*** −0.449*** −0.304*** −0.385**
(0.007) (0.029) (0.009) (0.030) (0.024) (0.188) (0.020) (0.111) (0.022) (0.162)
Number of 219,481 219,481 176,190 176,190 12,232 12,232 22,872 22,872 17,990 17,990
cases
Conle
y and Glauber
731
Table 4
Second-Born Boys: Linear Probability OLS and IV Estimates of Three or More Children on the Probability of Private School Attendance (standard errors)
All Races White Black Hispanic Asian
Predictor OLS IV OLS IV OLS IV OLS IV OLS IV
Three or more 0.027*** −0.061*** 0.036*** −0.046** −0.030*** −0.121 −0.014*** −0.160* −0.006 −0.145
children (0.002) (0.021) (0.002) (0.022) (0.005) (0.103) (0.005) (0.090) (0.005) (0.135)
Constant −0.365*** −0.232*** −0.370*** −0.251*** −0.274*** −0.108 −0.376*** −0.110 −0.281*** −0.007
(0.009) (0.032) (0.010) (0.033) (0.028) (0.192) (0.024) (0.165) (0.026) (0.267)
Number of 179,226 179,226 144,286 144,286 10,074 10,074 17,976 17,976 14,580 14,580
cases
and White boys’ private school attendance but a negative association between increased sibship size and Black, Hispanic, and Asian boys’ private school attendance (with the OLS estimate for Asian boys not statistically significant). This unexpected OLS estimate for White boys also appears in Ca´ceres-Delpiano’s (2006) study, as he finds that for all children, family size is positively associated with the probability of private school attendance. This is most likely due to the tendency among larger fami-lies to be more religious and to send their children to religious private schools. However, when we instrument for having three or more children using the sibling sex mix approach, we find no causal effect of increased sibship size on first-born boys’ pri-vate school attendance. These findings are contrasted to those reported in the next table, Table 4, which indicates that for second-born boys increased sibship size induced by same sex sibling composition causes a 6.1 percentage point decrease in the proba-bility of private school attendance (for all racial groups).
The parameter estimates of the “true” effect of sibship size on second-born boys’ private school attendance are only significant for Whites and Hispanics. Increases in sibship size induced by sibling sex composition reduce White and Hispanic second-born boys’ probabilities of private school attendance, by 4.6 and by 16.0 percentage points, respectively. The point estimates for Black and Asian second-born males are the same sign and of similar magnitudes as for Hispancis, but they are not statistically significant, most likely due to sample sizes that are too small for an IV approach.6
C. Instrumental Variables Estimates of Grade Repetition
In the final section of this study we estimate the effect of sibship size on boys’ likeli-hood of being held back a grade in school. As with Tables 3 and 4, Tables 5 and 6 report coefficients from linear OLS and IV probability models with standard errors adjusted for clustering within families. Findings reported in Table 5 indicate that there is no significant causal effect of sibship size on first-born boys’ likelihood of being held back a grade in school, irrespective of race.
Findings reported in Table 6 reveal slightly larger effects of sibship size on second-born boys’ grade retention. The IV estimate for all racial groups combined is signifi-cant and indicates that an increase in sibship size due to same sex sibling composition increases boys’ probability of being held back a grade in school by 0.7 percentage points. This causal effect is likely driven by White, Hispanic, and Asian boys, as the point estimates are positive for these three groups (although they are not significantly different from zero due to their smaller samples sizes and large standard errors). The IV point estimate for Black second-born boys is negative, at ⫺0.011, but it is also not
statistically different from zero given its large standard error.7
The Journal of Human Resources
732
6. In IV analyses of girls, not shown (but available upon request), we find that sibship size has no negative effect on any group of girls’ probabilities of private school attendance, and that increased sibship size increases first-born girls’ probability of private school attendance.
Conle
y and Glauber
733
Table 5
First-Born Boys: Linear Probability OLS and IV Estimates of Three or More Children on the Probability of Grade Repetition (standard errors)
All Races White Black Hispanic Asian
Predictor OLS IV OLS IV OLS IV OLS IV OLS IV
Three or more 0.002*** 0.002 0.002*** 0.002 0.004* 0.029 0.004*** −0.032 0.006*** −0.004
children (0.000) (0.006) (0.000) (0.006) (0.002) (0.049) (0.002) (0.024) (0.002) (0.031)
Constant 0.085*** 0.086*** 0.082*** 0.081*** 0.106*** 0.066 0.103*** 0.164*** 0.100*** 0.118**
(0.002) (0.008) (0.002) (0.008) (0.011) (0.080) (0.007) (0.041) (0.008) (0.058)
Number 212,736 212,736 169,764 169,764 12,218 12,218 22,726 22,726 17,868 17,868
of cases
The Journal of Human Resources
734
Table 6
Second-Born Boys: Linear Probability OLS and IV Estimates of Three or More Children on the Probability of Grade Repetition (standard errors)
All Races White Black Hispanic Asian
Predictor OLS IV OLS IV OLS IV OLS IV OLS IV
Three or more 0.001*** 0.007* 0.001*** 0.006 0.000 −0.011 −0.001 0.015 0.000 0.029
children (0.000) (0.004) (0.000) (0.004) (0.002) (0.032) (0.001) (0.025) (0.001) (0.036)
Constant 0.080*** 0.071*** 0.075*** 0.067*** 0.126*** 0.146** 0.105*** 0.076* 0.080*** 0.023
(0.002) (0.007) (0.002) (0.006) (0.008) (0.059) (0.006) (0.046) (0.007) (0.073)
Number 169,121 169,121 135,162 135,162 9,813 9,813 17,498 17,498 14,231 14,231
of cases
V. Conclusion
Our study provides some new evidence on the negative effect of sib-ship size on boys’ educational measures and variation, or lack thereof, by race. When the first two children are of the same sex, White families have about a 7.1 percentage point increase in their likelihood of having three or more children, and Black, Hispanic, and Asian families have percentage point increases of about 4.1, 6.0, and 5.0, respectively. We exploit this exogenous variation in sibship size and estimate IV models of the effect of sibship size on boys’ probability of private school attendance and boys’ probability of being held back a grade in school.
Deploying this strategy, we report two important findings: First, we find that increased sibship size has a negative effect on second-born boys’ educational out-comes, at least as measured through private school attendance and grade repetition. Having three or more children living in the household, as compared to just two, reduces second-born boys’ likelihood of private school attendance by six percentage points. When we separate out our models by race, we find that this negative effect is only significantly different from zero for White and Hispanic boys. Increased family size induced by sibling sex composition reduces White second-born boys’ probabil-ity of private school attendance by 4.6 percentage points and reduces Hispanic sec-ond-born boys’ probability by 16 percentage points. Estimates for Black and Asian boys are of similar sign and magnitude, but these groups have much larger standard errors due to smaller sample sizes—making the interpretation of heterogenous treat-ment effects by race ambiguous, especially given slightly different results in the first stage and potentially differential gender preferences. Sibship size also increases sec-ond-born boys’ probability of being held back a grade in school. However, when we break these analyses out by race, point estimates are no longer significant.
Our second finding is that sibship size has no discernable effect on first-born boys, regardless of their race. Why might sibship size negatively affect second-born boys and not first borns? We can offer two speculations.The first is that parents are poor planners and fail to smooth investment in children across their brood. Thus, it may be possible that parents over-invest in the first child, assuming that they will achieve the sex mix that they desire at a parity of two, but when it turns out they need to expand the number of their children to three, it is the second born who suffers the economic “correction” since the schooling career of the first may be well underway already. A second possibility is that the most important budgetary constraint facing parents is not financial but temporal and attention-related. Specifically, it could be the case that the time that the first-born spends as an only child protects him from adverse academic outcomes (that is, being held back a grade in school or failing to gain admission to private school) and that the second-born does not enjoy such one-to-one time with parents. In this paradigm, assuming all children exit the household at a certain point, the last-born and the first-born experience some period of only-childhood in the unit. If the effect of the number of children in the household were nonlinear, then it could be the case that even though the average family size during childhood may be the same for all children (assuming even spacing) the absence of any time as an only child may be critical for middle-born children. Hanushek (1992) studied sixth-grade read-ing scores and found that while there were no birth order effects for small families, for large families there was a U-shaped effect—children in the earliest and latest birth
positions significantly outperformed those in the middle. While in the present analy-sis, we do not have an identification strategy to address whether we are uncovering a family size effect that increases monotonically with parity or whether we have revealed a “middle child” effect, we hope to see future research that adjudicates between these possibilities, perhaps by developing instruments for higher order sibship size transitions.
References
Angrist, Joshua D., and William N. Evans. 1998. “Children and Their Parents’ Labor Supply: Evidence from Exogenous Variation in Family Size.” American Economic Review88(3): 450–77.
Becker, Gary S., and H. Gregg Lewis. 1973. “On the Interaction Between the Quantity and Quality of Children.” Journal of Political Economy81(2):S279–S88.
Becker, Gary S., and Nigel Tomes. 1976. “Child Endowments and the Quantity and Quality of Children.” Journal of Political Economy84(4):S143–S62.
Black, Sandra E., Paul J. Devereux, and Kjell G. Salvanes. 2005. “The More the Merrier? The Effect of Family Size and Birth Order on Children’s Education.” Quarterly Journal of Economics120(2):669–700.
Blake, Judith. 1981. “Number of Siblings and Educational Mobility.” American Sociological Review50(1):84–94.
———. 1989. Family Size and Achievement. Berkeley: University of California Press. Butcher, Kristin F., and Anne Case. 1994. “The Effect of Sibling Sex Composition on
Women’s Education and Earnings.” Quarterly Journal of Economics109(3):531–63. Conley, Dalton. 2000. “Sibship Sex Composition: Effects on Educational Attainment.” Social
Science Research29(3):441–57.
Currie, Janet, and Aaron Yelowitz. 2000. “Are Public Housing Projects Good for Kids?” Journal of Public Economics75(1):99–124.
Ca´ceres-Delpiano, Julio. 2006. “Impact of Family Size on Children’s Well-being: Evidence from Twins Experiment.” Journal of Human Resources. Current issue.
Dahl, Gordon B., and Enrico Moretti. 2004. “The Demand for Sons: Evidence from Divorce, Fertility, and Shotgun Marriage.” National Bureau of Economic Research Working Paper No. 10281.
Featherman, David, and Robert M. Hauser. 1978. Opportunity and Change. New York: Basic Books.
Goux, Dominique, and Eric Maurin. 2005. “The Effect of Overcrowded Housing on Children’s Performance at School.” Journal of Public Economics89(5–6):797–819. Grotevant, Harold D., Sandra Scarr, and Richard A. Weinberg. 1977. “Intellectual
Development In Family Constellations With Adopted and Natural Children: A Test of the Zajonc and Markus Model.” Child Development48(4):1699–1703.
Guo, Guang, and Leah K. VanWey. 1999. “Sibship Size and Intellectual Development: Is the Relationship Causal?” American Sociological Review64(2):169–87.
Hanushek, Eric A. 1992. “The Tradeoff between Child Quantity and Quality.” Journal of Political Economy100:84–117.
———. 1999. “The Evidence on Class Size.” In Susan E. Mayer and Paul Peterson (ed.), Earning and Learning: How Schools Matter, 131–68. Washington, D.C.: Brookings Institution.
Hauser, Robert M., and Hsiang-Hui Daphne Kuo. 1998. “Does the Gender Composition of Sibship Affect Women’s Educational Attainment?” Journal of Human Resources 33(3):644–57.
The Journal of Human Resources
Heer, David M. 1985. “Effects of Sibling Number on Child Outcome.” Annual Review of Sociology11:27–47.
Kaestner, Robert. 1997. “Are Brothers Really Better? Sibling Sex Composition and Educational Achievement Revisited.” Journal of Human Resources32(2):250–84. Krueger, Alan B., and Diane M. Whitmore. 2001. “The Effect of Attending a Small Class In
the Early Grades on College-Test Taking and Middle School Test Results: Evidence from Project Star.” Economic Journal111(468):1–28.
Massey, Douglas, and Nancy Denton. 1993. American Apartheid: Segregation and the Making of the Underclass. Cambridge, Mass.: Harvard University Press.
National Center for Education Statistics. 2001. Digest of Education Statistics. Washington, D.C.: U.S. Department of Education.
Oreopoulos, Philip, Marianne E. Page, and Ann Huff Stevens. 2004. “The Intergenerational Effects of Compulsory Schooling.” Unpublished.
Powell, Brian, and Lala Carr Steelman. 1990. “Beyond Sibship Size: Sibling Density, Sex Composition, and Educational Outcomes.” Social Forces69(1):181–206.
———. 1993. “The Educational Benefits of Being Spaced Out: Sibship Density and Educational Progress.” American Sociological Review58(3):367–81.
Rosenzweig, Mark R., and Kenneth I. Wolpin. 1980. “Testing the Quantity-Quality Fertility Model: Use of Twins as a Natural Experiment.” Econometrica48(1):227–40.
———. 2000. “Natural ‘Natural Experiments’ in Economics.” Journal of Economic Literature38(4):827–74.
Zajonc, R.B. 1976. “Family Configuration and Intelligence.” Science192(4236):227–36.