USING COVARIANCE MATRIX FOR CHANGE DETECTION OF POLARIMETRIC
SAR DATA
M. Esmaeilzade a, F. Jahania, J.Aminib*
a Remote Sensing Department, Faculty of Surveying and Geospatial Engineering, College of Engineering, University of Tehran – (m.esmaeilzade, fatemeh.jahani) @ut.ac.ir
b Remote Sensing Department, Faculty of Surveying and Geospatial Engineering, College of Engineering, University of Tehran - [email protected]
Key words: Change detection, UAVSAR, Wishart distribution, Statistical Model, Dual polarization, Full polarization.
ABSTRACT:
Nowadays change detection is an important role in civil and military fields. The Synthetic Aperture Radar (SAR) images due to its independent of atmospheric conditions and cloud cover, have attracted much attention in the change detection applications. When the SAR data are used, one of the appropriate ways to display the backscattered signal is using covariance matrix that follows the Wishart distribution. Based on this distribution a statistical test for equality of two complex variance-covariance matrices can be used. In this study, two full polarization data in band L from UAVSAR are used for change detection in agricultural fields and urban areas in the region of United States which the first image belong to 2014 and the second one is from 2017. To investigate the effect of polarization on the rate of change, full polarization data and dual polarization data were used and the results were compared. According to the results, full polarization shows more changes than dual polarization.
1. Introduction
Change detection is a process that used a pair of remote sensing data from a geographical area at different times to obtain the changes. It plays an important role in civil and military fields.
Various types of remote sensing data can be used for this purpose. SAR data due to its capability that it is independent of atmospheric conditions and solar radiation and cloud cover, has attracted much attention in change detection (Conradsen, Nielsen, Schou, & Skriver, 2003) and has been applied to examine changes in land use and land cover, disaster management, land surface materials and etc. The Radar backscattering is sensitive to the dielectric characteristics of the plant and the soil, to the plant structure, to the surface roughness and to the canopy structure (F. T. Ulaby, Moore, & Fung, 1986) (Skriver, Svendsen, & Thomsen, 1999).
The polarimetric SAR measure the amplitude and phase of the backscattered signal in four combinations of the linear receive and transmit polarizations: horizontal–horizontal (HH), horizontal–vertical (HV), vertical–horizontal (VH), and vertical– vertical (VV) (Fawwaz T. Ulaby & Elachi, 1990). These signals make the complex backscattering metrics that relates to the incident and scattered electric field. Another way to show backscattered signal is using the covariance matrix. The average covariance matrix is shown in Equation (1) (Conradsen et al., 2003).
< � >f = [ < S conjugation; and S is the complex scattering amplitude for receive polarization r and transmit polarization t.
Reciprocity, which normally applies to natural targets, gives S =S and results in the covariance matrix (1) with rank 3.< � > follows a complex Wishart distribution.
Change detection methods with SAR data are divided into two categories: the supervised method and unsupervised method. The supervised methods require prior information and training data but the unsupervised method makes a direct comparison between two SAR images (Camps-Valls, Gomez-Chova, Munoz-Mari, Rojo-Alvarez, & Martinez-Ramon, 2008).
Unsupervised methods generally consist of the following three steps, 1) pre-processing of the two images including geometric correction and removal SPECKLE noise by using filters such as mean filter, median filter or Lee filter, 2) Generating different images from SAR data by using operators such as the subtraction or the ratio operator and etc., 3) the change map is generated through analysing the difference image that this analysis generally is threshold method or feature extraction method (Hao Li, Maoguo Gong, & Jia Liu, 2015).
Nowadays many studies have been done in this field, various methods are proposed for change detection with SAR images. Like the log-ratio method or likelihood ratio operator which is a statistically optimized approach to detect changes within a pair of SAR images.
2. METHODOLOGY
A fully polarimetric SAR measures the 2×2 complex scattering matrix at each resolution cell on the ground. If �� denotes the complex scattering amplitude for receive and transmit polarizations, then reciprocity, which normally applies to natural targets, gives ℎ� = �ℎ (F. T. (Fawwaz T. Ulaby & Elachi, 1990).
Assuming reciprocity, the scattering matrix is represented by the three-component complex target vector s = [ ℎℎ ℎ� ��]Tthat T means transpose.
The speckle noise in the SAR data can be filtered by using spatial averaging. In this so-called multilook case appropriate representation of the backscattered signal is the covariance matrix in which the average properties of a group of resolution cells can be expressed in a single matrix formed by the outer products of the averaged target vectors. The average covariance matrix is defined as equation 1. The covariance matrix contain both co- and cross-polarized scattering matrix components (< S∗ > and <
S∗ >) often have little information.
For randomly distributed targets with azimuthal symmetry, the elements are zero [16] so the covariance matrix is:
< � > = [< S
∗ > < S∗ >
< S∗ >
< S∗ > < S∗ >] (2)
Spaceborne instruments often send only one polarization, say horizontal, and receive both polarizations giving rise to dual polarization data. In this instrument the components are < S∗ >, < S∗ >and < S∗ >and covariance
matrix has rank 2 and is showed in equation3.
< � >d = [< S
∗ > < S∗ >
< S∗ > < S∗ >] (3)
2.1 Complex normal distribution
We say that a -dimensional random complex vector Z follows a complex multivariate normal distribution
with mean 0 and dispersion matrix Σ, i.e.,
= [ , … , ]�∈ �� , Σ (4)
If the frequency function is
��=��|Σexp{−�∗Σ− �} =��|Σexp {−��[Σ− ��∗�]} (5)
tr denotes the trace of a matrix; and ∗ denotes complex conjugation ( *) and transpose (T).
2.2 Complex Wishart distribution
We say that a Hermitian positive definite random p × p matrix X follows a complex Wishart distribution, i.e.
∈ � �, , Σ (6) definite. If X and Y are independent and both follow complex Wishart distributions
If the independent p × p Hermitian matrices X and Y have Wishart distribution (X = n< � > and Y = m< � > , n and m are the number of looks), i.e., X ∈ WC(p, n,Σ ) with Σˆ = X and Y ∈WC (p, m,Σ ) with Σˆ = Y, then the statistic to test the so-called null hypothesis H for equality of the two complex Wishart matrices is
H : Σ =Σ (11)
Against all alternatives, is
Q = n + mn m + |X + Y||X| |Y|+ (12)
Where | · | shows the determinant; Q ∈ [0, 1] with Q = 1 for equality. For the logarithm of Q, we have
ln Q = p[(n + m) ln n + m − n ln n -mln m ] + n probability of finding a smaller value of −2ρln Q is:
Q = n + mn m + |X + Y||X| |Y|+ (18)
Which is similar to the likelihood ratio test statistic for the equality of two gamma parameters (Touzi, Lopes, &
for the azimuthal symmetry case they are set to zero. In this case, by swapping first rows and then columns two and three in < � > in (2), we have: implementation such as calculation of determinants and calculation of probability. This section addresses these issues.
The first, fourth, fifth, and sixth terms are real. The second and third terms are complex and each other's conjugate
αbρ∗= a
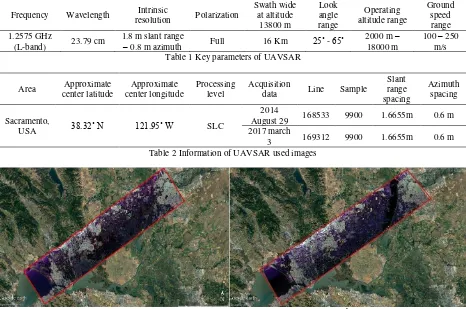
In this equation, the imaginary sections are removed and the real parts are combined together. UAVSAR is an L-band synthetic aperture radar (SAR) that specifically designed to acquire airborne repeat track SAR data for differential interferometric measurements. The radar is designed to be operable on a UAV (Unpiloted Aerial Vehicle) but initially be demonstrated on a NASA Gulfstream III aircraft (Fore et al., 2015). Table 1 shows the main characteristics of the UAVSAR. The images are acquired from NASA/JPL dataset which are at SLC (Single Look Complex) format. General information about these images is represented in table 2.
According to the SAR geometry imaging, these images include geometric distortions that should be geometrically calibrated. As the radar systems are side looking, geometric distortion such as foreshortening and layover are occurred. To remove these distortions, information about sensor position, imaging geometry and altitude from ellipsoid
should be available (Esmaeilzadeh & Amini, 2016). Elimination of the geometric errors and georeferencing of two UAVSAR images perform as a pre-processing step. The elevation model which used for georeferencing is SRTM v3 digital elevation model.
the images visually better, the images are resampled such that the spatial resolution in both directions are equal to 5 m. both images have the same size because, in proposed change detection algorithm, the input images must have the same size and must be coregistered together. Figure 1 shows the
georeferenced and multilooked images in Google Earth software. The red rectangles show the Pauli image of Table 1 Key parameters of UAVSAR
Area Approximate
Table 2 Information of UAVSAR used images
a b
Figure 1 Georeferenced and multi-looked Pauli images in Google Earth software. a) 2014 data – b) 2017 data
Up to now, these processes are considered as the pre-processing step. Due to the volume of the used data, we crop six same area that namely A to F from both images to illustrate the performance of proposed method. Three small areas are cropped in both datasets that named as A, B and C. These small areas are chosen because the changes in these images are clearly visible and we can create change maps by manual digitizing for validation of proposed method. So that, the digitized maps consider as ground truth. Another three larger areas are selected in both dataset that named as D, E and F. the proposed algorithm is applied in these areas, but these areas are larger than first all and we can’t create ground truth digitized maps. So, the achieved change maps are presented just for showing the performance of proposed method in the urban and agricultural area. In area A, B and C, by comparison of figure 2 and 3, we can clearly see that some new buildings are constructed and some are destroyed. Figure 2 and 3 show the cropped areas A to F of reference images with a white rectangle for 2014 and 2017 images, respectively. The red, green and blue bands are HH, HV and VV polarization, respectively. Changes in both images are visually obvious. Now, we want to show these changes in these six areas with proposed method in this article.
The proposed method is performed in dual and full polarimetry to comprehend that what is the effect of the polarization in change detection. For full polarimetry, four polarization images, HH, HV, VH and VV are used. For dual polarimetry, three combinations of polarization are considered. First of all, is using HH and VH polarizations. Another one is using VV and HV polarization and the last one is using HH and VV polarizations as inputs of the change detection algorithm. The impact if polarization is evaluated for areas A to F which have urban and agricultural areas for all of the combinations.
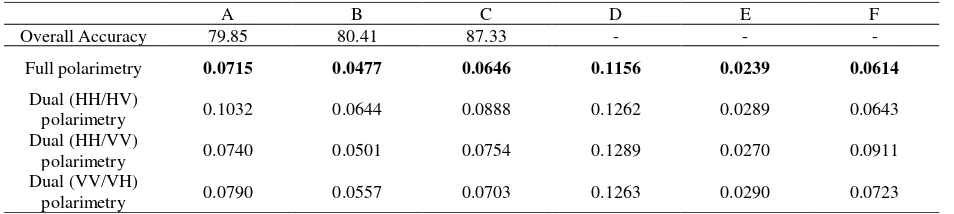
Table 3 represents the P and change map accuracy for dual and full polarimetry change detection of defined areas A to F. The accuracies represented in the second row are just for A, B and C area for full polarimetric change detection because the ground truth of them are available. As the P-value for full polarimetric change detection in areas A, B and C are less than combinations of dual polarimetry change detection, the accuracies represented belong to full polarimetric change detection.
rate of change in all areas A to F is achieved when full polarimetric data is used.
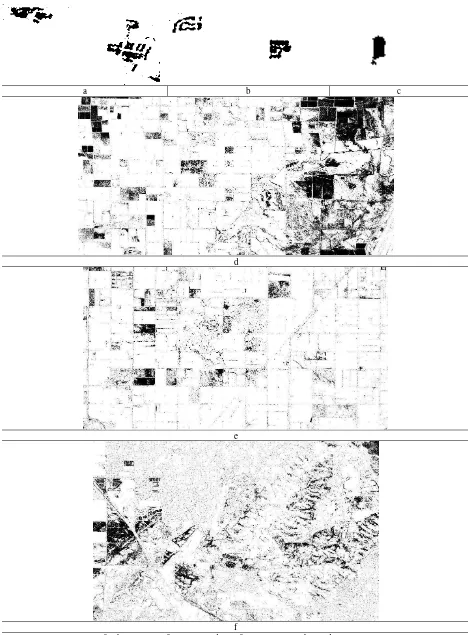
According to the table 3 that shows the change probabilities (P), you can see that using the full polarimetric data in change detection algorithm is more accurate than all of the combinations of dual polarization change detection. Figures 4, (a) to (f) show the change map for areas A to F according to full polarimetric change. These figures show the highest rate of change in all of the combinations. It is noticeable that the pixel size of selected areas A to D are not equal but the size of data has no effect on the value of parameter P. Full polarimetry change detection is the best input for proposed method then all of the dual polarization combinations and full polarimetric change maps are slightly better than dual polarization for these selected scenes but dual polarization may be appropriate for other scenes which they have different targets and landscapes.
4. CONCLUSION
In this paper, a statistical test for equality of complex Wishart distributed covariance matrix and an associated asymptotic probability value of the test statistic have been determined. According to the potential of the proposed test statistic, the extracted values have been performed to change detection in full and dual polarization UAVSAR data for six test area with predominant agricultural and urban area. Two images acquired with 3-year interval have been used.
Data have been downloaded from NASA/JPL dataset which they have speckle noise, inherently. For reducing speckle noise, multi-looking in range and azimuth direction have been applied. The multi-looked SAR images have the 5m spatial resolution in both directions. Then, the images have been coregistered together and georeferenced as inputs of change detection algorithm.
In change detection algorithm, full polarization and the combination of dual polarization change detection have been performed in selected areas. The impact of polarization in change detection has been checked out and the results showed that the full polarimetric change detection demonstrates more changes rate than all combinations of the dual polarization change detection algorithm. It must be said that the changes in selected areas were visually obvious and distinct especially in the urban area and constructed buildings but in this article, the percentage of changes have not been determined in large areas. It was due to the lack of ground truth data and we could not provide an SAR data with the reliable source of ground truth. If the ground truth was available for these areas, the percentage of changes in areas could be calculated.
A B C D E F
Overall Accuracy 79.85 80.41 87.33 - - -
Full polarimetry 0.0715 0.0477 0.0646 0.1156 0.0239 0.0614
Dual (HH/HV)
polarimetry 0.1032 0.0644 0.0888 0.1262 0.0289 0.0643
Dual (HH/VV)
polarimetry 0.0740 0.0501 0.0754 0.1289 0.0270 0.0911
Dual (VV/VH)
polarimetry 0.0790 0.0557 0.0703 0.1263 0.0290 0.0723
Figure 2 Georeferenced image, A (260×128 pixel), B (200×87 pixel), C (94×48 pixel), D (541×1025 pixel), E (2252×1202) and F (1672×1051 pixel) of 2014 UAVSAR image. The red, green and blue bands are HH, HV and VV polarization, respectively.
.
a b c
d
e
f
References
Camps-Valls, G., Gomez-Chova, L., Munoz-Mari, J., Rojo-Alvarez, J. L., & Martinez-Ramon, M. (2008). Kernel-Based Framework for Multitemporal and Multisource Remote Sensing Data Classification and Change Detection. IEEE Transactions on Geoscience
and Remote Sensing, 46(6), 1822–1835.
https://doi.org/10.1109/TGRS.2008.916201
Conradsen, K., Nielsen, A. A., Schou, J., & Skriver, H. (2003). A test statistic in the complex Wishart distribution and its application to change detection in polarimetric SAR data. IEEE Transactions on Geoscience and Remote Sensing, 41(1), 4–19. https://doi.org/10.1109/TGRS.2002.808066
Esmaeilzadeh, M., & Amini, J. (2016). Geometric Calibration of SAR Images to Eliminate Earth’s Surface Topography Distortions. Journal of Geomatics Science and Technology, 5(4), 173–185. Retrieved from http://jgst.issge.ir/article-1-370-en.htmlER
Fore, A. G., Chapman, B. D., Hawkins, B. P., Hensley, S., Jones, C. E., Michel, T. R., & Muellerschoen, R. J. (2015). UAVSAR Polarimetric Calibration. IEEE Transactions on Geoscience and Remote Sensing,
53(6), 3481–3491.
https://doi.org/10.1109/TGRS.2014.2377637 Hao Li, Maoguo Gong, & Jia Liu. (2015). A Local Statistical
Fuzzy Active Contour Model for Change Detection.
IEEE Geoscience and Remote Sensing Letters, 12(3), 582–586.
https://doi.org/10.1109/LGRS.2014.2352264 LOPES, A., NEZRY, E., TOUZI, R., & LAUR, H. (2010).
Structure detection and statistical adaptive speckle
filtering in SAR images.
http://dx.doi.org/10.1080/01431169308953999. https://doi.org/10.1080/01431169308953999 Skriver, H., Svendsen, M. T., & Thomsen, A. G. (1999).
Multitemporal C- and L-band polarimetric signatures of crops. IEEE Transactions on Geoscience and
Remote Sensing, 37(5), 2413–2429.
https://doi.org/10.1109/36.789639
Touzi, R., Lopes, A., & Bousquet, P. (1988). A statistical and geometrical edge detector for SAR images. IEEE Transactions on Geoscience and Remote Sensing, 26(6), 764–773. https://doi.org/10.1109/36.7708 Ulaby, F. T. (Fawwaz T., & Elachi, C. (1990). Radar
polarimetry for geoscience applications. Artech House.