FOREST ROADIDENTIFICATION AND EXTRACTIONOF THROUGH ADVANCED
LOG MATCHING TECHNIQUES
W. Zhang 1, *, B. Hu 1, L. Quist 2
1 Dept. of Earth and Space Science and Engineering, York University, 4700 Keele St, Toronto, Canada - (wwzhang,
baoxin)@yorku.ca
2 Hearst Forest Management Inc., 1589 Highway 11 West, Hearst, Canada- [email protected]
Commission VI, WG VI/4
KEY WORDS: Forest road extraction, LiDAR, template matching, LoG, segmentation, tensor voting.
ABSTRACT:
A novel algorithm for forest road identification and extraction was developed. The algorithm utilized Laplacian of Gaussian (LoG) filter and slope calculation on high resolution multispectral imagery and LiDAR data respectively to extract both primary roa d and secondary road segments in the forest area. The proposed method used road shape feature to extract the road segments, which have been further processed as objects with orientation preserved. The road network was generated after post processing with tenso r voting. The proposed method was tested on Hearst forest, located in central Ontario, Canada. Based on visual examination against manually digitized roads, the majority of roads from the test area have been identified and extracted from the process.
* Corresponding author
1. INTRODUCTION
The characterization of forest roads is important for forest management and wildlife habitat mapping. Forest roads are usually generated by manual interpretation of high spatial resolution optical imagery. This method is time-consuming and labour intensive. A number of studies were carried out to automatically extract roads from remotely sensed data (mainly passive optical imagery), most of them were focused on extract road centerline from the urban area using object based classification or edge detection focused morphological methods. (Shi et al., 2014) (Beck et al., 2015) The classification methods utilized the spectral signature of the road segment to separate it from other objects. Song and Civco used support vector machine (SVM) to classify the imagery and further detect road networks. (Song and Civco, 2004) Yuan et al. proposed a multistage process based on robabilistic SVMs and salient features to extract road networks from satellite imagery. (Yuan et al., 2011) Huang and Zhang proposed the detection of road centerlines from high-resolution images by integrating multiscale structural features and SVM. (Huang and Zhang, 2009) One the other hand, the edge detection focused approached utilize the road as line feature where the shape feature was used to distinguish it from the background. In this aspect, Shi and Zhu proposed a line segment match rule to extract urban road networks from morphological processing. (Shi and Zhu, 2002) Chaudhuri et al. proposed a semi-automated road detection method with the directional morphological enhancement and segmentation. (Chaudhuri et al.,2012) The existing methods were based on the facts that roads are linear features with edges and have different spectral signatures from surrounding objects. Such approaches may work well with major roads built with concrete or pavement, but fail to detect roads with vegetation
coverage or under tree canopies shadows. (
Coops and Bater,
2009)
Moreover, the approaches using passive optical imagery which lack of elevation information was unable to separate lifted roads from non-lifted ones. Such separation is important especially for wildlife habitat mapping, as lifted roads representing different ecology with more herbaceous. (Fahrign
and Rytwinski, 2009)
The development of airborne LiDAR (Light Detection And Ranging) technology provides good opportunity to improve forest roads identification due to its ability to capture the vertical structures of surface objects complementary to the spectral information from passive optical imagery.In this study, we exploited the integration of LiDAR and passive optical imagery to improve the extraction of forest roads. To do so, we developed a knowledge-based method to progressively extract roads with different levels of details. This approach was tested on Hearst Forest, Ontario Canada and the results were visually validated against manually digitized roads.
2. STUDY AREA
mounted in a Cessna 310 aircraft with average 1.677 pulses per square meter.
Figure 1: The optical imagery of study site displayed in false colour composite with the near-infrared band displayed as red, red as green and green as blue.
3. METHODOLOGY
In this study, two types of roads have been identified and extracted. The primary road is defined as wide and paved roads with ditches on both sides, which is also been marked as a lifted road. The secondary road is defined as straight and flat road with full/partial vegetation coverage.
The developed method included the following steps: (1) the extraction of the road candidates; (2) the detection of primary roads; and (3) the detection of secondary and tertiary roads. In the following, these steps are described one by one in details.
3.1 The extraction of the road candidate
In terms of identifying all potential road segments, customized Laplacian of Gaussian (LoG) filter was employed. Traditionally, a three-dimensional LoG filter was generated with same x and y variance to form a shape of Mexican hat for blobs/tree crowns detection. (Jing et al., 2012) However, with different x and y variance, elongated ellipsoids can be generated as a narrow stripe shape to represent the spectral shape of the road. Before the selection of the matching templates, a median filter with 3 x 3 window size was employed to remove the shadows between trees along the side of the roads.
To identify the road segments, a training sample was employed to serve as the template for performing the image matching. Typically, a part of a straight road with a clear view is a good choice for such purpose. A customized LoG filter that has the shape best fits road training sample in the study area was generated, as shown in Figure 2. It worth mention that normally the spectral shape of the roads has high values in the middle and low values on the side (shape of Gaussian) as pavement has higher reflectance than the surroundings. However, in this study, the sunlit angle is low that makes the road covered by shadows of trees on the side. Therefore, LoG template was employed instead of a Gaussian template. In
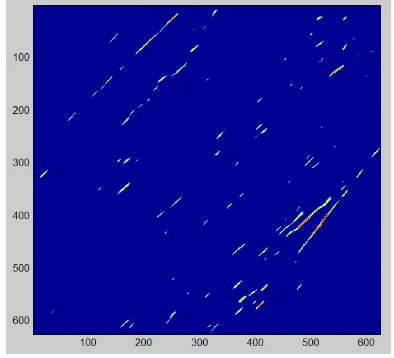
addition, to locate the roads with a different direction, LoG filter was designed to be rotated at user controlled angles to find roads that extended to all directions. At each window location, the cross correlation coefficient was computed and the resulting response map is shown in Figure 3.
Figure 2: Customized LoG filter at 45 degrees with a 30 by 30 window size
Figure 3: Correlation coefficient response map generated from the correlation between the rotated LoG and the gray scaled road image of the near infrared, red and blue band with the color from red to blue indicated the correlation from high to low.
In the correlation coefficient map shown in Figure 3, the color shaded red to blue indicates the variation of the correlation coefficient decreasing from 1 to 0. A correlation coefficient value close to 1 indicates a good match between the template and the moving window in the test site, while the coefficient value close to 0 indicates non-match. Generally, a threshold value of 0.7 is chosen and if the correlation coefficient exceeds that value, the area is assumed to match with the template. (
Wolf and DeWitt, 2000)
Therefore, the road segments are located within the orange to red area in the correlation coefficient map.3.2 The detection of primary road
As primary roads are defined as lifted roads with ditches on both sides, height information was required to identify the elevated road edges. Therefore, LiDAR DEM was employed to detect such roads, as the slope of the DEM was calculated. To be more specific, a plane to the z-values of a 3 x 3 neighborhood was fitted around the center pixel, and the slope value of this plane is calculated using the average maximum technique. (
Burrough, and McDonell, 1998)
It was calculated as the rates of change of the surface in the horizontal (dz/dx) and vertical (dz/dy) directions from the center pixel, the equation is shown in the following:2
As slope value indicates a variation on the terrain, the primary road was located through ditches identification (area with higher slope than neighbours). A threshold (determined from training samples) was set to extract the road edges. Resulting candidates form the layer of primary road segments.
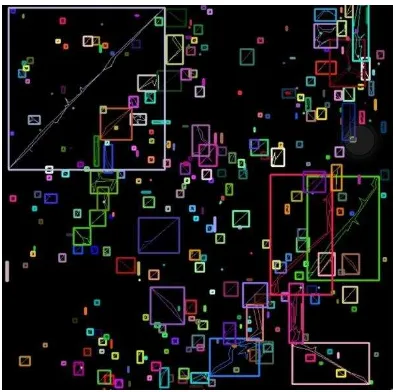
For all the primary road candidates, they were overlapped with the road segments generated from the LoG matching process to get the primary road map. Different from other studies find the road locations by intersecting the pixels, this research used an objected based process to topologically find the road segments and also create a result in continues line features rather than image pixels. First, bounding boxes and contour lines were created for both road segment and primary road candidates, as shown in Figure 4. This step treats each segment as an individual object rather than a group of pixels. Second, all the bounding boxes from those two images were overlapped together to topologically comparing the locations. Road segment was tagged if one primary road candidate falls tone, and the background is indicated as the black area.
3.3 Detection of secondary and tertiary roads
After the primary roads were found, additional work was done to select secondary and tertiary roads from LoG matching generated road segments. As the matching processing identified object based on its shape, result contained features that have the road-like shape but not the road. To eliminate such false alarm, iso cluster classification was employed to analyze the spectral signatures of each segment. The iso cluster is an iterative clustering procedure that uses the minimum Euclidean distance as the criteria for assigning each candidate pixel to a cluster. At each iteration, samples are assigned to existing cluster centers and new means are recalculated for every class. (
Richards, and Richards, 1999).
All road segments were classified into two classes, pixels have the same spectral signature as the primary roads are marked as roads, and exported as the final road map.3.4 Post Processing
By applying the spectrum theorem, the tensor T in Eq. (2) can be expressed as a linear combination of three basis tensors (ball, plate, and stick) as in eq.3.
(3)
where describes a stick (surface) with associated saliency ( ) and normal orientation ,
and describes a plate (curve) with associated saliency and no orientation preference.
As a tensorial representation can capture the geometric information for multiple feature types (straight line or curve) and a saliency, or likelihood, associated with each feature type passing through a point, and the hypothesis does not need to be set in advance, it was used to connect discontinued road segments.
4. RESULTS AND DISCUSSION
4.1 Forest road detection result
To test the advanced LoG matching method developed in this study, two test areas were selected from the study area. One has the size of 625 by 625 meters, referred to as Test Area # 1 and the other is 1024 by 1024 meters, referred to as Test Area #2.
With the first test area, 30 pixels by 30 pixels moving window was used to compare the LoG with all possible window locations within the optical imagery red band, where the roads have the most distinct boundary from the nearby vegetations. To find road segments at all directions, six rotation angles ranging from 0 to 180 were selected. The result of forest road segments that generated from LoG matching is shown in Figure 5(a) below.
Visual evaluation of Figure 5(a) shows that most of the roads have been correctly identified, especially for the primary roads that are wide and have distinct boundary from the surroundings. Secondary and territory roads that pass through the woods were successfully identified as well. This demonstrates the advance of the proposed method, as others often unable to detect such roads. However, the process failed to identify all the roads from the open area, i.e. roads passing bare soil. The reason accounting for the unsatisfactory result is that the LoG matching process is based on the assumption that road surface is covered by nearby tree shadows, which create a valley like spectral shape, while the roads in the open area have the opposite spectral shape. Since no template can detect mountains and valleys at the same time, future researches will work on detecting these two types of feature separately, and intelligently integrate them together.
In terms of primary road extraction, threshold DEM slope result is shown in Figure 5(c). As slope was calculated pixel by pixel, the result road candidates are isolated and do not represent the actual feature of the road. Therefore, those road candidates were used as markers to locate the road segments are primary roads. After the topological overlapping process, only primary road segments are selected, and form the vector primary road map. Although results show improvements as roads are in continues features, it has a drawback that the process highly depends on the extraction of road segments from LoG matching. As demonstrated in the upper right of Figure 5(c) a primary road was identified from DEM slope, but no road segments were extracted in that area, such road did not appear in the final road map.
After the primary roads are extracted, Iso cluster classification was employed to eliminate the commission error by separating the segments into the road and non-road features. Among all road segments, there are miss identified segments as the edge of the forest and passes in the middle of the forest. The result is shown in Figure 5(b). Classification result shows that the paths within the forest and along the side of the roads were successfully classified as non-road segment and can be eliminated, while one territory road on the lower left corner was falsely classified as a non-road segment. The reason account for that is that territory road is passing through the forest and covered by lower vegetations, such as bushes, and
this makes its spectral signature different from other roads whose surface are pavements and dirt.
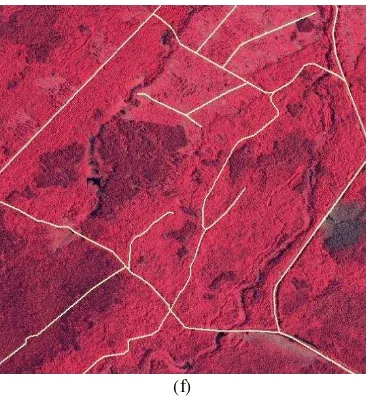
With the road segments filtered out from the Iso Cluster classification, the edge of the water creeks was removed as shown in Figure 5(d), and road network was generated from tensor voting from post processing. Final road map overlaid with the red band from the original image is shown in Figure 5(e). By visually compared with manually digitized roads shown in Figure 5(f), it can be seen that most of the roads were successfully extracted, while some secondary/territory roads or part of them are missing. As this study area is challenging due to a large number of roads that are partially occluded, which create a non-uniformed spectral shape that makes it difficult for template matching and resulting incomplete extraction of those territory roads.
(a)
(c)
(d)
(e)
(f)
Figure 5: Road extraction result by proposed LoG matching method (a) Road segments generated from initial LoG matching with each segment indicated by blue lines, and the background is a red band of optical imagery. (b) Iso Cluster classification result with road class indicated in green lines and non-road class indicated in blue lines. (c)Primary road locations generating from the threshold of DEM slope with road candidates colored in yellow, and the background is gray scaled DEM. (d) Final primary road map resulting from topologically overlapped with road segments, with road polygons colored in yellow, and the background is gray scaled DEM. (e) Final forest road detection result after post processing. Each road segment is indicated by red lines, and the background is a red band of optical imagery. (f) Manually digitized road. Each road is on yellow lines, and the background is the false color optical imagery with the near-infrared band displayed as red, red as green and green as blue
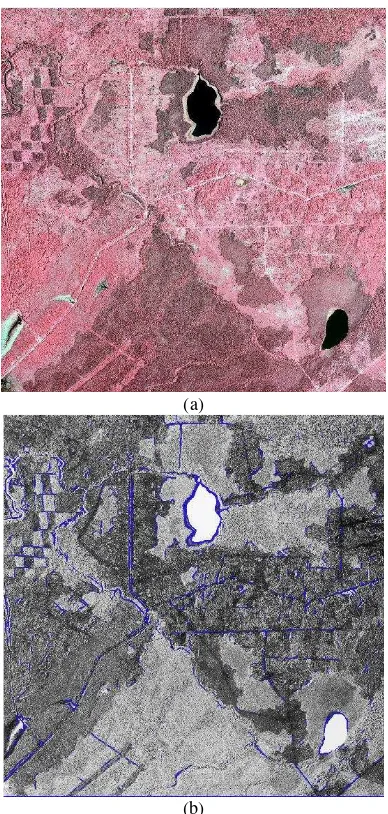
(a)
(b)
Figure 6: Algorithm validation through additional test area. (a) The false colored optical imagery of the test area with the near-infrared band displayed as red, red as green and green as blue. (b) The road segments generated from the proposed algorithm are coloured in blue and overlaid on the optical image red band.
4.2 Sensitivity analysis
To demonstrate how the shape of the LoG template affects road identification result, three different templates were tested. Templates and their corresponding matching results are shown in Figure 7(a)-(f). It can be seen that with template width goes from narrow to wide, the number of road segments identified decreased. However, with the narrowed template, false identified objects appeared more in the result. There is always a trade-off between the number of subjects identified and the commission error. The more road segments to be identified, the more noise will come with it. To balance between the result and its commission error, the template was chosen based on the training road sample.
Figure 7: Effects of template shape on LoG matching result. (a) LoG filter with direction std = 1.75. (b) LoG filter with x-direction std =2.25. (c) LoG filter with x-x-direction std =2.75. (d) Road segments resulting from LoG matching with the template (a). (e) Road segments resulting from LoG matching with the template (b). (f) Road segments resulting from LoG matching with the template (c).
Besides the shape of the template, window size also influences the LoG matching result. For this purpose, three different templates were tested. Templates and their corresponding matching results are shown in Figure 8(a)-(f). With a small window that includes part of the template was unable to identify most of the roads. On the other hand, when the window size covers greater than the template, the number of road segments detected does not increased but more noise appeared. In this study, a window size that best fit the template was used to find the most roads while keeping the noise minimum.
Figure 8: Effects of window size on LoG matching result. (a) LoG filter with window size = 15. (b) LoG filter with window size =25. (c) LoG filter with window size =40. (d) Road segments resulting from LoG matching with the template (a). (e) Road segments resulting from LoG matching with the template (b). (f) Road segments resulting from LoG matching with the template (c).
5. CONCLUSION
In this paper, an advanced LoG matching method has been presented. While other researches identify the road focusing on its spectral features, this study use knowledge based template matching method that utilized both spectral and shape features.
(a) (b) (c)
(d) (e) (f)
(a) (b) (c)
Based on visual examination against manually digitized roads, almost all the roads have been identified. The preliminary results show that all the primary roads could be accurately detected. In addition, most “secondary roads” could be detected using LoG filter; but detection of “trails” that has low vegetation covered was proved to be difficult.
ACKNOWLEDGEMENT
The authors are gratefully acknowledged to Hearst Forest management Inc. for providing the LiDAR data and to Ontario Ministry of Natural Resources for providing the very high resolution aerial imagery. This research was made possible from financial support Natural Sciences and Engineering Research Council (NSERC).
REFERENCES