MONITORING SPATIOTEMPORAL CHANGES OF HEAT ISLAND IN BABOL CITY
DUE TO LAND USE CHANGES
S.K. Alavi Panaha*, M. Kiavarz Mogaddam b, M. Karimi Firozjaeic
a Professor of Remote Sensing and GIS, Department of Remote Sensing and GIS, University of Tehran, Tehran, Iran - [email protected]
, Tehran University of ,
Department of Remote Sensing and GIS Sensing and GIS,
of Remote Assis. Prof
b
Tehran, Iran - [email protected]
, Tehran University of ,
Department of Remote Sensing and GIS Sensing and GIS,
of Remote Student
. MSc c
Tehran, Iran - [email protected]
KEYWORDS: Monitoring, Spatiotemporal, Land-use, UHI, Babol
ABSTRACT
Urban heat island is one of the most vital environmental risks in urban areas. The advent of remote sensing technology provides better visibility due to the integrated view, low-cost, fast and effective way to study and monitor environmental and humanistic changes. The aim of this study is a spatiotemporal evaluation of land use changes and the heat island in the time period of 1985-2015 for the studied area in the city of Babol. For this purpose, multi-temporal Landsat images were used in this study. For calculating the land surface temperature (LST), single-channel and maximum likelihood algorithms were used, to classify Images. Therefore, land use changes and LST were examined, and thereby the relationship between land-use changes was analyzed with the normalized LST. By using the average and standard deviation of normalized thermal images, the area was divided into five temperature categories, inter alia, very low, low, medium, high and very high and then, the heat island changes in the studied time period were investigated. The results indicate that land use changes for built-up lands increased by 92%, and a noticeable decrease was observed for agricultural lands. The Built-up land changes trend has direct relation with the trend of normalized surface temperature changes. Low and very low-temperature categories which follow a decreasing trend, are related to lands far away from the city. Also, high and very high-temperature categories whose areas increase annually, are adjacent to the city center and exit ways of the town. The results emphasize on the importance of attention of urban planners and managers to the urban heat island as an environmental risk.
1. INTRODUCTION
In the last decades, the earth surface experienced various changes due to human activities such as deforestation and cities expansion (Brunsell, 2006). These widespread human changes pose several adverse problems. For instance, an environmental qualitative decrease. Which culminates in the reduction of living quality is the result of these adverse changes (Wu, 2014). The heat island is the warming of the urban environment due to oblivious effects of unstable urban expansion (Amiri et al., 2009). Urban heat islands are known as current urban phenomena in which some urban areas such as, city centers are warmer than the suburbs (Chandler, 1970). The precise comprehensive study of this phenomenon and investigation of its mechanism play a vital role in the urban planning. Replacing natural land cover with urban phenomena, inter alia, pavements, buildings, concrete and the other urban constructions, are discerned as the main factors of creating heat island, which make the land surface cooling effects to be vanished. Moreover, skyscrapers and narrow streets diminish the airflow and give rise to an increase in the environment temperature. All these factors take part in the formation of urbanheat island (Liu and Zhang, 2011; Xu et al, 2011). In addition, several serious factors such as heat and pollution from vehicles, industries and big factories, equipment of air refining and other human activities increase the air temperature and exacerbate the heat island effects (Yuan, F., & Bauer, 2007). The first crucial effect of the urban heat island is the rise in energy, water and electricity consumption and subsequently noticeable increase of per capita financial burden especially in hot months of the year (Santamouris and Kolokotsa, 2015). The remote sensing images are known as an appropriate
* Corresponding author
information resource for preparing heat maps and also benefit from widespread applications for the precise investigation of climate changes and urban and non-urban land use changes, due to the continuous and extensive coverage, timeliness and the ability to acquire information in the reflective and thermal range of electromagnetic waves (Voogt and Oke, 2003; Weng, 2009; Jiménez-Muñoz and Sobrino, 2010). The NOAA AVHRR sensor data were primarily used in several studies in which the urban heat situation was investigated by using thermal infrared data (Gallo et al., 1993). The spatial resolution of the thermal band for all the situation in this study was 1.1 Km which is merely suitable for preparing small scale map of the city temperature. The ability to extract the LST and precise study of urban heat islands are facilitated by using thermal infrared Landsat (TM, ETM+ and TIRS) and ASTER data, and there are several studies in this regard in the literature (Chakraborty et al., 2015; Chen et al., 2006; Weng, 2001).
Most northern cities of the Iran including Babol have been profoundly affected by the urban unbalanced expansion and destruction of suburban agricultural lands and green space. Therefore, in this study, the amount of changes of both land uses and spatial- changes of the Babol heat islands in the temporal range of 1985-2015 were investigated
2. STUDIED AREA
mountains and in the distance of 15km from the Caspian sea and 210 km from northeast of the Tehran. The height of this city is 2 meters lower than the sea level. Figure. 1 shows the location of the studied area.
Figure 1. Location of the studied area.
3. DATA AND METHODOLOGY
1.1 Data
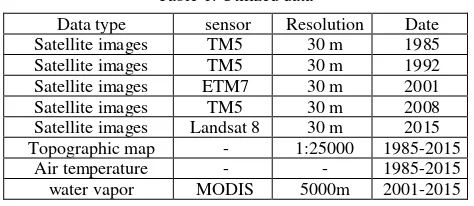
In this study, satellite images of Landsat 5, 7 and 8 are used. In order to investigate the geometric accuracy of available maps, topographic used. For completing input parameters to prepare the land surface map from satellite images, air temperature data acquired by the Mazandaran meteorology organization and the product of moisture and water vapor sensor of MODIS are exploited. The utilized data are presented in Table 1.
Table 1. Utilized data Topographic map - 1:25000 1985-2015
Air temperature - - 1985-2015
water vapor MODIS 5000m 2001-2015
1.2 Preprocessing
In order to investigate data quality and to recognize geometric and radiometric errors, data were primarily examined. Regarding the fact that aforementioned images are georeferenced, the geometric correction was performed by attaching the image to the map before commencing processing and images comparison. Then, all the images were corrected by using FLAASH atmospheric correction algorithm owning to the importance of radiometric and atmospheric effects on the final results.
1.3 Images classification and changes detection
Land use classes in the studied area were identified regarding to the complete knowledge of the researcher about the area and also field visits. These classes include built-up lands, agricultural lands, green space and water body. Before supervised classification of images, training data should be carefully chosen. In this stage, training data for all four classes to be used in the supervised classification processing were prepared by means of visual interpretation and researcher information about the studied zone. Maximum likelihood classification was used to classify images. After images classification process, the classification
accuracy was examined by exploiting topographic map of 1:25000. Eventually, the area related to uses in all years were extracted after controlling the classification accuracy and confirming meaningfulness of errors. So as to recognize changes during the studied period, classified images were compared. For precise investigation and analysis of changes, the cross tab model was used.
1.4 LST retrieval
Estimation of LST from Landsat data requires a systematic methodology. The DN (digital number) values of pixels have been converted to at-sensor spectral radiance (Ls) as a preliminary step for thermal image processing (Chander et al., 2009).The at-sensor spectral radiance to at-sensor brightness temperature (Ts) has been estimated using the inverted Planck’s Law with an assumption that the earth surface is a black body with an emissivity value equal to 1 (Walawender et al., 2014).A single-channel (SC) LST estimation algorithm (Chander et al., 2009; Walawender et al., 2014; Sobrino et al., 2004; Jiménez-Muñoz et al., 2014) has been applied for final LST retrieval.
LST=γ[1(ψ δs+ψ2)+ψ3]+ (1)
Where � is the land surface emissivity (LSE) and and are the Planck’s functions dependent parameters which can be estimated using (2), (3): m K) are the Planck’s radiations constants and is the effective wavelength for the thermal bands ( = 11.457 for Landsat 5 TM, = 11.270 for Landsat ETM+ and = 10.904 for Landsat 8/TIRS B1). The SC algorithm applied here is unique as it incorporates atmospheric correction and takes into account the varying emission properties of the representative land surfaces. ψ1, ψ2, ψ3 are the atmospheric functions, which are related to the water vapor content of the atmosphere and can be calculated by (4), (5) (Jiménez-Muñoz et al., 2014):
Pv=(NDVIv-NDVIsNDVI-NDVIs) (6)
The corrected emissivity of bare soil (εs) and full vegetation (εv) pixels have been set to 0.96 and 0.99 respectively. For the water bodies, a new emissivity value of 0.995 has been fixed due to very low reflectance of water bodies in the thermal infrared spectral range (Walawender et al., 2014). The emissivity for the mixed pixel (NDVIs≤NDVI≤NDVIv) has been calculated using (7) (Sobrino et al., 2004; Sobrino et al., 2008).
= vλ×Pv+ sλ× -Pv +Cλ (7)
Where Cλ is the correction factor estimated for reducing the cavity effect due to surface roughness.
Cλ= 1-sλ × vλ×F,× -Pv (8)
where F’ represents the geometrical factor depending on the surface distribution; in this work, the mean value of F’= 0.55 has been fixed for the rough and heterogeneous surface (Sobrino et al., 2008).
1.5 Investigation of heat island
For investigating spatiotemporal changes of heat island, surface temperature data were analyzed using statistical methods. In this study, all images were normalized utilizing maximum and minimum temperature parameters. (9) Was exploited to normalize images (Xu et al., 2011).
Ni=Tmax-TmaxTi-Tmin (9)
Where Ni is a normalized number of ith pixel, T
i is absolute number of ith pixel, T
min and Tmax are minimum and maximum temperature of each image respectively. Is Then, normalized images were classified into five temperature classes by using average value and standard deviation (Xu et al., 2011). In Table 2, Tmean indicates the mean temperature of each normalized image and STD is the standard deviation of each normalized image.
Table 2. Classification of the surface temperature Temperature class Class range Very low temperature T ≤ T ea − .5STD
Low temperature Tmean-1.5STD<T≤Tmean-STD
Medium temperature Tmean-STD<T≤Tmean+STD High temperature Tmean+STD<T≤Tmean+1.5STD
After classification of surface temperature data of each image, the temperature value of each class was calculated and the increasing or decreasing trend of each temperature class in the studied period was investigated.
4. RESULTS AND DISCUSSION
The geometric correction of each Image was accomplished with a mistake less than 0.5 pixel. The resultant data of the classification accuracy assessment are shown in Table. 3.
Table 3. Accuracy asssessment results of the produced land use Year KAPPA COEFFICIENT OVERALL ACCURACY
1985 0/91 92/2
1992 0/89 90/1
2001 0/92 93
2008 0/94 94/6
2015 0/9 92
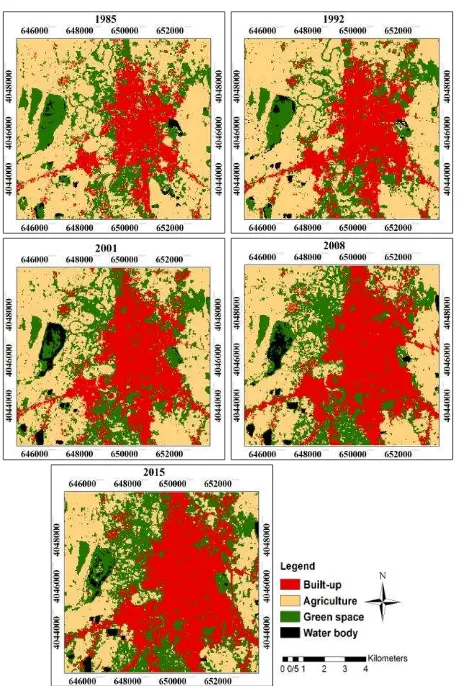
The produced land use maps in the studied period are presented in Figure. 2. The areas of different land use classes in the period of 1985-2015 are presented in Table 2.
Figure 2. Results of the land use classification: 1985; 1992; 2001; 2015.
Table 4. Areas of the Land use classes in the period of 1985-2015 (ha)
1.6 Analysis of the land use changes
The obtained results of the land use changes detection during the studied period are presented in Table. 4.
Table 5. Cross-tab of land use classes between 1985–2015 (ha) 1985-2015
BUILT-UP
AGRICULTU RE
GREEN
SPACE WATER BUILT-UP 1218.96 740.52 472.14 3.51 AGRICULTURE 8.1 1894.68 157.68 13.23
GREEN SPACE 38.79 1132.92 833.49 3.132
WATER 0.9 5.49 93.24 22.50
Bases on the results summarized in Table 4a decreasing trend can be observed for the agricultural land areas since 1985 until 2015. The green space usage increased from 1656.55 hectares in 1985 to 2036.52 hectare in 2015 and a 23% rise achieved. The green space usage growth in suburbs is thoroughly evident by transformation of the agricultural lands to the citrus groves. The built-up area had a remarkable increasing trend during the studied period. In 1985, 19% of the total area with a rise of 1169.11 hectares succeed 36.52% of total area in 2015.
1.7 The relation between the LST and various land uses
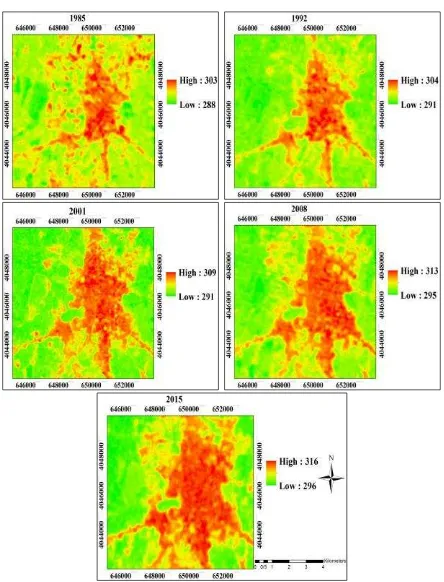
The obtained surface temperature maps for the area during 1985-2015 are shown in Figure. 3 and the average surface temperature for each land use during this period is extracted and presented in Table 4.
Figure 3. Results of LST for the years 1985; 1992; 2001; 2008; 2015
Table 6. The average surface temperature of various land uses during 1985-2015
LU BUILT-UP AGRICULTURE GREEN
SPACE WATER
1985 299 293.87 294.1 290.89
1992 301.3 295.06 296.7 292.87
2001 304 298 298.15 293
2008 308 300 300 294.2
As can be seen in Table 4, built-up areas have a higher average temperature compared to the other areas during these years due to human activities which produce heat and man-made features. The high heat capacity value of the water leads to the least average temperature of water bodies. Owning to the high moisture of the agricultural areas and more activity of evaporation and transpiration, the average temperature of the agricultural lands is less than that of green space lands in most years. The average temperature of all land uses increased during the studied period. Nevertheless, the rate of temperature rise is higher in the built-up areas. The rise in the number of commercial and industrial centers, increasing of the vehicular traffic compared with previous years, and formation of heavy traffic in the communication paths leading to the cities are the major factors of the surface temperature rise in the built-up lands.
1.8 An investigation into spatiotemporal changes of heat
islands
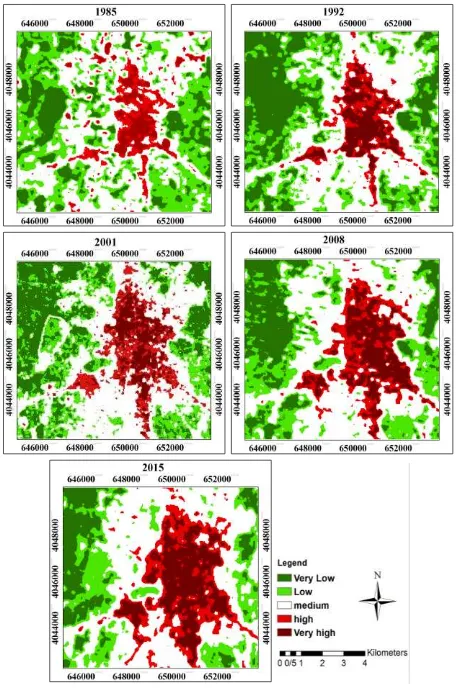
Thermal images related to different years were normalized using maximum and minimum surface temperature values to investigate spatiotemporal distribution of heat islands. Then, normalized thermal images were classified into five temperature classes by using average and standard deviation values (figure. 4).
Figure 6. The surface temperature classification map
After classification of normalized thermal data to temperature classes, the area of each class was calculated and its changes over the studied time period were assessed. The areas of different Temperature classes from 1985 to 2015 were presented in Table 5.
Table 7. Area of the Temperature classes in 1985-2015 Class Very
Low Low Medium High
Very High 1985 1142.91 1947.69 2842.92 438.66 294.48 1992 1709.1 1426.95 2605.05 488.75 436.72 2001 1449 1332.27 2763.81 659.25 461.88 2008 1213.56 1333.71 2717.28 650.52 751.5 2015 850.23 1172.7 2846.7 815.49 981.45
It can be seen from Figure. 4 that in all the five years, the maximum area belongs to medium temperature class. According to existing agricultural areas and also city physical expansion, the areas of low and very low-temperature classes decreased and high and very high-temperature classes experienced a striking increase among the areas. Moreover, population growth, industries, numerous vehicles in the city, and crowded communication paths are also known as the main causes of increase in the areas of high and very high-temperature classes.
5. CONCLUSION
In this study, by using a combination of thermal and reflective multi-temporal data and using algorithms related to remote sensing method as well as a geographic information system, land use changes and city physical expansion in the studied area during 1985-2015 were precisely and comprehensively investigated. Moreover, land use changes and city physical expansion effects on city heat island and the spatiotemporal changes in the considered time period were examined. Results imply that a rise in the surface temperature leads to a decrease in agricultural and green space areas. The built-up areas experienced the highest average temperature in all years due to human activities which produce heat and chemical and physical features of built-up components such as asphalt and cement. Evaporation and transpiration occured in the vegetation area, as well as the formation of shadow, give rise to less average temperature of green space lands. Compared to green space lands, agricultural lands benefit from a lower average temperature owning to high moisture and greenness. Built-up lands changes follow a reverse trend compared with vegetation cover changes and have a direct relation with normalized surface temperature changes. The most land use changes in the studied area belong to changes of agricultural and green space into built-up areas in suburbs, which are 740.52 and 472.14 hectares, respectively. As a result, 92% rise was observed for the built-up area. The value of the decrease in agricultural and green space areas are equal to the value of the increase in areas of lands with high and very high temperature. Consequently, the agricultural and green lands play a vital role in diminishing the surface temperature. The most extensive temperature classe between 1985 and 2015 relate to medium temperature class which belongs to suburbs. Low and very low-temperature classes which follow a decreasing trend, relate to lands far away from the city. Also, high and very high-temperature classes whose areas increase annually, correspond to the city center and exit ways of the town. The urban heat island is one of the most indispensable environmental risks in urban areas which directly and indirectly affects urban and non-urban areas climate, urban air pollution, and greenhouse gasses. Its effects on global warming, thermal welfare, and a rise in consumption of water and electricity as well as exacerbating diseases such as asthma are inevitable. Therefore, research and investigation in this case, as well as proposing usable solutions, are so useful and practical. The obtained results indicate that using remote sensing data provides a better insight into the formation and expansion of the urban heat island (the meaning of this sentence seems incorrect!).
6. REFERENCES
land surface temperature in relation to fractional vegetation cover and land use/cover in the Tabriz urban area, Iran. Remote sensing of environment, 113(12), PP. 2606-2617.
Brunsell, N. A. 2006. Characterization of land-surface precipitation feedback regimes with remote sensing. Remote Sensing of Environment, 100(2), PP. 200-211.
Chakraborty, S. D., Kant, Y., & Mitra, D. 2015. Assessment of land surface temperature and heat fluxes over Delhi using remote sensing data. Journal of environmental management, 148, 143-152.Chandler, T. J. (1970). Selected bibliography on urban climate. Tech (No. 155). note.
Chander, G., Markham, B. L., & Helder, D. L. 2009. Summary of current radiometric calibration coefficients for Landsat MSS, TM, ETM+, and EO-1 ALI sensors. Remote sensing of environment, 113(5), PP. 893-903.
Chandler, T. J. 1970. Selected bibliography on urban climate. Tech (No. 155). note.
Chen, X. L., Zhao, H. M., Li, P. X., & Yin, Z. Y. 2006. Remote sensing image-based analysis of the relationship between urban heat island and land use/cover changes. Remote sensing of environment, 104(2), PP. 133-146.
Chen, X. L., Zhao, H. M., Li, P. X., & Yin, Z. Y. 2006. Remote sensing image-based analysis of the relationship between urban heat island and land use/cover changes. Remote sensing of environment, 104(2), PP. 133-146.
Gallo, K. P., McNab, A. L., Karl, T. R., Brown, J. F., Hood, J. J., & Tarpley, J. D. 1993. The use of NOAA AVHRR data for assessment of the urban heat island effect. Journal of Applied Meteorology, 32(5), PP. 899-908.
Jiménez-Muñoz, J. C., & Sobrino, J. A. 2010. A single-channel algorithm for land-surface temperature retrieval from ASTER data. IEEE Geoscience and Remote Sensing Letters, 7(1), PP. 176-179.
Jiménez-Muñoz, Juan C., et al. 2014. Land surface temperature retrieval methods from Landsat-8 thermal infrared sensor data. IEEE Geoscience and Remote Sensing Letters 11.10 PP. 1840-1843.
Liu, L., & Zhang, Y. 2011. Urban heat island analysis using the Landsat TM data and ASTER data: A case study in Hong Kong. Remote Sensing, 3(7), PP. 1535-1552.
Santamouris, M., & Kolokotsa, D. (2015). On the impact of urban overheating and extreme climatic conditions on housing, energy, comfort and environmental quality of vulnerable population in Europe. Energy and Buildings, 98, 125-133.
Sobrino, J. A., & Raissouni, N. 2000. Toward remote sensing methods for land cover dynamic monitoring: application to Morocco. International Journal of Remote Sensing, 21(2), PP. 353-366.
Sobrino, J. A., Jiménez-Muñoz, J. C., & Paolini, L. 2004. Land surface temperature retrieval from LANDSAT TM 5. Remote Sensing of environment,90(4), PP. 434-440.
Sobrino, J. A., Jiménez-Muñoz, J. C., Sòria, G., Romaguera, M., Guanter, L., Moreno, J., ... &
Martínez, P. 2008. Land surface emissivity retrieval from different VNIR and TIR sensors. IEEE Transactions on Geoscience and Remote Sensing, 46(2), PP. 316-327.
Sobrino, J. A., Jiménez-Muñoz, J. C., Sòria, G., Romaguera, M., Guanter, L., Moreno, J., ... & Martínez, P. 2008. Land surface emissivity retrieval from different VNIR and TIR sensors. IEEE Transactions on Geoscience and Remote Sensing, 46(2), PP. 316-327.
Voogt, J. A., & Oke, T. R. 2003. Thermal remote sensing of urban climates.Remote sensing of environment, 86(3), PP. 370-384.
Walawender, J. P., Szymanowski, M., Hajto, M. J., & Bokwa, A. 2014. Land surface temperature patterns in the urban agglomeration of Krakow (Poland) derived from Landsat-7/ETM+ data. Pure and Applied Geophysics, 171(6), PP. 913-940.
Walawender, J. P., Szymanowski, M., Hajto, M. J., & Bokwa, A. 2014. Land surface temperature patterns in the urban agglomeration of Krakow (Poland) derived from Landsat-7/ETM+ data. Pure and Applied Geophysics, 171(6), PP. 913-940.
Weng, Q. 2001. A remote sensing - GIS evaluation of urban expansion and its impact on surface temperature in the Zhujiang Delta, China. International journal of remote sensing, 22(10), PP. 1999-2014.
Weng, Q. 2009. Thermal infrared remote sensing for urban climate and environmental studies: Methods, applications, and trends. ISPRS Journal of Photogrammetry and Remote Sensing, 64(4), PP. 335-344.
Wu, J. 2014. Urban ecology and sustainability: the state-of-the-science and future directions. Landscape and Urban Planning, 125, PP. 209-221.
Xu H., Y. Chen., S. Dan., W. Qiu. 2011. Spatial and temporal analysis of urban heat island effect in Chengdu city by remote sensing. Geoinformatics, 2011 19th international conference on, shanghai, 24-26 June 2011, PP. 1-5.