Volume 25, Number 1, 2010, 41 – 58
DECENTRALIZATION AND ITS IMPACT ON PRIMARY
EDUCATION OUTCOMES
1Deniey Adi Purwanto
Institute for Development of Economics and Finance (INDEF) ([email protected])
ABSTRACT
Development outcomes nowadays not only measured by the successful of economic growth but more comprehensively by the achievement of human development. Obviously education has been place a one substantial factor not only as a basic human right but also in international development. Meanwhile after more than 8 years of decentralization in Indonesia, many concerns arise regarding the decentralization impacts. One of the considerable questions is on how far the fiscal decentralization has enhanced education development achievement. Therefore, a set of fiscal decentralization variables used in this paper to analyze their roles on primary education outcomes. Enrollment Rate used as dependent variable to represent the primary education outcomes. Regional characteristics were also utilized to improve the robustness of the result.
Using panel data set of 434 sub provincial regions (districts and cities) in Indonesia, the estimation result show that fiscal decentralization instrument played a significant role on primary education outcomes. Furthermore, DAK seems to have a greater impact on primary education outcomes than DAU. Additionally the estimation result also shows that there is still a significant disparity among sub provincial region in primary education achievement. The results suggest that fiscal decentralization instrument rearrangement substantially needed next to the education development equalization in all sub provincial region. This way, decentralization will foster more favorable outcomes in education development outcomes hopefully.
Keywords: decentralization, primary education, panel data.
INTRODUCTION1
Economic growth used to be the most common measurement to portray the deve-lopment outcomes. It measured how far have many factors in development utilized and contributed to the aggregate of national output. This measurement certainly has many significant contributions to the achievement of development. Certain level of economic
1
Paper Presented at the Second Indonesian Regional Science Association Conference (IRSA Institute) Organized by IRSA. Bogor, July 21-22, 2009.
As people evolved from the need for acceptable income to more appropriate quality of live, the problem of development was also mounting swiftly. This fact required more comprehensive measure that not only mea-sures the development achievement on pro-duction but comprehensively on the improving quality of live. That the reason why national development nowadays not only measured by the successful of economic growth but more by the achievement of human development. The human development brings together the development of education, health and econo-my as a mean of development.
As the rise of many industrial countries in East Asia, many studies reveal that the successful development was supported by the availability of adequate educated human resource. Meanwhile, qualified human resour-ce is the output of education development. Many international development agreements highlight the important role of education to resolve poverty, gender equality and social justice. This is the main reason why many countries in the world-including Indonesia- have prioritizing on education on their national development not only as important part of human development but also as the basic right of humanity. All fundamental reasons above have been put together as the groundwork of education development in Indonesia. One of notable program of national education development called Wajib Belajar Pendidikan Dasar 9 Tahun (Wajardikdas 9 Tahun). It is a 9 years compulsory education program set to be a primary education for a citizen of Indonesia. The program firstly introduced in 1994 and targeted to reach certain measure of outcomes in 2008/2009.
Meanwhile the development of Indonesia has trough a great reformation on development system in the past few years. As before being centralized, the development of Indonesia than being decentralized since the declaration of the law number 22/1999 regarding regional autonomy in Indonesia. The regional
auto-nomy law comes with the Law number 25/ 1999 regarding Fiscal Balance between Central and Regional Governments. The decentralization aimed to accelerate the public welfare through the improvements, services, and empowerment as well as improvement of regional competitiveness in the sense of of democracy, equal distribution of wealth, justice, special characteristics and uniqueness of certain regions within the system of the Republic of Indonesia.
The law 33/2004 regulates the decentra-lization of some government affair including the administering education. The decentra-lization in education then specifically regu-lated by the Government Regulation Number 38/2007. Basically under this regulation, the sub provincial government is responsible for education services in primary education that by the national education system are the pri-mary school and secondary school. Presently after more than 8 years of decentralization, many concerns arise regarding the decentra-lization impacts. One of the considerable questions is on how far the fiscal decentra-lization has enhanced education development outcomes. Therefore, the aim of this study is to analyze the impact of the decentralization to the outcomes of the primary education in Indonesia.
Primary Education in Indonesia
program in the national education system is the Wajib Belajar Pendidikan Dasar 9 Tahun (Wajardikdas 9 Tahun), introduced by Government in 1994. This compulsory education program is containing 6 years on primary school and 3 years on secondary school (junior high school). The program aimed for very citizen to have finished their primary education so that they will have appropriate jobs and contribute to national development substantially. This program was actually targeted achieve the target in 2003/2004. However the target was not accomplished since the economic crisis in 1997 has severely depressed not only econo-mic but also other multidimensional aspects of development in Indonesia.
The 9 years primary education program afterward became the current national government program (2004-2009 Periods). For this period, government targeted Primary school Net Enrollment Rate (APM) at 95% and Secondary School Gross Enrollment Rate (APK) at 98% in 2007/2008. Government has implemented many activities under the program from building new schools and class-rooms, rehabilitating schools and classclass-rooms, providing libraries and books, allocating block grant for school operations and the one that also crucial is increasing teachers. Especially to resolve citizen in remote area or very low density area the government also develops many primary integrated schools (Sekolah Satu Atap) and distance school (Sekolah Jarak Jauh). Nevertheless, government also intro-duced Kejar Paket A and B to provide primary education service more to the citizen.
Now after more than 3 years establish-ment, it is important to assess the implemen-tation and the outcomes of the program especially for the target to be achieved in 2008/2009. Since the primary education in this study was by definition is a compulsory education; Net Enrollment Rate (NER) for primary school and Gross Enrollment Rate
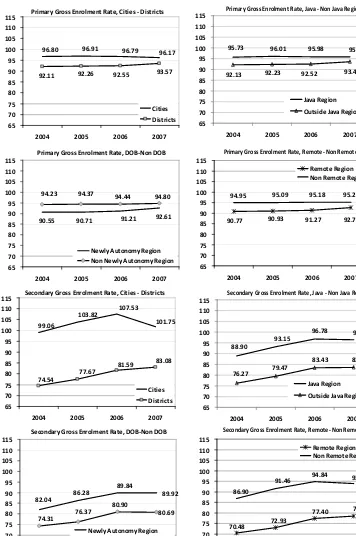
(GER) for secondary school was used to assess the achievement of primary education outcomes. These two outcomes indicator also used by the Ministry of National Education as the target of the program. Nationally the NER has presented a positive trend and reached the target by 2005 and 2006, which are around 95% (use to call “Tuntas Wajar”) and already beyond the target by 2007. The GER for secondary also shared the same story in national level. The trend was significantly increasing and reached the target around 98 % in 2007. However the achievement of NER and GER in provincial level may not as good as national level did. Some provinces (especially the one that known as the center of education) already reached or even over the target by 2007. However there were still many regions (provincial and sub provincial) that have not reached the target even in 2008 yet. The story happen rather the same between primary school and secondary school but with different magnitude. The inequalities turn out much wider for the secondary school GER.
Figure 1. Trend and Gap of Primary Outcomes Achievement between Regions
2004 2005 2006 2007
Newly Autonomy Region
Non Newly Autonomy Region
Secondary Gross Enrolment Rate, Remote‐ Non Remote
78.51
2004 2005 2006 2007
Remote Region
Non Remote Region
Secondary Gross Enrolment Rate, Java ‐ Non Java Region
2004 2005 2006 2007
Java Region
Outside Java Region
Secondary Gross Enrolment Rate, Cities ‐ Districts
99.06
2004 2005 2006 2007
Cities
Districts
Primary Gross Enrolment Rate, Cities ‐ Districts
96.80 96.91 96.79 96.17
92.11 92.26 92.55 93.57
65
2004 2005 2006 2007
Cities Districts
Primary Gross Enrolment Rate, Java ‐ Non Java Region
95.73 96.01 95.98 95.85
92.13 92.23 92.52 93.49
65
2004 2005 2006 2007
Java Region
Outside Java Region
Primary Gross Enrolment Rate, DOB‐Non DOB
2004 2005 2006 2007
Newly Autonomy Region
Non Newly Autonomy Region
Primary Gross Enrolment Rate, Remote‐ Non Remote
2004 2005 2006 2007
Remote Region
All the facts below show that the primary education outcomes should and be dealing with the decentralization issues. Put the analysis away a little bit from the outcomes, then the decentralization in education also dealing with minimum service standard, financing, curriculum, human resource mana-gement and all other aspects that have been regulated under government regulation. Under Government Regulation Number 38/ 2007 regarding Division of authorities between central government and regional government, the sub provincial governments are respon-sible for primary education services that by the national education system are the primary school and secondary school. The decentra-lization also played crucial part in primary education achievement from fiscal side, as it will be elaborate next.
Fiscal Decentralization and Primary Education
As the authorities-side of central govern-ment decentralized under the Law 22/1999, the fiscal-side of central government also decentralized to bear the implementation of regional autonomy and decentralization. Fiscal decentralization implemented vastly on the revenue side of government finance. First, through the Balancing Fund that allocation to regional government budgets either in provincial level or sub provincial level. The Balancing Fund consists of taxes revenue sharing and also non taxes revenue sharing. Secondly, the fiscal decentralization also implemented through General Allocation Fund (DAU) that allocated based on fiscal capacity of the provincial and sub provincial govern-ment. Basically this less conditioned-type transfer is allocated to bring fiscal capacity equality among the regions to finance the need of decentralization implementation. Further-more, there is also more conditioned-type transfer call Special Allocation Fund (DAK) that allocated to a certain region with the aim to support the financing of special activities of the region in accordance with national prio-rities. Beside the transfers and revenue
sharing, the regional governments also have their own revenue source to finance the development in their region namely Pendapatan Asli Daerah (PAD). Basically all these source of revenues have certain role in making successful development and service delivery including primary education.
How about the financing of education development especially the primary education services? In central government level, The Ministry of National Education contributed 26.34% for primary school and 18.65% for secondary school on average each year through 2005-2008. The difference between this source of financing and the one that managed by provincial and sub provincial government is that this source of financing directly allocated by the Ministry to local government bodies (dinas) in national education, not through decentralization fund. Basically the 9 years primary education program is the primary program of Ministry of National Education not only as the budget allocation for the program shared major portion to the total budget of Ministry of National Education but also as it significantly increased each year. As show in table 1, the 9 years primary education budget continually increased from 10.82 Billion IDR in 2005 to 23.96 Billion IDR in 2008. The budget also shared almost 50% each year to the total budget of Ministry of National Education and it also continually increased each year.
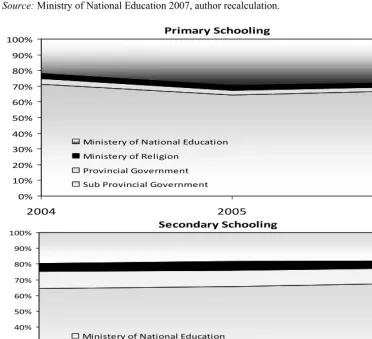
Furthermore as the education decen-tralization implemented, each of government bodies on every level of government plays their role in education services financing. In other world by the “money follow function” principle, the education decentralization can not only see by the decentralization of authorities between central government, provincial and sub provincial government; but also by their contribution on the financing. As it shows in figure 2, sub provincial govern-ments contribute more that 65% each year for primary education program either for primary school or secondary school.
Table 1. Trends in Primary Education Expenditure
Budget of 2005 2006 2007 2008
9 Years Primary Education Program (Wajardikdas) 10,817.4 20,286.8 20,455.6 23,951.5 Depdiknas General Expenditure 25,819.67 40,453.15 44,340.89 49,701.00 % 9 Years Primary Education Program 41.90% 50.15% 46.13% 48.19%
Source: Ministry of National Education 2007, author recalculation.
Source: MDGs 2007 Reports, Bappenas, Author Recalculation.
Figure 2. Sources of Financing Structure of the 9 Years Primary Education
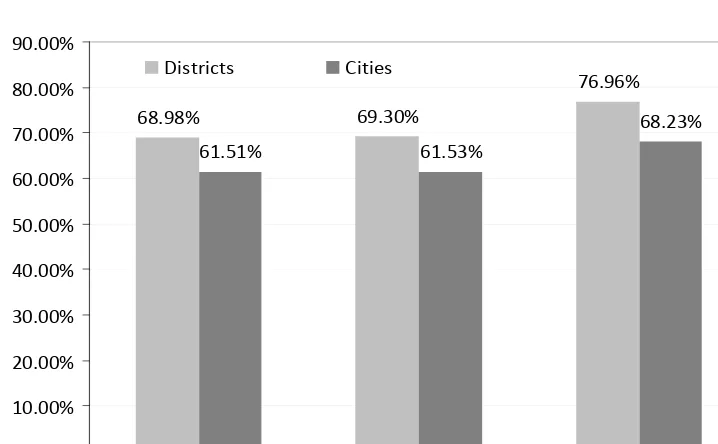
However it is important to notes that some of sub provincial government financing also came from central government financing through the fiscal decentralization instruments including the DAU. In other hand, DAU still the main source of revenue of sub provincial government. The DAU contributed more than
60% for city’s total revenue and more than 70% for district’s total revenue. Figure 3 emphasize than DAU shared revenue more to districts than cities. Additionally, DAU also consist of government apparatus salaries including teachers. Beside central government expenditure through the ministries, this fact Primary Schooling
0% 10% 20% 30% 40% 50% 60% 70% 80% 90% 100%
2004 2005 2006
Ministery of National Education
Ministery of Religion
Provincial Government
Sub Provincial Government
Secondary Schooling
0% 10% 20% 30% 40% 50% 60% 70% 80% 90% 100%
2004 2005 2006
Ministery of National Education
Ministery of Religion
Provincial Government
indicates that central government still played significant part in education development especially the primary education.
Additionally, the sub provincial contri-bution on primary education services is including the salary of educators and edu-cation personnel that have been decentralized by central government trough DAU. In contrast, as the amendment of 1945 Consti-tution of Indonesia underline that 20% of national and regional budget should be prio-ritized to fulfill the needs of national education implementation (article 31, paragraph 4); the Law number 20 year 2003 –regarding National Education System- Emphasis that the 20% minimum education budget of national and regional budgets excluding salary of educators and service education expenditure. Many regional governments and other related institution are still to decide what kind of formula better be use to determine the 20% budget portion for education. Beside this technical questions, what more important that
on macro side, this policy point out the improvement of government concern over primary education services as citizen basic right. Conversely in micro side, this policy becomes a challenge either for government bodies or regional governments to provide primary education services more effectively and more efficiently.
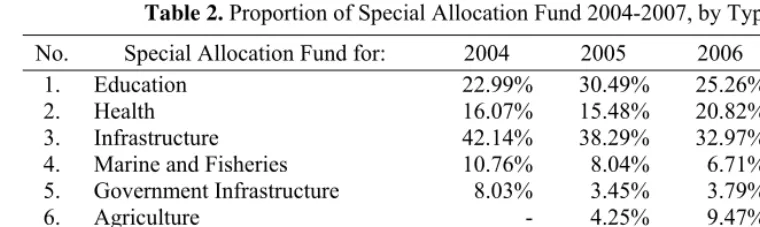
Another fiscal decentralization instrument that related to primary education services is the DAK. DAK allocated to certain areas of development that become national develop-ment priorities, including education. DAK for education strictly allocated for primary education development especially to build new schools and classrooms, libraries, and other supporting infrastructures including furniture and books. Table 2 show that in 2004-2007 period, on average of 27.28% of total DAK was allocated for education, second biggest portion after the DAK for infrastructure that allocated on average 35.71% during the same period.
68.98% 69.30%
76.96%
61.51% 61.53%
68.23%
0.00% 10.00% 20.00% 30.00% 40.00% 50.00% 60.00% 70.00% 80.00% 90.00%
2004 2005 2006
Districts Cities
Sources: Ministry of Finance, author recalculation.
DAK for Education might play significant role in primary education service and decen-tralization generally. This argument supported by DAK for Education terms and conditio-nality. First, the DAK for Education necessitated the availability of supporting fund (dana pendamping) provided by regional budget minimally 10% of the DAK for Education itself. This requirement endorses regional government to soundly participate in primary education development. Secondly, this fund prioritized to low fiscal capacity regions. Thirdly, the fund also prioritized to regions in remote area, border area, coastal and islands area, potentially flooded or food unsecured area, and other criteria related. The second and third conditionality converge to the decentralization objective that is to equalize regional development spatially and financially.
All fiscal decentralization instruments mentioned above, at some point played substantial contribution on financing of primary education services. By this fact, they should also play significant contribution on primary education outcomes. This hypothesis certainly without neglecting the contribution of direct output of education development (i.e.: schools, teachers) and by range of characteristic factors of the regions. Combining these 3 factors, this study is aims to scrutinize the impact of decentralization on primary education outcomes. This study could contribute some favourable output either in technical or policy issues for the improvement
of primary education development in Indone-sia especially in decentralization era hopefully.
DATA AND MODEL SPECIFICATION
Policy and program evaluation, commonly following a conceptual framework placed from the input, output, impact and the out-come of the policy and program implemen-tation. In this study, we are focusing to analyze how the fiscal decentralization and other factors- as the “input” of the policy- have affecting the outcome of primary education.
We used a dataset of all districts and cities in Indonesia range from 2004 to 2006. Although it will produce more robust output if more updated data (i.e. up to 2008) were use for the quantitative analysis, the 2004-2006 periods gave more favorable dataset in sub-provincial level (districts and cities). None-theless, updated dataset in provincial or national level were used either to emphasize some critical issues or to reinforce the quantitative analysis result.
The number of sub-national region in Indonesia has swiftly increased from 292 in 2001 to 459 in 2007 as the autonomy and decentralization policy open up the possibility to proliferation sub national and sub provincial region. However, there was an underlying rationale for not including some newly autonomous regions. Therefore, some newly autonomous regions that proliferated after
Table 2. Proportion of Special Allocation Fund 2004-2007, by Type
No. Special Allocation Fund for: 2004 2005 2006 2007
1. Education 22.99% 30.49% 25.26% 30.39%
2. Health 16.07% 15.48% 20.82% 19.78%
3. Infrastructure 42.14% 38.29% 32.97% 29.45%
4. Marine and Fisheries 10.76% 8.04% 6.71% 6.44%
5. Government Infrastructure 8.03% 3.45% 3.79% 3.15%
6. Agriculture - 4.25% 9.47% 8.73%
7. Environment - - 0.98% 2.06%
TOTAL 100.00% 100.00% 100.00% 100.00%
2003 were not included in the dataset. The dataset also excluding regions with some underlying conditionality (i.e.: regions of DKI Jakarta) either for the outlaying data among other region or for the underlying adminis-tration status of the region itself. For the robust data set, we used 434 sub provincial data over 2004-2006 periods.
The dataset used in this study came from multiple sources. Government financial indi-cators calculated from national and sub provincial budget realization from the ministry of Finance. Additionally, the primary edu-cation outcomes and other eduedu-cation services indicators are calculated from dataset of Ministry of National Education. Other varia-bles such as the sub provincial characteristics calculated based on National Development Planning Agency (Bappenas) and BPS- Statistics Indonesia data sources.
Estimated Generalized Least Squares (EGLS) was used to estimate the Panel Data set to analyze the impact of decentralization on primary education outcomes. The reason for using the following methods is that our panel data set has the possibility being Heteroskedastic, not only since it contains large observations but also since the dataset represent numbers of sub provincial regions with the possibility of being in similar conditions. Heteroskedastic models are usually fitted with estimated or feasible generalized least squares (EGLS or FGLS). Heteros-kedasticity can be assessed with a White or a Breusch-Pagan test. For the most part, fixed effects models with groupwise Heteroskedas-ticity cannot be efficiently estimated with OLS. Generally, data panel analysis was used for analysis since the methods have several underlying advantages for analysis, i.e.:
1. Produce more informative data set, more variation, improve degree of freedom, more efficient and reduce colinearity among variables (Baltagi, 2001:6).
2. Possible to analyze several important issues of economy that can not be explain
by using time series or cross section analysis only (Hsiao, 1989: 2).
3. Accounting higher degree of heterogeneity for the individual bank characteristic compare to time series analysis (Baltagi, 2001:6).
4. Higher flexibility on modeling difference behavior compare to cross section analysis (Greene, 1997:615).
5. Better explanation on dynamic adjustment ((Baltagi, 2001:6).
The model for estimating decentralization and others factors impact on primary edu-cation outcomes were developed under some general principles. School treated analytically as production units on the supply side. Unlike economics-type of production units, schools are not profit-maximizing firms, most of them being public or private non-profit (Boissiere, 2004). Assume the Cobb Douglass production function as:
β α
K AL
Y = (1)
In linear term can be written as:
) ln( ) ln( ) ln( )
ln(Y = A +α L +β L (2)
Y is the quantity production, L labor input, K capital input and A represent the total factor productivity. α and β are the output elasticity of labor and capital, respectively. These values are constants return to scale determined by available technology (α+β=1). Most economic studies of school effectiveness follow the EPF approach, asking the question of what manipu-lative inputs can increase outputs. Murillo (2001) described the factors that influence student’s performance in EPF approach, i.e.:
1. Personal factors such as sex, race etc.
2. Family factors such as socioeconomic level, family size and parents education
3. Factors relating to the place of residence.
From the basic production function, Glewwe (2002) formulated an inclusive education production function (EPF) as:
+
H is human capital using a measure of knowledge, such as achievement test scores and S is school (usually years of school). A represent a series of individual student ability and learning capacities such as IQ and Qi
represent school quality factors, such as class size, teacher qualifications, etc. As aspects of development become more wide-ranging, many factors have to be considered. Faguet (2007) used similar model to the EPF approach to investigate the decentralization’s effects on real policy outputs in education grouped in multiple vectors as:
mt
Where ΔS is the year-on-year increase in student enrollment in state schools, D is a vector of measures of where municipalities lie on the decentralization-centralization conti-nuum, R is a vector of measures of resource availability (i.e. supply factors) that might independently increase student enrollment, P is a vector of variables measuring political participation and engagement, and C is a vector of socioeconomic and geographic controls, all indexed by municipality m and year t. The measures of decentralization, D, are based on municipal expenditures in education broken down by source of revenue.
Based on EPF and decentralization effect models above, we develop a similar model as:
t
ER is the Enrollment Rate and since the study mean to analyze primary education
outcomes that consist 2 level of school in Indonesian education system, net enrollment rate was used for the primary school outcomes and gross enrollment rate for secondary school outcomes. There 2 outcomes variables also consistent with government instrument and target. FD is the fiscal decentralization vector and since Indonesian-type of fiscal decen-tralization could be obviously seen in revenue side of regional government budget, we use all revenue items in government budget related to fiscal decentralization as the fiscal decentra-lization instrument2. The basic argument is that by the implementation of decentralization, the public service delivery should be improved including the primary education service.
Additionally, IF is a vector of inputs and we used ratio-type input indicators (i.e.: student teacher ratio and student per school) to have robust explanation later in the input side. For this type of factors, there would be a positive impact for the primary education outcomes for student per school ratio and negative for student per teacher ratio. S is socioeconomic factors and in this model we used per capita GRDP and Literacy rate to represent the family factors. This to family variables also expected to have positive and significant relation to primary education outcomes. Lastly, the D is the regional characteristics vector. We use four types of characteristics especially the one related to decentralization issues. We use four dummies variable to differentiate Java-non Java regions, remote-non remote regions, districts - cities, and newly autonomous regions (DOB)-Non DOB.
RESULT AND DISCUSSION
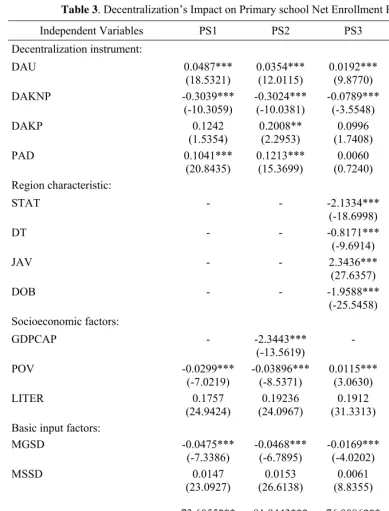
Generally the result varied by different level of education service, the primary school and secondary school. For the decentralization instruments, the General Allocation Fund (DAU) show different result for different level
2 See Mello (2000) for discussion on fiscal
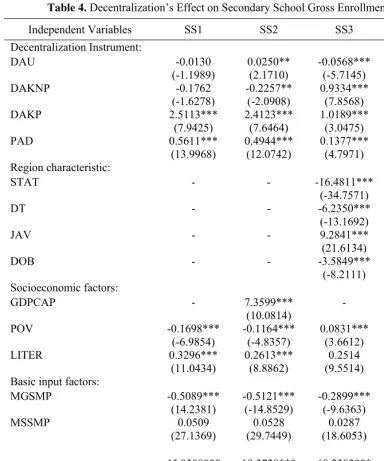
of education. DAU show positive and significant impact to primary school net enrollment rate. This result emphasis that as an instrument that allocated based on sub provincial government fiscal capacity gap, it also matches the inequality of primary school service distribution3. However, for secondary school gross enrollment rate, the DAU seem to have less significant and negative impact in some models. It is imply more complex problem to connect DAU to the secondary school enrollment rather than to say that they share a negative relation. More than 50% of DAU is the government apparatus (PNS) salary that not distributed among sub provincial regions by certain condition in primary education. On the other hand the secondary schools are less distributed than primary schools spatially. It is a common finding that a student just goes near the city for primary school but have to go to central of the sub provincial for secondary school. Although there was an increase of secondary school numbers in the past few years, but it seem not solve the unequal distribution problem yet what so ever. So the pattern fiscal inequality that used as a based on DAU allocation is unlikely less related to the secondary school education distribution spatially.
In other hand the Special Allocation Fund for Education (DAK-Pendidikan) in all models is all positive and significant at the 1% level. This fully conditional transfer from central government has the strongest impact – among other fiscal decentralization instruments- on education enrollment either in primary school or secondary school. This fund is allocated specially for building and rehabilitating school and class room and also providing other school infrastructure such as library and furniture. As one would expect, this type of fund should have positive and strong impact to
3
Fiscal capacity is calculated based on some local government characteristics, i.e.: population, land size, construction price index, GRDP per capita and others.
enrollment rate since- except the fact that fund directly allocated to the school- the fund improved the school capacity to absorb more students generally.
The DAK not only allocated for education sector development, but also other essential sector i.e.: health, infrastructure, agriculture, housing, government infrastructure and environment. They are representing by the Special Allocation Fund for non Education (DAK Non pendidikan). They allocated based on different type of conditionality but mainly allocated for physical infrastructures. DAK for infrastructure for example-the biggest share to total DAK- should been allocated to build and improve roads or bridges, and therefore improve the accessibility to the public services including school. The negative and significant impacts of this instrument should not simply interpret that non education DAK allocation causing lower school enrollment but instead the result represent the weakness of coordination among types of DAK allocation either in planning or in implementation. The road that built or revitalized by DAK for infrastructure might not in the same space as needed in primary education services to improve citizen access to schools.
government – especially the one with excessive own revenue- how to manage their revenue effectively for education service delivery and local development in more long term achievement.
The second factor is characteristic of the sub national region. SAT represent the status of sub national level for being a district or city. The result shows that the enrollment rate either for primary school or secondary school significantly differed for a region being a city or district. This is support the facts that city as the center of development of the provincial region (or even wider) also being the center of public services including education services. Additionally the coefficient of sub provincial status in secondary school is bigger than the one in primary school. This result corresponds to higher distributional inequality of secondary school outcome than primary school outcome. The result is similar to positive and significant result of the Java-non Java region over the enrollment rate either in primary school or secondary school.
The inputs factors of primary education all show significant impact on enrollment rate either in primary school or secondary school. The student teacher ratio show negative and significant at the 1% level for all level of school. As expected, the result confirmed that smaller student teacher ratio will increase the education outcomes. However, the issues on sufficient number of teacher regarding certain number of students has shift to the distribution of teachers spatially. Some sub national province has 5 student for each teacher, and some even have 88 student for each teacher. In other word, some sub provincial region is under-supply but others over-supply. Student per school ratio in other hand show positive and significant result at 1% level. This result confirmed that more school the better the education outcomes. However, in distri-butional point of view, the school availability issues seem less problematic than teachers.
Additional schools are still highly required especially for secondary school.
Two other characteristics that related to decentralization are DT and DOB. DT repre-sent whether a region being in remote area or not and DOB represent whether a region is a newly autonomous region or not. This two variables show negative and significant result over school enrollment rate. The result bear out that there is still a significant gap between sub provincial regions even after more that 9 years of decentralization era. Government has prioritized development in remote area. In the other hand the regional proliferation -as the mean of forming a newly autonomous region- aimed to improve and equalize public service delivery including education. The result indicate that government should pay more attention on remote area development also the “rule of game” and implementation of regional proliferation.
CONCLUSION
As one of the fiscal decentralization instrument, DAU allocation has been ascertained to have significant impact on school enrollment particularly for primary school but less for the secondary school. As a less conditioned-type transfer, DAU utilization is principally depends on regional government (sub provincial governments in this case) preferences or should be said priorities. How-ever, Education is one of national develop-ment priority and providing basic education for all citizens is government responsibilities unquestionably. It also important to be concerned that DAU allocation was aim to support the decentralization of many govern-ment authorities and responsibilities; including primary education services. Sub provincial government should optimally utilize the DAU fund not only for economic development but also human development.
aspects need to be more considered. Certainly, monitoring and evaluation process has to be strengthened in order to improve effectiveness and efficiency of the DAK. Government also might need to consider allocating more portions on secondary school service. Additionally, although DAK was allocated by different type of sectors but generally they all have to be allocated consistently one to another by sectoral spatial measures. Regional government should also optimalize the use of other type of revenue such as own revenue (PAD). The flexibility of managing the fund allocation should be an advantage to use the fund optimally especially to improve public services, including primary education.
In the input factors of primary education, additional teachers might still be needed, but redistribution absolutely required. Many sub national governments which have profound concern over the education services – and relatively have better fiscal capacity- intro-duced many kind of incentive program to equalize the teacher availability between less and more development area. Secondly, additional school absolutely still be needed for two reason, to provide and improve education service in less develop area and to improve the secondary school availability in all regions.
In general, fiscal decentralization in one hand and government authorities and responsibilities decentralization in other hand should be converge to one point, effectiveness and efficiency of public services. At sometime and some case both fiscal and responsibilities decentralization not always aligned in one direction, any rearrangement and enhancement have to be made to improve the achievement of development. Government has regulated the division of responsibilities on primary edu-cation services in the eduedu-cation decentrali-zation framework. Few parts need to be reevaluated, i.e.: provincial government role on resources distribution issues, alignment fiscal and responsibilities division inter and between regional governments. Shifting focus
from basic education to secondary school or even some to 12 years compulsory educations should simultaneously implemented. Only by then the primary education service outcomes can be optimally achieved.
REFERENCES
BPS. 2000. ”Statistic of Regional Government”, Badan Pusat Statistik.
BPS. 2000. “Statistic of Kabupaten/Kota”, Badan Pusat Statistik.
Baltagi, Badi H. 2001.Econometric Analysis of Panel Data, John Wiley & Sons Ltd, England.
Boissiere, M. 2004. “Determinants of Primary Education Outcomes in Developing Countries”, the World Bank.
Boissiere, Maurice. 2004. Determinants of Primary Education Outcomes in Deve-loping Countries, OED Working Papers, World Bank.
Brodjonegoro, Bambang. 2003. Three Years of Fiscal Decentralization in Indonesia: It’s Impact on Regional Economic Development and Fiscal Sustainability”, Department of Economics, University of Indonesia.
Ebel. R.D., Serdar Y., 2003. “On the Measu-rement and Impact of Fiscal Decentra-lization, World Bank Institute.
Faguet, J.Paul and Fabio Sanchez, 2006. “Decentralization’s Effects on Educational Outcomes in Bolivia and Colombia”, London School of Economics and Political Science.
Granado F.J.A. Del, Wolfgang F., Andrew B. R. and Elif Y. 2007, “Investing in Indonesia’s Education Allocation: Equity and Efficiency of Public Expenditures, Word Bank, PREM.
Greene, William H.1997. Econometric Ana-lysis, third edition, London, Prentice Hall. Herath Tikiri N.2008, “An Assessment of
Education in Sri Lanka”, Journal of Education Policy, KEDI.
Hsiao, Cheng, 2003. Analysis of Panel Data: Second Edition, Cambridge University Press.
Jayachandran, Usha. 2002. “Socio-Economic Determinants of School Attendance in India”, working paper no.103, Delhi School of Economics.
Mello, Luiz de. 2000. “Can Fiscal Decen-tralization Strengthen Social Capital?” IMF Working Paper no.129.
Vazquez J.M., Robert M.M., 2006. “Fiscal Decentralization, Macro Stability, and Growth”, Instituto de Estudios Fiscales, Spain.
Winkler, Donald R. 2007. “Identifying the Impact of Education Decentralization on the Quality of Education”, USAID Working Paper.
APPENDIX 1 – DATA ANALYSIS
Table 3. Decentralization’s Impact on Primary school Net Enrollment Rate
Independent Variables PS1 PS2 PS3 PS4
Decentralization instrument:
DAU 0.0487*** DAKNP -0.3039***
(-10.3059) DAKP 0.1242
(1.5354) Region characteristic:
STAT - - -2.1334*** Socioeconomic factors:
GDPCAP - -2.3443*** LITER 0.1757
(24.9424) Basic input factors:
MGSD -0.0475*** (-7.3386) MSSD 0.0147
(23.0927)
R-squared 0.8347 0.7552 0.9113 0.8923
Prob(F-statistic) 0.0000 0.0000 0.0000 0.0000
N 1302 1302 1302 1302
Cross-sections included: 434 434 434 434
Table 4. Decentralization’s Effect on Secondary School Gross Enrollment Rate
Independent Variables SS1 SS2 SS3 SS4
Decentralization Instrument:
DAU -0.0130 DAKNP -0.1762
(-1.6278) DAKP 2.5113***
(7.9425) Region characteristic:
STAT - - -16.4811*** Socioeconomic factors:
GDPCAP - 7.3599*** LITER 0.3296***
(11.0434) Basic input factors:
MGSMP -0.5089*** (14.2381) MSSMP 0.0509
(27.1369)
R-squared 0.6022 0.6497 0.8447 0.8864
Prob(F-statistic) 0.000 0.000 0.000 0.000
N 1302 1302 1302 1302
Cross-sections included: 434 434 434 434
Table 5. Descriptive Statistics of Fiscal Decentralization Variables
STATISTICS DAKNP DAKP DAU PAD
Mean 3.707416 1.268829 67.4105 6.046928
Median 3.244 1.258 71.9455 4.6725
Maximum 30.767 8.104 203.81 72.646
Minimum 0 0 0 0
Std. Dev. 2.920819 0.984434 21.73171 5.977479
Skewness 1.856223 1.236618 -0.212036 3.587255
Kurtosis 11.64069 7.930746 8.046933 27.10057
Jarque-Bera 4798.072 1650.781 1391.587 34302.87
Probability 0 0 0 0
Sum 4827.056 1652.015 87768.47 7873.1
Sum Sq. Dev. 11099.07 1260.811 614419.5 46485.06
Observations 1302 1302 1302 1302
Source: Processed Data
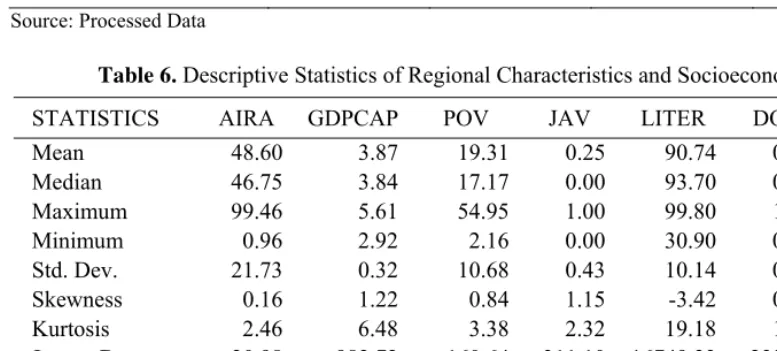
Table 6. Descriptive Statistics of Regional Characteristics and Socioeconomics
STATISTICS AIRA GDPCAP POV JAV LITER DOB DT
Mean 48.60 3.87 19.31 0.25 90.74 0.32 0.46
Median 46.75 3.84 17.17 0.00 93.70 0.00 0.00
Maximum 99.46 5.61 54.95 1.00 99.80 1.00 1.00
Minimum 0.96 2.92 2.16 0.00 30.90 0.00 0.00
Std. Dev. 21.73 0.32 10.68 0.43 10.14 0.47 0.50
Skewness 0.16 1.22 0.84 1.15 -3.42 0.75 0.17
Kurtosis 2.46 6.48 3.38 2.32 19.18 1.56 1.03
Jarque-Bera 20.98 982.72 160.64 311.10 16749.33 233.97 217.04
Probability 0.00 0.00 0.00 0.00 0.00 0.00 0.00
Sum 3,229 5,044 25,144 327 118,149 423 597
Sum Sq. Dev. 613699 133.442 148385.6 244.9 133877.7 285.6 323.3
Observations 1302 1302 1302 1302 1302 1302 1302
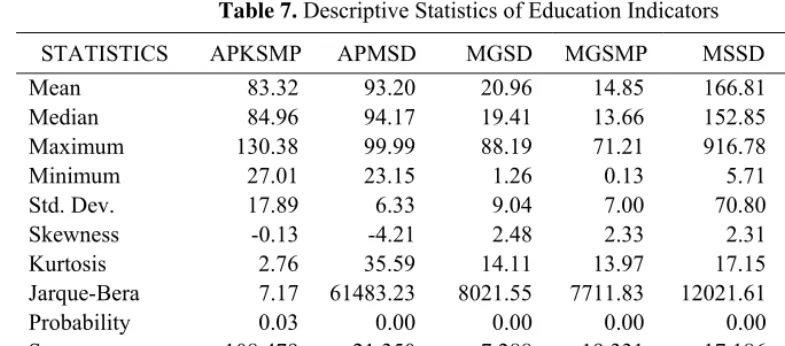
Table 7. Descriptive Statistics of Education Indicators
STATISTICS APKSMP APMSD MGSD MGSMP MSSD MSSMP
Mean 83.32 93.20 20.96 14.85 166.81 280.14
Median 84.96 94.17 19.41 13.66 152.85 263.96
Maximum 130.38 99.99 88.19 71.21 916.78 998.97
Minimum 27.01 23.15 1.26 0.13 5.71 10.25
Std. Dev. 17.89 6.33 9.04 7.00 70.80 128.36
Skewness -0.13 -4.21 2.48 2.33 2.31 1.20
Kurtosis 2.76 35.59 14.11 13.97 17.15 6.29
Jarque-Bera 7.17 61483.23 8021.55 7711.83 12021.61 901.82
Probability 0.03 0.00 0.00 0.00 0.00 0.00
Sum 108,479 21,350 7,288 19,331 17,186 64,744
Sum Sq. Dev. 416,569 52,102 106,340 63,693 6,521,177 21,434,771
Observations 1302 1302 1302 1302 1302 1302