Volume 26, Number 1, 2011, 90 – 102
LOCAL OWN REVENUE MOBILIZATION IN INDONESIA
B. Raksaka Mahi
University of Indonesia (mahi@indo.net.id)
ABSTRACT
Decentralization policy in Indonesia has given an increase of authority to local government in managing their own local finance. One of the characteristics of the decentralization policy is to increase local taxing power, with the objective to optimize local own revenue in supporting local spending. Given the current data observation, it is obvious that many local governments do not have significant local own revenue to support their local spending. This paper-adopting tax elasticity method-attempts to evaluate the present local own revenue optimization. Furthermore, by adopting a decomposition of tax elasticity, this paper also attempts to elaborate factors affecting local own revenue collection.
The estimated local own revenue elasticity show that most taxes and user charges, which are the main sources of local own revenue, are considered not a buoyant tax. More analysis using a decomposition of tax elasticity shows that tax to base elasticity is weak, suggesting that local governments need to improve discreationary tax changes at local level, such as local base changes, collection changes, and enforcement changes. The analysis also shows that some local tax bases are not responsive to the economic growth, which leads to the recommendation to improve local business environment, such as streamlining local regulations and reducing harmfull local taxes and user charges.
Keywords:local finance, local government owned revenue, fiscal decentralization, local tax elasticity, local tax base, nuisance local taxes, local economic growth
INTRODUCTION
The implementation of the regional autonomy policy has created a larger freedom for local governments to implement various public policies in their own region. In order to finance their public expenditure, local governments have received fiscal transfer (known as balancing fund) from the central government. The local governments are also allowed to collect their own local taxes and user charges. The Law of Local Tax and User Charges gives a guidance to the local govern-ment in collecting tax and user charge at the region. In the early stage of decentralization, the collection of local tax and user charge was
regulated by the Law No.34/2000. Under this law, the local governments not only could collect local taxes and user charges listed by the law, but they were also permitted to issue new local taxes and user charges based on criteria as stipulated in the law. At present, the collection of local taxes and user charges are managed using the new law No.28/2009.
govern-ments did not take consideration on the criteria of issuing new local tax or user charge as stipulated in the Law No.34/2000. As a result, as many as 3,091 nuisance local taxes and user charges had been produced within the period of 2001-2009 (Bappenas Report, July 2009). Those makes a high cost economy at local level and deteriorate local and national competitiveness. Only few local governments realize that harmfull local taxes and user charges could restrain their local economic growth and reduce their local tax bases, which at the end those could have a negative impact on their local tax collection.
Responding to this problem, the new Law on local tax and user charge, known as the Law No.28/2009, was introduced to revise the Law No.34/2000. There are major improve-ments stipulated in the Law No.28/2009, among others, the new law prohibits local governments to collect taxes and charges other than those already listed in the law. This means that the ability of the local governments to create a new type of local taxes and local user charges has been reduced. This is a positive list approach, which means that local governments are only allowed to collect taxes and user charges if those are already available on the list as stated by the law.
Although the new law gives some limitations to the local government in creating and issuing a new type of local tax or user charge, but the new law still gives an opportunity for local government to propose a new local tax or user charge. This could be done as long as the proposed new tax or user charge complies with good tax criteria, and the new local tax or user charge should be added first to the list of local taxes and user charges by using central government regulation, before those could be collected by local government.
The new law attempts to change the perspective of local governments tax policy, from a tax extensification policy to tax intensification policy. This means that the local government is encouraged to manage and
to optimize their current local tax bases, and also to reduce the production of nuisance local taxes and user charges.
The new law addresses the importance of local governments to understand better about their current local taxes and user charges. Studying the behaviour of local tax bases, such as understanding the determinants of local taxes and user charges could help local government to find the optimal tax collection for their region.
This paper attempts to identify factors affecting the behaviour of local taxes and user charges at the districts/municipalities level, and addresses what policies could be adopted by local governments to achieve their optimal tax revenues. The significance role of the local own revenue in supporting local budget and local public expenditure is also analyzed. The study utilizes the empirical analysis using the local financial and local economies data for the year of 2001, 2005 and 2008.
THE ROLE OF LOCAL OWN REVENUE IN SUPPORTING THE LOCAL BUDGET
The Indonesian decentralization policy is taken place mainly at the districts/municipali-ties level rather than at the provincial level. The decentralization of public services to the district/municipal government could help tailoring the output of the local government programs to the local tastes and preferences. In addition to that, the increased authority to districts and municipalities could encourage local innovation and local best practice to be adopted at national level.
con-clude that Indonesia relies mostly on the expenditure decentralization policy. This conclusion is based on the observation that local governments are now granted larger authority to plan and to spend the money based on their own needs, but they have a limited discretionary to create new local taxes and user charges.
However, the new law 28/2009 has increased local taxing power, by mandating the collection of some taxes, which are initially central government taxes, to be collected by local government, such as property tax. The new policy could change the framework of fiscal decentralization in Indonesia in the future, as the local own revenue may increase significantly if the local government could optimize the collection of property tax in the future.
The existence of the Law on local tax and user charge from the beginning is expected to encourage local governments to increase the role of local own revenues as a source of financing local expenditure. The analysis using the data of 2001, 2005 and 2008, however, gives an indication local own revenue has not contributed a significant role to support the local expenditures.
The analysis of local public finance data
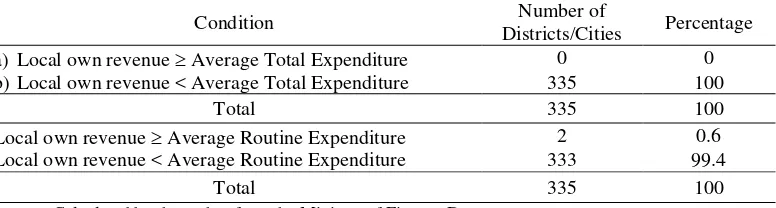
of 2001, by excluding the data of local governments in the province of Jakarta, shows that from 335 local governments in Indonesia, only two local governments have a local own revenue significantly larger than the average routine expenditure; those are the City of Surabaya and the District of Badung (Table 1). In 2001, the nominal values of local own revenue in Surabaya and Bandung were Rp 208.2 billion and Rp 355.3 billion respec-tively, while the average routine expenditure and the average total expenditure of all local governments in Indonesia were Rp 140,5 billion and Rp 205 billion consecutively.
The analysis of 2005 data, as depicted in Table 2, shows that among 353 local governments, there are only three local governments, or approximately only 0.85% of total local governments which have local own revenue larger than or at least the same as the average total expenditure of all local governments. Those are the city of Surabaya, the district of Badung, and also the city of Bandung. The average total expenditure of all local governments in 2005 is Rp 308.75 billion, while the nominal value of local own revenue of Bandung, Surabaya and Badung were Rp 386.27 billion, Rp 496.19 billion and Rp 319.38 billion consecutively.
Table 1. Local Own Revenue, Average Total Expenditure and Average Routine Expenditure of Districts/Cities, 2001
Condition Number of
Districts/Cities Percentage a) Local own revenue Average Total Expenditure 0 0 b) Local own revenue < Average Total Expenditure 335 100
Total 335 100
Local own revenue Average Routine Expenditure 2 0.6 Local own revenue < Average Routine Expenditure 333 99.4
Total 335 100
Source: Calculated by the author from the Ministry of Finance Data.
When we observe the local own revenue capability in meeting routine expenditure, there are four regions which have local own revenue larger than the average routine spending. Those are the city of Medan, the city of Bandung, the city of Surabaya and the district of Badung.
In 2008, the district of Siak and Badung, and also the city of Surabaya have local own
revenues larger than the average total expenditures. The data as presented in Table 3 shows that those local governments have local own revenues larger than the average routine expenditure. The average routine expenditures from 431 districts and cities analyzed were Rp581.21 billion, while the nominal values of local own revenue of Siak, Surabaya and Badung were Rp674.95 billion, Rp728.39
Table 2. Local Own Revenue, Average Total Expenditure and Average Routine Expenditure of Districts/Cities, 2005
Number of
Districts/Cities Percentage Local Own Revenue Average Total Expenditure 3 0,85 Local Own Revenue < Average Total Expenditure 350 99,15
Total 353
Local Own Revenue Average Routine Expenditure 4 1.13% Local own Revenue < Average Routine Expenditure 349 98.87%
Total 353
Source: Calculated by the author from the Ministry of Finance Data.
Table 3. Local Own Revenue, Average Total Expenditure and Average Routine Expenditure of Districts/Cities, 2008
Number of
Districts/Cities Percentage Local Own Revenue Average Total Expenditure 3 0,70 Local Own Revenue < Average Total Expenditure 428 99,30
Total 431 100
Local Own Revenue Average Routine Expenditure 3 0,70% Local own Revenue < Average Routine Expenditure 428 99,30%
Total 431 100%
Source: Calculated by the author from the Ministry of Finance Data.
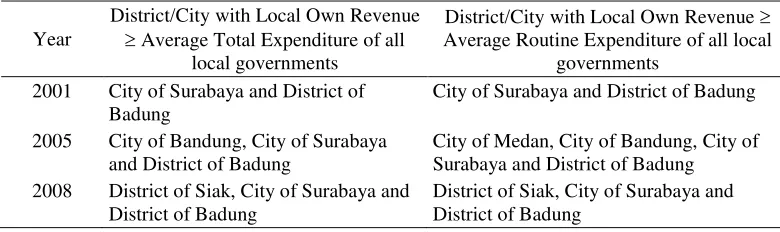
Table 4. Local Own Revenue of Districts/Cities Compared to the Average Total Expenditure and the Average Routine Expenditure
Year
District/City with Local Own Revenue
Average Total Expenditure of all local governments
District/City with Local Own Revenue Average Routine Expenditure of all local
governments 2001 City of Surabaya and District of
Badung
City of Surabaya and District of Badung
2005 City of Bandung, City of Surabaya and District of Badung
City of Medan, City of Bandung, City of Surabaya and District of Badung
2008 District of Siak, City of Surabaya and District of Badung
billion and Rp759.80 billion respectively.
Table 4 summarizes the condition after the decentralization of 2001. Based on the analysis of the financial data, the number of districts and cities with local own revenue larger than the average routine expenditure and also larger than the average total expenditure has not significantly increased since 2001. Most local governments have local own revenue which are not enough to cover local expenditure.
To fill the gap between local own revenue and local expenditures, local governments mostly rely on the intergovernmental transfer. This makes the transfer from central govern-ment becomes important in affecting local budget. This condition creates vulnerability of local budget to the external shock.
Some vulnerabilities include among others, a delay on the disbursements of the transfers from central to local governments, which could affect the budget implementation. Late disbursement of the transfer makes local government unable to spend the money as planned, as a result there is a surplus which needs to be spent in the following budget year.
The results suggest that the local budget could be optimized if the local government could increase the role of local own revenue in financing their expenditures. These will create “less dependability” of local budget from the central government funding. Local govern-ments could reduce the impact of late disbursement of the transfer, or any other form of external shock which could affect their local budget.
There should be a note for local govern-ments attempting to fulfill their fiscal needs; they should avoid producing regulations that created adverse effects on the business environment of the region. If they keep doing it, there would be many complaints sounded from all corners, saying that regional auton-omy is considered unsupportive of businesses in the region.
IMPLEMENTING TAX COLLECTION CRITERIA FOR MOBILIZING LOCAL TAXES AND USER CHARGES
The fiscal decentralization policy has given an opportunity for local governments to create various new taxes as stipulated in the Law No.34/20001, as long as the new taxes fulfill the criteria. The new law no.28/2009 has limited this local authority. Under the new law, the local governments could create the new local taxes or local user charges as long as those taxes and charges fulfill the criteria of tax collection, and after those new taxes and the district/munical governments in issuing new local taxes:
1) The tax object is located in the district/ municipalities, with a low mobility. 2) The tax base and the tax object should gain
support from the public.
3) The tax object of districts should not be the same as the object of the provincial tax and also the central government tax. 4) The tax should be potential
5) The tax should not distort the economy 6) It should confirm with the aspect of equity
and the ability to pay principle.
7) The tax should support environmental sustainability
The criteria adopted by the law basically are consistent with the international practices which are derived from the following principles:
1. Adequacy and elasticity. The adequacy refers to the performance of revenue from a tax in relation with the collection cost.
1 The proposed new local tax and user charge are those
When the tax revenue is signifcantly larger common measures of such productivity are buoyancy and elasticity. Two factors can give rise to growth in tax revenues: (1) the rules or rates of tax can be changed to raise more revenue from the same base: or (2) the base on which the tax is imposed may grow. The effect of automatic growth alone, abstracting from discretionary changes, is known as the elasticity of tax. Accordingly, an elasticity coefficient of higher than 1 (one) would be preferable, as it implies that for every 1% increase in GDP, revenue from the tax could have grown by more than 1% if the rules and rates of the tax had remained unchanged. 2. Fairness. The burden of taxes should be
distributed to all people in the society according to their wealth. These involve three dimensions of distribution: (1) verti-cal distribution that results in progressive tax, (2) horizontal distribution which indicates whether some people with the same income would bear the same tax burden, (3) geographical distribution (e.g. someone should not pay additional taxes just because he lives in a certain area). 3. Administrative Capability. Local tax
administration is the key for the success of collecting local taxes. There are challenges of local tax administration, among others are the ability to estimate the possible local tax collection. Certain taxes are very difficult to estimate, while others are easily estimated. Some local taxes can be easily avoided by a tax payer, when the tax administration is weak. This could result in many tax evasion. The administrative capabilities also include the ability to update the potential tax base in the region.
4. Political acceptability. At the end, the decision to execute a certain local tax depends on the acceptability of the public, which usually reflected by the approval or disapproval from the parliament. Some important issues related to the local taxes to be discussed with the parliament include determining the approriate tax rates and also the target group of the tax.
5. Minimum Distortion to the economy; Taxes or user charges should have a minimum implication to the economy. Basically every tax could create a tax burden, which reducing the consumer’s surplus and/or the producer’s surplus. Therefore, it should be calculated that a tax or a levy should not cause overwhelm-ing extra burden which could cause a significant dead-weight loss to the public.
Those criteria could be implemented by adopting a scoring method. The candicate of a new tax or a new user charge is evaluated based on each criterion, by assigning a value of 1 (one) to 5 (five) according to the following framework:
Adequacy and elasticity: a value of 1 (one) would be given to a new tax or a new user charge which revenue is less than the collection cost. The score value of 1 (one) would also be given when the new tax or user charge is inelastic. On the contrary, the new tax which fully comply the criteria of adequacy and elasticity can be considered as to have the best perform-ance, and could be assigned a value of 5 (five) as its score. The value between 1 (one) and 5 (five) could also be assigned, indicating the performance achieved between the best and the worst.
principle. For example, when deciding on the rate of vehicle tax, the fairness principle is said to be implemented better if the tax rate for luxurious car is higher than the tax rate of ordinary car. The value between 1 (one) and 5 (five) could also be assigned, indicating the performance achieved between the best and the worst. Administrative capability: a score of 1
(one) means that it is very hard administratively for the local government to collect the taxes, whereas the score of 5 (five) means that it is obvious that the local governments adminstrative capacity could handle the collection of the taxes easily. The value between 1 (one) and 5 (five) could also be assigned, indicating the performance achieved between the best and the worst.
Political acceptability: the score of 1 (one) means that there are many political resistances faced by the local government to implement the collection of the new taxes. On the otherhand, the score of 5 (five) shows a significant political support not only from the parliament, but also from the people. The value between 1 (one) and 5 (five) could also be assigned, indicating the performance achieved between the best and the worst.
Minimum distortion to the economy: the score of 1 (one) means that the new tax would give the worst impact to the local economy when it is implemented. The opposite is happening when the score of 5 (five) is given for the criterion. The value between 1 (one) and 5 (five) could also be assigned, indicating the performance achieved between the best and the worst.
A proposed new local tax or user charge should have a significant total score before it is determined as a potential tax to be collected by the local government. The following method could be adopted to determine the
final judgment of selecting the potential tax or user charge:
If the candidate of local tax or local user charges has the value of 10 (ten) or below, it is considered as non potential, and it is recommended not to be collected by the local government.
If the total values are above 10 (ten) and up to the value of 15 (fifteen), it could be said that the proposed tax or user charge has a low potential for local own revenue. If the total values are above 15 (fifteen)
and up to the value of 20 (twenty), it could be said that the proposed tax or user charge has a good potential for local own revenue.
If the total scores are above 20 (twenty), it could be said that the proposed tax or user charge has a high potential for local own revenue.
This method can be implemented to analyze any potential new local tax or user charge or to evaluate the existing local tax or user charge which has been implemented during the decentralization era.
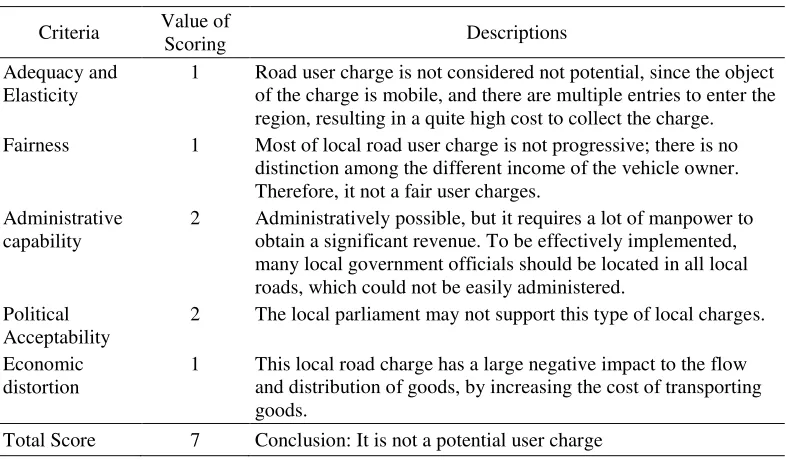
The following is an illustration how to implement the method to evaluate the existing burgeoning toll road in regions after the implementation of regional autonomy. This type of local user charge is considered harmfull for the business community. The analysis of local user charge using the scoring method confirms that such a local road user charge implemented by districts or municipali-ties is not a potential to be collected as local government as it tends to deteriorate the local economy. The summary of analysis could be found in Table 5 below.
Unfortunately, there are not many local governments implement those criteria to find the optimal local tax and user charges. As a results, there have been many complaints from the business sectors regarding the new local taxes or user charges which are considered harmfull for the business and economic activities at the local level (Patunru-Wardhani, 2008).
THE ANALYSIS OF FACTORS DETERMINING LOCAL OWN MOBILIZATION
The new Law No.28/2009 on local tax and user charge has become a new guide for local governments in mobilizing their own local own revenues. Under the new law, local governments are limited only to collect local taxes and user charges which is already stipulated in the Law. This suggests that, to increase local own revenue, local governments need to optimize their tax bases. There are many factors affecting the collection of local taxes and user charges. One could apply a decomposition of tax elasticiticy to distinguish
factors which dominating the performance of local tax collection. Basically there are two main factors could affect the performance of local tax collection; local economic growth and discretionary changes in tax rates and rules. Discretionary tax changes are those under control of the tax authorities, such as rate changes, base changes, collection changes, and enforcement changes.
According to this approach, tthe growth of tax revenue in response to the growth of GDP (Gross Domestic Product) can be broken down into two components: (i) the elasticity of the tax to the base, which measures the change of tax revenue with respect to the change in the tax base, and (ii) the elasticity of the base to income which measures the change of the tax base with respect to the change in the GDP. In symbols, these elasticities are defined in equation 1) as follows
:
T
Table 5. Evaluation of Local Road User Charge
Criteria Value of
Scoring Descriptions
Adequacy and Elasticity
1 Road user charge is not considered not potential, since the object of the charge is mobile, and there are multiple entries to enter the region, resulting in a quite high cost to collect the charge. Fairness 1 Most of local road user charge is not progressive; there is no
distinction among the different income of the vehicle owner. Therefore, it not a fair user charges.
Administrative capability
2 Administratively possible, but it requires a lot of manpower to obtain a significant revenue. To be effectively implemented, many local government officials should be located in all local roads, which could not be easily administered.
Political Acceptability
2 The local parliament may not support this type of local charges.
Economic distortion
1 This local road charge has a large negative impact to the flow and distribution of goods, by increasing the cost of transporting goods.
Where,
a) Tax to base elasticity = (T/B) × (B/T), and
b) Base to income elasticity = (B/GDP) × (GDP/B)
The base-to-income elasticity is largely out of the control of the tax authorities. Apart from redefining the base of the tax, the growth of the base is probably largely due to economic growth in general. As an illustration, if a district experiences an economic growth, the occupancy rates of hotels would also be increasing, with the size depending on the sensitivity of hotel occupacy rates to the changes of economic growth.
The tax authorities might influence the tax-to-base elasticity in a number of ways: better tax administration or making the tax more progressive. Hence, a growing tax-to-base elasticity might indicate improved tax administration or increased reliance on more progressive taxes. Back to our example, when occupancy rates increases, as a result of economic growth, the tax-to-base elasticity would indicate to what extent the local tax administration is able to capture the potential increase of tax revenue from hotel.
By adopting the decomposition of tax elasticity, we could identify what factors significantly affecting local own revenue
mobilization in Indonesia. The elasticities are taken from the estimated coefficients of the following regression equations:
ln T = α0 + αi.ln Bi (2)
ln B = β0 + βi.ln GRDP (3)
Equation 2) specifies T as local own revenue- known as “Pendapatan Asli Daerah” (PAD), and B as local tax base. This paper focusses only on main local taxes and user charges which dominate the local own revenue, such as tax on hotel and restaurant, street lighting tax, and some consumption taxes. The coefficient of αi stands for tax to base elasticities of various commodities.In this paper, major local tax bases identified are treated as explanatory variables, such as ; number of hotel, number of restaurant, food consumption, non-food consumption, electric-ity consumption and housing consumption.
Equation 3) shows that a change in GRDP (Gross Regional Domestic Product) could affect the size of local tax base.The coefficients of βi stand for the values of the base to income elasticities. We attempt to estimate the impact of GRDP on each of local tax base, to measure base to income elasticity of each tax base. Therefore, there would be some equations needed to estimate base to income elasticity of each tax base.
Table 6. Tax to Base Elasticities of Some Commodities
No Local Tax Base Tax to base elasticity t- statistic
1 Number of hotel α1 = 0,65 2.487561**
2 Number of restaurant α2= 0,60 6.158059*** 3 Consumption (food) α3= 0,91 3.053215** 4 Consumption (non-food) α4= 0,74 1.382871* 5 Electricity consumption α5= 1,29 28.542178*** 6 Housing consumption α6= 1,42 9.328904***
R-squared 0.701234
Adjusted R-squared 0.639481
F-statistic 58.237145
The estimated coefficient for equation 2) is reported in Table 6, which show estimated values of tax to base elasticities based on a panel data for the period of 2005 to 2007.
Using the same panel data as above, Table 7 reports base to income elasticity of each tax base for the period of 2005 to 2007 as follow:
By multiplying the estimated elasticities in Table 6 and 7 as suggested by equation (1), we could calculate local own revenue (PAD) to GRDP elasticities, which results are reported in Table 8 as follows:
The analysis of elasticities as reported in Table 6, Table 7 and Table 8 show some findings as follow:
1. Local own revenue in Indonesia are considered not elastic in terms of changes in the economy, as depicted in Table 8. The results suggest that local own revenue, which comprises of local taxes and user charge, are not potential to support local
government spending.
2. By performing the decomposition of tax elasticities, we could find some interesting findings as follow:
a) Table 6 shows that local administrative capability to capture any change in local tax base in general is limited. Local own revenue that comes from electricity consumption and housing consumption are relatively better col-lected compared to other revenue sources. Local tax, such as street-lighting tax -collected based on the electrical consumption- is considered to have a low-mobility, hence it is easier to be administered at the local level.
b) The estimation of base to income (GRDP) elasticities as shown in Table 7 suggests that most of local tax bases are not responsive to economic growth. Relatively small elasticities of local tax base to GRDP indicate that local
Table 7. Base to Income (GRDP) Elasticities
No Local Tax Base Base to income elasticity t- statistic 1 Number of hotel β1 = 0,85 8.372813*** 2 Number of restaurant β2 = 0,50 1.927414** 3 Consumption (food) β3 = 0,63 1.429125* 4 Consumption (non-food) β4 = 0,72 1.298186* 5 Electricity consumption β5 = 0,44 4.392874** 6 Housing consumption β6 = 0,28 3.611382**
Sources: Based on the estimated coefficients of 6 (six) regression models using the panel data (Districts/Cities) of the period 2005-2007.
Notes: *** : significant at 1%, ** : significant at 5%. * : significant at 10%.
Table 8. Local own revenue (PAD) to GRDP Elasticities
No Related Local Tax Base PAD to GRDP Elasticities 1 Number of hotel TY 1 = 0,56 2 Number of restaurant TY 2 = 0,30 3 Consumption (food) TY 3 = 0,57 4 Consumption (non-food) TY 4 = 0,54 5 Electricity consumption TY 5 = 0,57 6 Housing consumption TY 6 = 0,40
economic growth cannot be trans-formed fully into significant economic activities such consumption.There are some possible reasons causing eco-nomic rigidities at local level, among others are inefficent local regulations, lack of good transportation, a limitation of local authority to make an investment decision, and also a limitation of electrical supply at local level. These give some limitations to the local economy to respond to economic growth. It takes sometimes for local economy to gradually adjust to economic growth, and this, among others, depends on the realization of investment at the local level.
c) Table 6 indicates that the elasticity of local own revenue to electrical con-sumption is above the value of 1 (one), which means that it is highly elastic. This result confirms that collecting a tax from electrical consumption is simple and easy, as the tax liability - calculated based on a certain percentage of electrical bill - is paid monthly by the customer when paying the electrical bill. However, it does not guarantee that revenue to income elasticity of electrical consumption could also be elastic. As seen from Table 8, this tax is considered as inelastic. By evaluating base to income elasticity as provided in Table 7, we could find that the elasticity of 0.44 indicates that local own revenue based on electrical consumption is considered as not potential tax, as this has a little tax buoyancy could be measured by using the estimated of elasticities as depicted in Table 8. The results show that most taxes and user charges, which are the main sources of local own revenue, are considered not a buoyant tax. By adopting a decomposition of tax elasticity, we could identify that local taxes are not buoyant because the local tax bases, such as local consumptions (food and non-food), are not responsive to economic growth.
One advantage of an elastic tax system is that tax revenues grow proportionately faster than income, making it possible to fund growing demands for government services without politically sensitive tax increases. An elastic tax system is also a better automatic stabilizer than an inelastic one. During expansionary periods, tax revenues increase more rapidly than income, promoting a surplus in the government budget and slowing the expansion. In contractionary periods, tax revenues fall more rapidly than income, promoting a deficit in the government budget and slowing the contraction. Therefore,more elastic local taxes are needed to support optimal taxation at local level.
Recent law No.28/2009 is expected to improve the buoyancy of local taxes, the new law, among others, have granted a greater local taxing power and decentralizing taxes which are considered buoyant, such as the property tax. International experiences suggests that the property tax is considered a prospective tax for local government. The estimates of local property tax elasticity
statewide, such as found in the United States of America, has a total elasticity of 1,34 (Green and Chervin, 2006).
1. Improving the evaluation of local tax base as mentioned earlier, local govern-ments should able to estimate the right measure of their local tax bases. This could be done by regularly evaluating the potential of local tax bases. The followings could be conducted by local government to evaluate local tax base potential:
a) Updating local tax registers
b) Adjusting local tax rates in line with inflation.
2. Improving local tax administration: The backbone of collecting local taxes and user charges is the local tax administration. In order to improve the elasticity of local tax, some improvements on administrating local taxes and user charges are needed by adopting the following policies:
a) Simplifying local tax collection systems
b) Enacting enforcement measures toward local tax payers to obey paying local taxes.
c) Enforcing local business to improve their accounting and record keeping
Finally, an effort is also needed to improve local tax base to income (GRDP) elasticities, and the effort is considered to be more macroeconomic policies. As mention ealier, this type of elasticity depends on the local economic structure and also behaviour of local population toward local food and non-food consumption. Therefore, what really needed are the intiatives of local government to provide a better environment for local business and new investiment to come to the region. The business is expected to create employment and increase people with income significant to spend on food and non-food consumption.
Improving the business environment could be done, among others, by addressing the following policies:
a) providing the best service for the prospec-tive investors, such as a good information and faster investment process.
b) Streamlining local business regulations c) Providing fiscal and non-fiscal incentives
for the potential investors.
d) Reducing harmfull local taxes and user charges.
Based on this study, it is obvious that discretionary tax changes - those under control of the local tax authorities- are necessary to be conducted in order to have an optimal local taxation. Based on the authority belongs to the local government, discretionary changes mainly are policies toward local base changes, collection changes, and enforcement changes. Based on the tax to income elasticity, a policy is also needed to increase the sensitivity of tax base to local economic growth. One important policy on this matter is by improving business environment at the local level, such as streamlining local regulations and reducing harmfull local taxes and user charges. With all of these policies, it is expected that the capability of local own revenue to support local spending can be improved, and the local people could enjoy a better local public services.
REFERENCES
Boadway, Robin and Ronald L. Watts, 2004, “Fiscal Federalism in Canada, the USA and Germany”, Working Paper, IIGR. New York: Queen University.
Devas, Nick, 1988, “Local Taxation in Indonesia: Opportunities for Reform”, Bulletin of Indonesian Economic Studies, Volume 24, No.2.
Green, Harry and Stand Chervin, 2006, Local Government Property Tax Revisited, Nashville: TACIR.
Government of Indonesia, 2009. “Law No.28/2009 on Local Taxes and User Charges”.
Kelly Roy, and Nick Devas, “Regulation or Revenue? Implementing Local Govern-ment Business License Reform in Kenya”, Development Discussion Paper No.723, September 1999, Massachusetts: Harvard Institute for International Development, Harvard University.
Lewis, Blane and Suharnoko, 2008 “Local Tax Effects on the Business Climate”, Decen-tralization Support Facility Research Paper, July.