A growing Machine Learning approach to optimize use of prestack and poststack seismic data
Kamal Hami-Eddine*, Bruno de Ribet, Patrick Durand, Patxi Gascue, Paradigm
SUMMARY
Machine Learning and Neural Networks have been used in the oil and gas industry for several years. The main focus of these technologies has been to predict facies distribution from seismic data, or to cluster log data into electro-facies. Some tentative methods for expanding their applicability have been tested, but to date, these have failed to become part of the main interpretation workow stream. The question is how machine learning technology can be used to perform fault interpreta-tion, AVO analysis and geobody detection more quickly and easily. We propose a new type of machine learning approach to accelerate daily interpretation tasks.
INTRODUCTION
Machine learning algorithms are now able to perform highly complex tasks, such as on-the-y speech translation, image de-tection, and combinations of the two. The underlying strength of machine learning is its ability to deal with massive amounts of noisy data (Seltzer et al., 2013) from various sources, and learn from it to then identify, transform and deliver understand-able information to an end user. Seismic interpretation is cer-tainly one of the most suitable domains for this approach, be-cause it deals with exponential increases in data. The more data we acquire, the more we need to generate multiple at-tributes, leading to an expectation of highly accurate interpre-tations on the part of the geoscientist. However, having more data does not immediately translate to more information. Of-ten, due to a lack of time or insufficient tools, interpreters can-not exploit all the data available on their company’s hard drive. Recent evolution in machine learning have shown that it is pos-sible to consider one network architecture for different tasks, as long as enough data is available to train the machine. Our aim is to propose a fast track machine learning method which will help interpreters in several aspects of their daily work. This machine learning algorithm will be applied to probabilis-tic fault detection, AVO analysis and geobody detection.
METHODOLOGY
Subsurface conditions are not predictable. They may be de-tected through seismic interpretation, which comprises advanced deduction based on the experience and expertise of the geosci-entist, and available data, mainly seismic. It is therefore nec-essary to consider an uncertainty associated factor from the early seismic interpretation stages. One solution for quantify-ing uncertainty from seismic data is to take into account sev-eral inputs rather than a single one, to calculate probabilities during interpretation processes. However, the estimation of probabilities using a mathematical algorithm needs to be sup-ported by a technology enabling on-the-y quality control, and
interactive analysis of parametrization variations on the result of the machine learning process. In the context of unsuper-vised learning from seismic data for what can be related to anomaly or geologic feature detection (AVO, faults or geobod-ies), growing and topologically flexible networks can provide a generic learning model. This approach seems well adapted to our main three detection objectives (anomaly, structure and stratigraphy).
For such purpose, artificial neural network inspired from Grow-ing Neural Gas (GNG) (Fritzke, 1995) provides a good solu-tion for matching the data high dimensionality, when referring to data such as prestack, or for enabling the usage of several poststack seismic attributes. However, as any self-organizing network, growing networks are attracted by data density. As the objective is to overcome this issue to map anomalies, the algorithm needs to be adapted to focus as well on outliers (Hodge and Austin, 2004). To fit with this objective, the so-lution is to perform the neural network training stage based on the following steps:
1. Train the network on all points of the interval of inter-est,
2. Detect outliers from previous stage,
3. Train only on outliers,
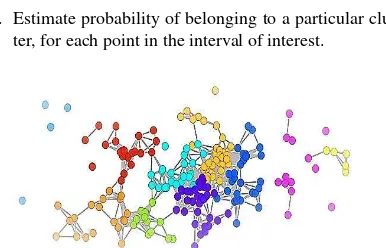
4. Cluster the neurons on a network topology approach,(Figure 1),
5. Estimate probability of belonging to a particular clus-ter, for each point in the interval of interest.
Figure 1: Projection of the 15-dimensional neural network onto 2 dimensions. For visualization purposes, each neuron is affected to a class, based on network topology.
The result of the learning process can therefore be interactively translated into classes and associated probabilities, to generate new displays and provide a better image for interpreters.
RESULTS
Since a Neural Network is well able to simultaneously interact with several attributes, this methodology provides a solution for detecting and identifying areas of interest and anomalies from seismic data. AVO analysis, structural interpretation and
© 2017 SEG
SEG International Exposition and 87th Annual Meeting
A growing Machine Learning approach
geobody detection are some interpretation processes where ap-plying this technique provides great added value.
Acceleration of fault interpretation workflow
Fault interpretation is a tedious task, and all commercial tech-nical solutions offer different methods to simplify not the in-terpretation itself, but the process. This inin-terpretation stage requires time, and uses a variety of seismic attributes which contribute to an understanding of the structural framework, fault extension and connectivity. Each seismic attribute pro-vides different information, most likely at different resolutions (semblance versus curvature). We know that each seismic at-tribute brings specic information, but we also know that the human capability to simultaneously synthetize all the seismic information in order to best interpret the structural pattern is limited. Machine learning is valuable in that it integrates the relatively high-dimensionality information in an understand-able manner, and quantifies the probability of fault presence and connectivity.
Figure 2 and figure 3 show the result of structural attribute clustering using a growing network approach. The associ-ated probabilities provide a way to quantify the fault position, considering as many attributes as needed. Semblance, Eigen-based coherence, dip, azimuth and curvatures, combined with some derivatives, are used as input data to train the neural net-work. As learning from a large pool of structural seismic at-tributes, parametrization of each attribute does not impact the result much . Default parameters can be used without having to perform specific ne-tuning for each attribute. The result is a true image of the structural framework in record time.
Figure 2: Opacity rendering on the result of neural network result clustering. Fault planes are clearly visible on the most likely class prediction volume. Probabilities will add more de-tail.
It is easy to see the improvement in identifying faults versus discontinuities related to noise.
Automated AVO analysis investigation
Neural networks are by definition data type-agnostic and there-fore can be applied to prestack data. The objective is to identify and classify the different types of AVO/AVA responses. With this method, the geoscientist, analyzing the intrinsic character-istics of a potential reservoir, receives a probabilistic estima-tion of the similarity between the AVO/AVA seismic response and the theoretical response, and eventually the identification
Figure 3: Red zones show a very high fault probability. The thickness of the fault zone provides an envelope for the fault position.
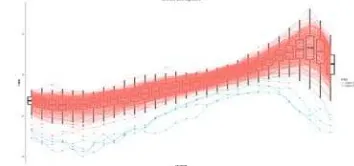
of potential anomalies related to processing. Figure 4 illus-trates an example of 2 seismic facies neuron sets showing dif-ferent AVA signatures. While seismic facies 2 may correspond to an AVA Class 1 type (Rutherford and Williams, 1989), fa-cies 9 displays a signature that could possibly be associated with the presence of multiples.
The different neuron classes obtained using this technique are compared to synthetic AVA models generated at wells. The comparison helps to identify expected anomalies versus non-expected behavior. The trained neurons are then used to es-timate probabilities that each point in the seismic will be at-tached to a specific neuron family. The probability estimation allows the creation of a most probable seismic facies volume, which is directly readable in terms of AVA effects (Figure 5 and Figure 6). This method provides additional information, empowering interpreters to assess the 3D distribution of po-tential seismic anomalies at an early stage.
Figure 4: Neuron amplitude responses with angles show that class 2 (red) and 9 (blue) have different AVA responses. Class 2 (red) exhibits an AVA Class 1-like reservoir top signature (inverse polarity). However, both classes show some ampli-tude decrease in the ultra-far angles, possibly due to frequency variations with angle.
The different neuron families obtained with this technique, can easily be compared to synthetic AVA models generated from wells. The comparison brings a way to identify expected anoma-lies, versus non expected ones (Figure 7).
Delivering a probabilistic geobody detection
One of the main contributions of this technique is associating a set of probabilities to each data point. These values character-ize the likelihood of each data point belonging to a given class.
© 2017 SEG
SEG International Exposition and 87th Annual Meeting
A growing Machine Learning approach
Figure 5: Distribution of a) near b) mid c) far d) ultra-far am-plitudes for all classes over all the neural network neurons. Distribution varies depending on class.
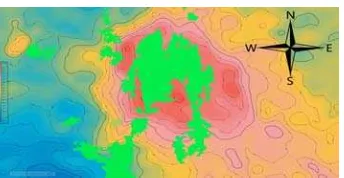
Figure 6: Green area shows where the Neural Network re-sponses are similar to an AVO class 1 response reservoir top. The anomaly is displayed on top of the time migrated struc-ture.
Obviously, if we define fewer classes, more data points will be part of the same cluster. We admit that in general, the size of each geobody is a function of the number of classes. When in-creasing the number of classes, more detail will be extracted, isolated and mapped as specific features.
From the probabilities associated with each class, we can ex-pand the workflow beyond classification and enable structural geobody creation scenarios. From an initial set of structure related seismic attributes, the application of this technique al-lows the detection of fault geobodies, by specifying a cut-off on fault class probability value (Figure 8). Reducing the num-ber of classes would potentially increase fault connectivity, while the opposite would generate more discontinuous fault bodies. Because of the 3D character of this approach, interac-tively evaluating the impact of parametrization on the result is of great added value in any seismic scale reservoir characteri-zation and modeling worflow.
CONCLUSION
O & G operators are continuously improving the geoscientists working environment (including interpretation software and access to more data). The expectation is for the geoscientist
Figure 7: AVA neurons projected in principal component space show a very good cluster separation. The clustering enables us to isolate anomalies.
Figure 8: Result of probabilistic fault body detection, based on a Neural Network.
to provide pertinent and accurate interpretations of prospects and reservoirs. If we only consider traditional interpretation workows based on legacy techniques, then extracting consis-tent, quantified and precise information from available data will remain a challenge. The new generation of machine learn-ing techniques brlearn-ings new insight into G& G data analysis. Fit-to-purpose use of these techniques will facilitate interpretation in any type of geological setting. In the case of structural in-terpretation, we observe that the growing network approach accelerates the 3D consistent interpretation of faults, while adding information about probability, to be used for modeling structural framework uncertainty. For AVO/AVA analysis, we propose its application to perform AVO related anomaly detec-tion, with the objective of mapping potential hydrocarbons.
ACKNOWLEDGEMENT
We would like to thank Paradigm for authorizing us to publish this abstract. Data courtesy of Ministry of Economic Develop-ment Unpublished Petroleum Report, New-Zealand.
© 2017 SEG
SEG International Exposition and 87th Annual Meeting
EDITED REFERENCES
Note: This reference list is a copyedited version of the reference list submitted by the author. Reference lists for the 2017 SEG Technical Program Expanded Abstracts have been copyedited so that references provided with the online metadata for each paper will achieve a high degree of linking to cited sources that appear on the Web.
REFERENCES
Fritzke, B., 1995, A growing neural gas network learns topologies: NIPS'94 Proceedings of the 7th
International Conference on Neural Information Processing Systems, MIT Press625–632.
Hodge, V., and J. Austin, 2004, A survey of outlier detection methodologies: Artificial Intelligence
Review,
22
, 85–126,
http://doi.org/10.1023/B:AIRE.0000045502.10941.a9
.
Rutherford, S. R., and R. H. Williams, 1989, Amplitude versus-offset variations in gas sands: Geophysics,
54
, 680–688,
http://doi.org/10.1190/1.1442696
.
Seltzer, M. L., D. Yu, and Y. Wang, 2013, An investigation of deep neural networks for noise robust
speech recognition: 2013 IEEE International Conference on Acoustics, Speech and Signal
Processing (ICASSP), IEEE, 7398–7402,
http://doi.org/10.1109/ICASSP.2013.6639100
.
© 2017 SEG
SEG International Exposition and 87th Annual Meeting