DOI 10.1007/s11104-007-9255-z
O R I G I N A L P A P E R
E
V
ects of forest management intensity on carbon
and nitrogen content in di
V
erent soil size fractions
of a North Florida Spodosol
D. V. Sarkhot · N. B. Comerford · E. J. Jokela · J. B. Reeves III
Received: 19 December 2006 / Accepted: 21 March 2007 / Published online: 5 May 2007
Springer Science+Business Media B.V. 2007
Abstract Pine plantations of the southeastern USA
are regional carbon (C) sinks. In spite of large increases in woody biomass due to advanced growing systems, studies have shown little or even negative eVects on the C content of the extremely sandy soils of this region. Hence, it is important to understand the mechanisms that determine the impact of intensive forest manage-ment on soil organic carbon (SOC) sequestration. This study was conducted to examine the C proWle in a 4-year-old loblolly pine (Pinus taeda L.) plantation managed under two levels of management intensity (chemical understory control and fertilizer inputs). Soil organic C and nitrogen (N) pools were evaluated using two size fractionation methods, dry and wet sieving (2000–250m, 250–150m, 150–53m and <53 m).
Dry sieving was preferred over wet sieving for soil size
fractionation, as it preserved more structure and water-soluble SOC components such as esters and amides and did not aVect the N distribution. DiVuse ReXectance Infrared Fourier Transform Spectroscopy (DRIFTS) spectra were used to examine the chemical composition of the size fractions, which showed the presence of recently added organic matter in the largest sand frac-tion, as well as more decomposed organic matter in the <53m fraction. Intensive forest management reduced
SOC in all three 2000–53m fractions, most likely due
to reduced root input of understory plants that were con-trolled using herbicides. The 2000–250m fractions
contained nearly half of the total SOC and showed a 23% decrease in C content due to the intensive manage-ment regime. Results from this study indicated the sig-niWcance and responsiveness of sand size SOC fractions in Florida Spodosols. Results also showed that reduc-tions in SOC due to intensive management occurred after four years and highlighted the need to understand the long-term impacts and the mechanisms responsible.
Keywords Carbon sequestration · DRIFTS ·
Fertilization and chemical weed control · Intensive silviculture loblolly pine · Pinus taeda · Size fractionation
Introduction
The soil C density of Spodosols in Florida (20 kg m–2; Stone et al. 1993) is higher than the majority of the
Responsible Editor: Barbara Wick D. V. Sarkhot · N. B. Comerford Department of Soil and Water Science, University of Florida, PO Box 110290, Gainesville, FL 32611-0290, USA E. J. Jokela (&)
School of Forest Resources and Conservation, University of Florida, PO Box 110410, Gainesville, FL 32611-0410, USA
e-mail: [email protected] J. B. Reeves III
Environmental Management and Byproducts Utilization Laboratory, ARS, USDA, Bldg 306, Rm. 101,
life zones (Post et al. 1982), yet little research has been conducted to better understand the C proWle of these soils. Many Florida Spodosols support southern pine plantations that have the potential for signiWcant aboveground C storage (Richter et al. 1995; Adegbidi et al. 2002). During the last few decades, intensive forest management has resulted in an unprecedented increase in litterfall and yield of woody biomass in southern pine plantations (Dalla-Tea and Jokela 1991; Albaugh et al. 1998; Will et al. 2002; Jokela et al. 2004; Martin and Jokela 2004; Samuelson et al. 2004), suggesting the potential to further increase aboveground C storage. Yet, the very sandy nature of these soils suggests that SOC storage should be lim-ited. Fertilization and chemical control of understory competitors are common silvicultural practices used in the southeastern US that increase yields and shorten the rotation length. Chemical understory com-petition control has been shown to reduce total SOC (Echeverria et al. 2004; Shan et al. 2001) and the min-eralization of C and N in both whole soil and soil den-sity fractions (Echeverria et al. 2004; Polglase et al. 1992a, b). Fertilization has been reported to increase mineralization rates, especially for P (Grierson et al. 1998, 1999; Polglase et al. 1992a, b). Yet, previous studies have shown no signiWcant eVect of fertiliza-tion on total SOC (Harding and Jokela 1994; Shan et al. 2001), probably because the increased organic matter inputs associated with large growth responses compensated for the losses associated with increased mineralization rates and the poor ability of the soils to protect SOC from decomposition.
Physical fractionation of soil into size and density fractions has been an eVective technique for studying the forms and cycling of SOC (Christensen 1992; Ell-ert and Gregorich 1995). Organic C changes in the sand size fractions have been identiWed as useful early indicators of management-related C changes. For example, Angers and Mehuys (1990) reported that two years of barley (Hordeum vulgare L.) and alfalfa (Medicago sativa L.) cultivation compared to a bare soil increased sand fraction C (24–60%), N (36–45%) and carbohydrates (46–83%). Likewise, SOC in the >150m fraction was depleted under continuous
maize cultivation, yet recovered rapidly when the land was returned to pasture (Romkens et al. 1999). In the extremely sandy Spodosols of the southeastern US, which often contain <5% silt+clay, the sand frac-tion C is likely to approximate total C since the clay
fraction of these soils contains mainly quartz and kaolinite (Harris and Carlisle 1987), with very low C sorption capacity. It follows that further fractionation of the sand size C may be a sensitive method for detecting the short-term management related changes in the soil C pools. Fractionation of SOC into mean-ingful pools also helps elucidate the processes under-lying any possible changes. For example, identifying the pools responsible for diVerent functions such as short-term nutrient turnover (e.g., sand size fraction) and long-term C storage (e.g. Wne silt fraction; Liu et al. 2003) may help in the development of more accurate C dynamics models.
Wet sieving is the standard technique for soil size fractionation (Yoder 1936; Marx et al. 2005). Even though it disrupts macroaggregates (Angers and Giroux 1996), wet sieving is necessary when working with high clay soils to break the strong aggregates that are >2 mm in diameter. In contrast, the sandy nature of many Coastal Plain soils hinders the forma-tion of large stable macroaggregates. Under these conditions, dry sieving may oVer a viable alternative to the more time consuming wet sieving method.
Fourier transform infrared spectroscopy (FTIR) has also been used successfully to detect the changes in chemical composition of soil organic matter due to management and land use changes. For example, Shi et al. (2006) reported that turf grass management increased the activity of soil enzymes like N-acetyl-beta-glucosaminidase, cellulase, chitinase, and phenol oxidase in as few as 5 years as shown by the FTIR spectra. Soloman et al. (2005) reported that in Ethio-pia natural forests had higher polysaccharides content and lower aromatic compounds content than tea (Camellia sinensis O. Kuntz), Cupressus plantations, and cultivated Welds.
in the various size fractions. We expected to Wnd more C and N in the sand fractions and we expected to see diVerences in chemical Wngerprints of OM between size fractions as shown by the FTIR spectra. These expectations were based on observations docu-mented above, which indicate that changes in sand sized OM are early indicators of management eVects. The third objective was, through the use of data gen-erated by the Wrst two objectives, to provide an evalu-ation of the suitability of these methods for determining the short-term impacts of two contrasting forest management regimes. In comparison to low input regimes, intensive management, especially with sustained understory competition control would be expected to reduce SOC content due to the reduction in root C inputs. We anticipated that there would be enhanced N incorporation into all size fractions because of the fertilizer N inputs.
Materials and methods
Experimental site
A loblolly pine (P. taeda L.) plantation in north Flor-ida (30°24⬘N lat; 82°33⬘W long) was the study site. This study was installed on a recently harvested southern pine plantation site. It is managed by the Forest Biology Research Cooperative at the Univer-sity of Florida as part of the Pine Productivity Interac-tions Experimental Study (PPINES; Roth et al. 2007). This long-term study aims at understanding the genotype£environment interactions in full-sib lob-lolly and slash pine (P. elliottii Engelm. var. elliottii) families. The climate is warm, humid subtropical, with 1,394 mm average annual rainfall, 27°C average annual maximum temperature, and 13°C average annual minimum temperature. Approximately 70% of total mean annual rainfall occurs between the months of March and September (NOAA 2002). In the months of March, June, September, and December, the maximum temperatures were 24.5, 32.9, 31.7 and 20.2°C; while the minimum temperatures were 9.6, 20.3, 20 and 6.1°C, respectively (averages for 53 years). The soil series is classiWed in the USA taxo-nomic system as a Leon (sandy, siliceous, thermic Aeric Alaquod), characterized by <5% silt plus clay and <10 cmolc kg
–1
of cation exchange capacity. The organic C content in the entire soil proWle was
not recorded for this particular location. However, a study of Florida Spodosols (Stone et al. 1993) reported that the organic C density in the soil proWle (1 m depth; mean§S.D.) was 10.4§0.8 g kg–1 and the C concentrations in the A, E, Bh and B’h horizons were 19§20, 1.9§2.1, 17§12, and 8.5§5.0 g kg–1, respectively. The Leon series is a poorly to very poorly drained, sandy soil with a Bh horizon that begins within 76 cm of the soil surface. The water table is as high as 15–45 cm below the soil surface for 1 to 4 months during most years.
The trees were planted in January 2000 in four rep-licate blocks using a randomized complete block, split plot design. Each treatment plot (excluding the border trees) was 0.016 ha for the close spacing treatment and 0.036 ha for the wide spacing treatment. There were eight rows in each treatment plot. The total area of the study was approximately 10 ha. Prior to plant-ing, the entire study was double bedded and treated with Arsenal™ (Imazapyr, 28.7% active ingredient, 1.02 L ha–1) and Garlon™ (Triclopyr, 60% active ingredient, 7.02 L ha–1) to remove the understory veg-etation and to provide a competition free environ-ment. The woody vegetation in the understory included sawtooth palmetto [Serenoa repens (B.) Small.], wax myrtle (Myrica ceriferea L.), runner oak (Quercus pumila Walt.), blueberries (Vaccinium
applied as diammonium phosphate and the understory competition control was achieved by Arsenal™ and Garlon™ as explained above. The high management regime included sustained understory competition control using herbicides and annual fertilization with a complete fertilizer with micronutrients. The nutri-ents added included 368 kg ha–1 nitrogen and 128 kg ha–1 phosphorus applied as urea and diammonium phosphate. Other essential nutrients were 121 kg ha–1 potassium, 45 kg ha–1 magnesium, 45 kg ha-1 cal-cium, 35 kg ha–1 sulfur, 0.89 kg ha–1 boron, 3 kg ha–1 zinc, 2 kg ha–1 manganese, 16 kg ha–1 iron, 4 kg ha–1 copper, and 0.01 kg ha¡1 molybdenum. Directed applications of Arsenal™ (Imazapyr, 28.7% active ingredient, 0.28 L ha–1) and Oust™ (Sulfometuron Methyl, 75% active ingredient, 0.14 L ha–1) as needed provided sustained understory competition control for the Wrst 2 years. Afterwards, the ground cover was kept below 30% through age 3. The entire study was treated when necessary with insecticides Dimilin™ (DiXubenzuron, 22% active ingredient, 292 mL ha–1), Pounce™ (Permethrin, 38.4% active ingredient, 439 mL ha–1) or Mimic™ (Tebufenozide, 24% active ingredient, 585 mL ha–1) for tip moth (Rhyacionia
spp) control during the Wrst growing season.
Out of these treatments, two treatment combina-tions representing the maximum diVerences in bio-mass production were selected in order to evaluate the capacity for short-term SOC changes, with the idea that the diVerences in input would be reXected in the diVerences in SOC pools. The high intensity treat-ment included the most productive family under the high management regime, while the low intensity treatment was represented by the poorest performing family under the low management regime. The closest spacing (1.3 m£3 m, tree density 2,900 trees ha–1) was chosen to maximize the biomass input. At age 5, the best family and the poorest family had 21% diVerence in stem volume (E.J. Jokela, unpublished data) and 11% diVerence in aboveground biomass (Roth et al. 2007).
Soil sampling and analyses
Soil samples were collected in September 2003 from the A horizons, at depth increments of 0 to 5-cm and 5 to 10-cm. One composite sample representing four indi-vidual samples was collected from each of the two depths in the high and low intensity treatment plots in
three replicate blocks. Although subsurface horizons are known to store signiWcant amounts on C in these soils (Stone et al. 1993), this study focused on the sur-face soil as the plantation was only 4-year-old at the time of sampling and the surface soil was expected to exhibit treatment eVects most clearly due to the diV er-ences in litter fall and Wne roots added to the soil. One combined soil sample for each depth of each plot (treat-ment within a block) came from four individual soil samples. The four individual soil samples were ran-domly collected from alternate interbed rows. Soil was collected by removing a monolith with a shovel and then separating the soil depths with a ruler. Roots were not excluded from the soil samples and were analyzed as part of the >8000m and 8000–2000m fractions.
Since the soil moisture content is annually highly variable and “air-dry” conditions are possible in these surface soils under Weld conditions, soil samples were air-dried and passed through 8000 and 2000m
sieves. The <2000m fraction was further
size-frac-tionated in order to contrast dry and wet sieving meth-ods into four size fractions, a macroaggregate fraction 2000–250m, two microaggregate fractions 250–
150m and 150–53m, as well as a <53m fraction.
For dry sieving, samples were sieved in a mechanical shaker for 5 min at 75 rev/min. The purpose was to accomplish size fractionation with minimum destruc-tion of soil structure. A preliminary study determined that there were no signiWcant diVerences in weight distribution among the four size classes after sieving for 5 min (unpublished data). Therefore, this time frame was used for all dry sieving procedures.
Wet sieving followed the procedures of Cambard-ella and Elliott (1993) without pre-wetting because large aggregates were not present. For each sample, 100 g of soil were added to the coarsest sieve (250m) in a tray so that there was standing water
2 cm above the sieve screen. The sample was allowed to stand for 5 min and then the sieve was moved up and down 50 times (for approximately 2 min) taking care that the sieve’s screen broke the water surface every time. The soil suspension in the water tray was then transferred to the next size sieve and the proce-dure was repeated for each successive sieve (150 and 53m). Each sieve, when removed from the water
tray, was allowed to dry for 24 h. The <53m
Analyzer (CE Instruments, model NCS¡2500). The >8000m and 8000–2000m fractions were also
ground and analyzed for total C and N concentrations and used for calculating C and N contents.
Since these soils have low clay content and no car-bonates, loss on ignition (LOI) was used to measure OM content (550°C for 6 h). The ratio of analyzer C to LOI (C:OM ratio) was used to estimate the C con-tent of organic matter in each size fraction. This ratio was compared with the standard Van Bemmelen factor (0.58). The Van Bemmelen factor is a conver-sion factor used for converting organic matter content into carbon content, based on the observation that organic matter generally contains 58% C. Thermal Gravimetric Analysis (Omnitherm 951 TGA; Dupont Co., Wilmington, DE) conWrmed complete combus-tion of C during LOI.
The chemical Wngerprints of the size fractions were investigated using DiVuse ReXectance Infrared Fou-rier Transform Spectroscopy (DRIFTS). DiVuse reXectance spectroscopy obtains the spectra of ples by collecting the radiation that passes into a sam-ple and then is reXected back out by the sample’s internal structure. This method allows for spectral characterization of materials, which would otherwise require either extremely thin sample sections or dilu-tion and grinding with transparent diluents. This is the same technique that has been used for several decades for the rapid analysis of many materials using radia-tion in the near-infrared and visible spectral ranges in the near-infrared reXectance spectroscopy or NIRS. Our samples were scanned before and after ashing (at 550°C for 6 h) in the mid-infrared on a Varian Digi-lab FTS-7000 Fourier Transform Mid-infrared Spec-trometer (Walnut Creek, CA). Samples were scanned from 4000 to 400 cm–1 at 4 cm–1 resolution using a KBr beamsplitter and DTGS detector and a Pike AutodiV autosampler (Pike Technologies, Madison, WI) using ground, non-KBr diluted samples.
Statistical analysis
The statistical signiWcance of treatments was ana-lyzed using PROC GLM (SAS 1996), with forest management intensity, soil depth, soil size fraction, and sieving method as Wxed eVects and with block as a random eVect. The diVerences were considered signiWcant at P< 0.05 and only the signiWcant eVects are reported in the results section. Since the initial
analyses showed a signiWcant depth£fraction inter-action, further analyses were carried out for the indi-vidual size fractions. A multiple comparison procedure with a Tukey-Cramer adjustment was used for the post-hoc mean separation.
For the DRIFTS spectra, spectral subtraction of the ashed samples from the non-ashed samples was used to accentuate OM characterization using GRAMS/AI software Ver. 7.02 (Thermo Galactic, Salem, NH). Discriminant analysis was conducted using SAS (SAS Institute, Cary, NC) partial least squares (PLS). A modiWed SAS program examined spectral pre-treat-ments including gap derivatives, scatter correction, and spectral data point averaging (Reeves and Delwiche 2003). This modiWed version allowed discriminant analysis to be carried out using SAS PLS. Each spec-trum was coded as 1 (being a member) or 0 (not a member) for each state. For situations where only two states exist, such as wet vs. dry sieving, this is straight-forward. If there were more states, such as for size frac-tion, each sample had 4 codes, one for each size fraction, with only one coded 1 and the rest 0. For example, a sample of 2000 to 250m fraction was
coded as 1000 while a sample of 250 to 150m fraction
was coded as 0100. Partial least squares regression was used to study the spectral patterns in question. Results were expressed as R2 values along with the Root Mean Square Deviation. The higher the R2 of the discrimi-nant analysis and the lower the Root Mean Square Deviation, the better was the separation of DRIFTS spectra for the main eVects. An R2 < 0.5 indicated little to no separation and an R2 = 1 indicated complete sep-aration; meaning that the samples were very diVerent.
Results
Dry vs. wet sieving
The total recovery of carbon, as shown by mass bal-ance, did not diVer between wet and dry sieving (Table1.) Sieving method did not aVect estimates of carbon content for size fractions
>
150–53 m.How-ever, wet sieving signiWcantly decreased estimates of C content in the 150–53 m (30%), while increasing
estimates in the <53 m fraction (26%). The
(14%), 150–53m (10%) and <53m (13%) size
fractions. The C: OM ratio was also signiWcantly reduced due to wet sieving in the 150–53m (9%)
and <53m (10%) size fractions. The 2000–250m
fraction was not aVected by the sieving method. Nitrogen concentration or content (Table2) were also not aVected by the sieving method in any of the size fractions examined.
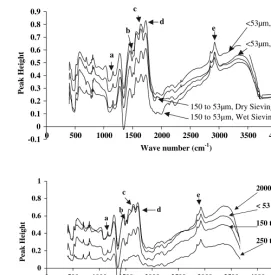
The eVect of sieving method was evident on the chemical Wngerprint of the size fractions as measured by DRIFTS (ash-subtracted spectra R2= 0.94; Table3). Wet sieving reduced C in all four size frac-tions across the entire spectra as indicated by spectral peak heights (Fig.3). DiVerences in the 2000–53m
fractions were more pronounced for esters (1730 cm–
1
), amides (1650 cm–1) and aromatic compounds (1530 cm–1). On the other hand, in the <53m
frac-tion, the diVerence between sieving methods was more pronounced in the aliphatic C-H (2870, 2930 cm–1), and polysaccharide (1160 cm–1) peaks.
Characterization of size fractions
Carbon concentration (Fig.1) was highest in the <53m fraction (7.8–8.8%) and lowest in the 250–
150m fraction (0.6–0.7%). Carbon content
(Table1), on the other hand, was highest in the 2000– 250m fraction and lowest in the <53m fraction.
More than 65% of the total C (Table1) in these soils was found in the 2000–53m fractions, of which
approximately 39% was in the 2000–250m
frac-tion. Nitrogen content (Table2) followed a trend similar to C. The C:OM ratios for the 2000–250m
and 150–53m fractions were 8–27% higher than the
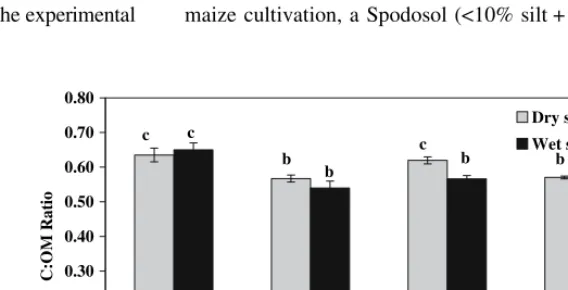
remaining two fractions (Fig.2), which had ratios equal to the standard Van Bemmelen factor (0.58). The C:N ratios of the fractions were not aVected by any of the factors and, therefore, are not reported.
The DRIFTS spectra (Fig.4) conWrmed chemical Wngerprint diVerences among size fractions (ash-sub-tracted spectra R2= 0.94–0.98; Table3). However, the diVerences were mainly in the peak heights corre-sponding to the amount of C in each fraction. The 2000–250m fraction exhibited the highest aliphatic
C-H peaks (2870, 2930 cm–1), while esters (1730 cm–1), amides (1650 cm–1) and polysaccharides (1160 cm–1) were high in both 2000–250 and <53m fractions.
The peak for aromatic rings at 1530 cm–1 was similar in these latter two fractions, but the peak at 1580 cm–1 was absent in the 2000–250m fraction. The ester
and amide peaks were absent in the 250–150m
fraction.
EVect of management intensity and soil depth
In the 5–10 cm depth, low intensity management had 12 and 5% higher C contents in the 2000–250 and 250–150m fractions, respectively, than under the
intensive management regime (Fig.5). Low intensity management also had a 5% higher C content (Fig.5) and 7% higher N content (Fig.6) than the intensive management for the 0–5 cm depth in the 150–53m
fraction. In contrast, the high intensity management regime showed 2% higher C content and 5% higher N content in the <53m fraction at the 5–10 cm depth.
The >2000m fraction exhibited 22–48% higher
Table 1 The eVect of wet and dry sieving on SOC content (g kg–1 whole soil) in soil size fractions for a sandy Spodosol in north
Florida
9 Each value is a mean of 36 observations averaged across treatment intensity and soil depth ‡ Values in parentheses represent standard error
§ The >8000 and 8000–2000
m fractions, though not wet sieved, are necessary for total C content calculations ¶ Within a size fraction, the means followed by diVerent letters are statistically diVerent at P< 0.05
Fraction >8000m 8000–2000m 2000–250m 250–150m 150–53m <53m Total
Dry Sieving 0.0319 0.047 0.11a,¶ 0.036a 0.039b 0.015a 0.28
(0.002)‡ (0.002) (0.01) (0.002) (0.002) (0.001) (0.03)
Wet Sieving 0.031§ 0.047 0.13a 0.032a 0.030a 0.019b 0.29
(0.002) (0.002) (0.01) (0.002) (0.001) (0.001) (0.03)
% of Total SOC Dry 11 17 40 13 14 5 100
C content at the 0–5 cm depth compared to the 5–10 cm depth, but C content in this fraction was not signi W-cantly inXuenced by management intensity.
Soils under the low intensity management regime were higher in OM as shown by consistently greater peak heights (Fig.7; ash-subtracted spectra R2= 0.71;
Table3). At the 0–5 cm depth, diVerences were observed for all the four size fractions, while at the 5– 10 cm depth, diVerences were observed only in the three 2000–53m fractions. This result was observed
across the entire spectrum of OM within each size fraction.
Fig. 1 Carbon concentra-tions (% of fraction) of size fractions as aVected by the dry and wet sieving for a sandy Spodosol in north Florida. Means followed by diVerent letters are statisti-cally diVerent at P< 0.05. The error bars represent standard error. Each value is a mean of 36 observations averaged across treatment intensity and soil depth
0.00 1.00 2.00 3.00 4.00 5.00 6.00 7.00 8.00 9.00 10.00
2000 to 250 µm 250 to 150 µm 150 to 53 µm <53 µm
)
n
oi
tc
a
rf
f
o
%
(
C
Dry sieving Wet sieving
e e
b a
d c
g
f
Table 2 The distribution of N concentration and content among the soil size fractions for a sandy Spodosol in north Florida
9 Each value is a mean of 72 observations averaged across sieving methods, treatment intensity and soil depth. Means are not separated
by sieving method as the N concentration or content was not signiWcantly aVected by the sieving method
‡ Values in parentheses represent standard error
§ The means followed by diVerent letters are statistically diVerent at P< 0.05
Property >8000m 8000–2000m 2000–250m 250–150m 150–53m <53m Whole soil Concentration
(g kg–1 whole soil)
0.03709,e 0.0386e 0.0116c§ 0.0030a 0.0088b 0.0290d 0.0082
(0.0018) (0.0015)‡ (0.0005) (0.0002) (0.0003) (0.0004) (0.0004)
Content (% of whole soil) 7a 12b 39d 19c 16c 7a 100
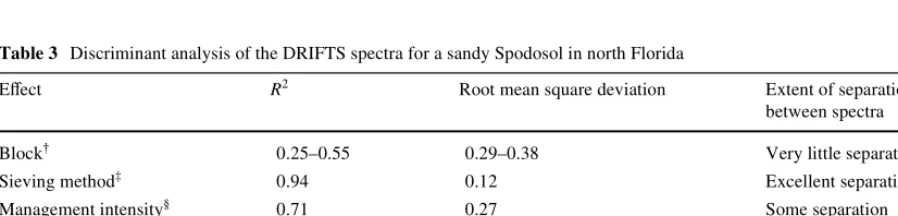
Table 3 Discriminant analysis of the DRIFTS spectra for a sandy Spodosol in north Florida
9 Four blocks (replications across space) ‡ Dry and wet sieving methods § High and low management intensities ¶ Depths 0–5 cm and 5–10 cm
# Fractions 2000–250, 250–150, 150–53 and <53 m
EVect R2 Root mean square deviation Extent of separation
between spectra
Block9 0.25–0.55 0.29–0.38 Very little separation
Sieving method‡ 0.94 0.12 Excellent separation
Management intensity§ 0.71 0.27 Some separation
Depth¶ 0.37 0.40 No separation
Fraction# 0.93–0.98 0.06–0.12 Excellent separation
Discussion
This study was undertaken with the objective of understanding the distribution of C among the size fractions in the surface soil of a forested Spodosol, with the assumption that size fractionation better sep-arated soil C into more unique pools; and to deter-mine the impact of forest management on these pools. Southern pine plantations in the southeastern US rep-resent important regional sinks for C (Richter et al. 1995) and understanding the soil C dynamics is an essential step towards sustainable management of these ecosystems.
Dry vs. wet sieving
The reduction in C content in the 150–53m fraction
and the increase in C content in the <53m fraction
(Table1) indicated a signiWcant transfer of C with wet sieving. This was due to breakdown of water-dispers-ible aggregates in the 150–53m fraction, where the
C and a signiWcant amount of soil mass was washed into the Wnest fraction. This Wnding was consistent with previous work (Angers and Giroux 1996; Carter 1992). The reduction in C concentration (Fig.1) and C:OM ratio (Fig.2) of the <53m fraction indicated
that C was lost even from this fraction as water-solu-ble C. This interpretation was supported by the DRIFTS data, where esters, amides and aromatic com-pounds were lost from the 150 to 53m fraction and
some polysaccharides and aliphatic –CH compounds were lost from the <53m fraction (Fig.3). However,
the statistically equivalent C recovery of the two siev-ing methods showed that the loss of water-soluble C was small, with amounts being within the experimental
error. The redistribution of C among size fractions was the major eVect of wet sieving. The N concentration and content, however, was not aVected by sieving method, suggesting that little N was in a water-soluble or water-dispersible (aggregate) form. Therefore, our hypothesis of greater suitability of dry sieving for these soils was accepted. Dry sieving, which is an easier and quicker method than wet sieving, was con-sidered superior to wet sieving for the extremely sandy soils examined in this study, as it preserved the water-dispersible aggregates and water-soluble C.
Distribution of C and N among size fractions
More than 65% of the C and N was found in the 2000–53m fractions (Table1, 2), which supported
the hypothesis of the importance of these fractions for C content. The <53m accounted for <10% of the
total C. This is unlike soils having higher clay con-tents, where the C contents tend to be highest in the silt + clay size fractions. Hassink et al. (1997) found that more than 50% of the soil C was in the <20m
fraction (65% clay). Feller (1993) and Bronick and Lal (2005) reported similarly high C contents in the silt+clay fraction. Though the C contents reported for extremely sandy soils vary, there is evidence that for-ested sandy soils in other parts of the world have sim-ilarly high C content in the sand size fractions. For example, forested Spodosols in France (<10% silt + clay) were shown to have 50% of the total C in the sand size fraction (Jolivet et al. 2003). Quideau et al. (1998) reported that under hardwood forests, 45–55% of the total C was associated with the sand size fraction (58% sand). In contrast, when under maize cultivation, a Spodosol (<10% silt + clay) had
Fig. 2 The interaction between fraction size and sieving method on the ratio of C to organic matter (C:OM) for a sandy Spodo-sol in north Florida. The means followed by diVerent letters are statistically diV er-ent at P< 0.05. The error bars represent standard errors. Each value is a mean of 36 observations averaged across management
intensity and soil depth 0.00
only 17% of its total C in the sand size fraction (Que-nea et al. 2006).
The nature of OM, as evidenced by C:OM ratios (Fig.2), diVered among size fractions. The DRIFTS data conWrmed this result (Fig.4). The high peaks of esters, amides and aliphatic C in spectra of the 2000–250m fraction indicated recently added,
undecomposed OM and the high C:OM ratio of this fraction indicated presence of C rich organic matter. On the other hand, the high aromatic C peak at 1580 cm–1 in the <53m fraction indicated more
decomposed OM in this fraction, but also showed high peaks of esters and amides, both of which are easily decomposable C forms. The esters and amides proba-bly indicate active microbial biomass or recently added Wne SOC such as sloughed oV root-cap cells or Wne roots, although further studies will be necessary to determine the sources of these compounds.
The C content of organic matter, as measured by the C:OM ratio, is known to change according to soil type and proWle depth (Nelson and Sommers 1982). However, this study indicated that it also changed with fraction size and the sieving method used (Fig.2). A 6% underestimation of C would have resulted if the C content of the 2000–250m fraction
were estimated from the amount of OM using the Van Bemmelen factor (0.58). From a methodological per-spective, these results indicate that one should con-sider using fraction-speciWc conversion ratios when loss on ignition is used to estimate soil fraction C.
Impact of management intensity
The higher soil C content associated with the low intensity management regime for the three 2000 to 53m fractions indicated that intensive forest
man-agement reduced the soil C content in as little as 4 years following treatment (Fig.5). Therefore, the hypothesis of C reduction under the high intensity management regime was accepted. A possible cause of this decline would be the reduction of root input caused by the understory competition control prac-tice. Shan et al. (2001) and Echeverria et al. (2004), working on similar soils in Georgia, have reported a decrease in SOC due to intensive forest management that included a chemical understory control treatment. However, it is uncertain in the longer term whether this C reduction would be compensated for by an increase in litterfall production expected under the intensive management regime. For example, Jokela
Fig. 3 DiVuse ReXectance Infrared Fourier Transform Spectroscopy spectra show-ing eVect of sieving method (150–53 and <53m fractions, low intensity, 5–10 cm depth) for a sandy Spodosol in north Florida. a
polysaccharides, b aromatic compounds, c amides, d
esters, e aliphatic –CH
-0.1
0 500 1000 1500 2000 2500 3000 3500 4000 4500
Wave number (cm-1)
<53µm, Dry Sieving
<53µm, Wet Sieving
a c
d
e b
150 to 53µm, Dry Sieving
150 to 53µm, Wet Sieving
Fig. 4 DiVuse ReXectance Infrared Fourier Transform Spectroscopy spectra show-ing eVect of fraction size (dry sieving, high intensity, 0 to 5 cm depth) for a sandy Spodosol in north Florida. a
polysaccharides, b aromatic compounds, c amides, d
esters, e aliphatic –CH
-0.4
0 500 1000 1500 2000 2500 3000 3500 4000 4500
and Martin (2000) reported that annual loblolly pine litterfall production in 10-year-old stand growing on a Spodosol in north Florida peaked at approximately 7.0 Mg ha–1 year–1 under an intensive fertilizer and competition control treatment compared to 2.2 Mg ha–1 year–1for the control. The C loss across the entire spectrum of organic matter (Fig.7) as shown by the DRIFTS spectra was also unexpected. Management intensity was not expected to aVect aromatic C in such a short time frame. Changes in the chemical composition of the inputs, either litter or roots, might be responsible for this eVect and a spectroscopic anal-ysis of the OM inputs under diVering management intensities should help to address this question.
The hypothesis of higher N content in all fractions was not accepted, since N content showed only a small increase (5%) in the Wnest fraction (Fig.6). The
fate of fertilizer N applied under the intensive man-agement regime is uncertain. It is likely that the immobilization of fertilizer N in the standing crop biomass and forest Xoor is the responsible mecha-nism. This interpretation is supported by the work of Will et al. (2006), who reported that 68% of applied fertilizer N was stored in the aboveground biomass and forest Xoor in loblolly pine stands growing in Georgia.
Measurement of OC in soil size fractions proved to be a more sensitive method than total SOC measure-ment for investigating changes in soil C. Managemeasure-ment induced change in the 2000–250m fraction was
23% of the fraction’s C content (Fig.5), which repre-sented about a 12% change in total SOC, illustrating the sensitivity of this size fraction for assessing the impacts of forest management. It is also noteworthy
Fig. 5 EVect of
management intensity and soil depth on the C content of the soil size fractions for a sandy Spodosol in north Florida. Within a size fraction, the means followed by diVerent letters are statis-tically diVerent at P< 0.05, showing the eVect of both management intensity and depth. Each value is a mean of 18 observations averaged
across sieving methods 0.00
0.20
250 to 150µm 150 to 53µm <53µm
)li
Fig. 6 EVect of management intensity and soil depth on N con-tent (g N in a soil fraction per 100 g of whole soil) in soil size fractions for a sandy Spodosol in north Florida. Within a size fraction, the means followed by diVerent letters are statistically
diVerent at P< 0.05, showing the eVect of both management intensity and depth. Each value is a mean of 18 observations averaged across sieving methods
that these diVerences were observed just four years after the treatments were imposed, supporting the hypothesis that size fractionation enhances detection of the short-term management induced changes in SOC.
Given the presence of large palmetto roots (Serenoa repens (B.) Small) and other understory plants present under the low intensity management regime (Roth et al. 2007), we expected that the fractions >2000m would decrease signiWcantly with
increased management intensity. The lack of a statis-tical C response to management in these fractions, the reduced C content in the 2000–250m fraction under
the intensive management regime, and the “fresher” nature of the OM as suggested by DRIFTS imply that the large sand fraction accepts the greatest detrital inputs. This interpretation is consistent with the work of Van Rees and Comerford (1986) and Escamilla et al. (1991), who have reported palmetto and other understory root biomass in the 2000–250m size
class under southern pine plantations, as well as the studies of Aita et al. (1997); Angers et al. (1997) and Puget et al. (2000).
In conclusion, dry sieving represented a useful method for size fractionation in sandy Spodosols when compared to wet sieving, as it preserved more structure and the water-soluble components such as esters and amides. The size fractions were signiW -cantly diVerent in all the properties studied. The 2000–250m fraction was the most important
frac-tion in these soils, as it contained nearly half of the total SOC and was sensitive to the forest management related changes. The DRIFTS spectra were also useful for describing the changes in chemical composition of
SOM and indicated presence of recently added organic matter in the large sand fraction. Intensive for-est management reduced soil C in the >53m
frac-tions, and particularly in the 2000–250m fraction, in
just four years, probably due to the reduction in under-story roots.
Acknowledgements We wish to thank the Forest Industrial members of the Forest Biology Research Cooperative, School of Forest Resources and Conservation, University of Florida for their monetary support for this research with particular thanks to International Paper Co. for the use of the study on their lands.
References
Adegbidi HG, Jokela EJ, Comerford NB, Barros NF (2002) Bio-mass development for intensively managed loblolly pine plantations growing on Spodosols in the southeastern USA. For Ecol Manage 167:91–102
Aita C, Recous S, Angers DA (1997) Short-term kinetics of residual wheat straw C and N under Weld conditions: char-acterization by 13C 15N tracing and soil particle size frac-tionation. Eur J Soil Sci 48:283–294
Albaugh TJ, Allen HL, Dougherty PM, Kress LW, King JS (1998) Leaf area and above- and below-ground growth re-sponses of loblolly pine to nutrient and water additions. For Sci 44:317–328
Angers DA, Mehuys GR (1990) Barley and alfalfa cropping eVects on carbohydrate content of a clay soil and its size fractions. Soil Biol Biochem 22:282–288
Angers DM, Giroux M (1996) Recently deposited organic mat-ter in soil wamat-ter-stable aggregates. Soil Sci Soc Am J 60:1547–1551
Angers DA, Bolinder MA, Carter MR, Gregorich EG, Drury CF, Liang BC, Voroney RP (1997) Impact of tillage prac-tices on organic carbon and nitrogen storage in cool, humid soils of eastern Canada. Soil Till Res 41:191–201 Bronick CJ, Lal R (2005) Manuring and rotation eVects on soil
organic C concentration for diVerent aggregate size
Fig. 7 DiVuse ReXectance Infrared Fourier Transform Spectroscopy spectra showing eVect of intensity (2000–250m fraction, dry sieving, 0–5 cm depth) for a sandy Spodosol in north Florida. a polysaccharides,
b aromatic compounds, c
0 500 1000 1500 2000 2500 3000 3500 4000 4500
Wave number (cm-1)
High intensity Low intensity
a b
c
d
fractions on two soils in northeastern Ohio, USA. Soil Till Res 81:239–252
Cambardella CA, Elliott ET (1993) Methods of physical separa-tion and characterizasepara-tion of soil organic matter fracsepara-tions. Geoderma 56:449–457
Carter MR (1992) InXuence of reduced tillage systems on or-ganic matter, microbial biomass, macro-aggregate distri-bution and structural stability of the surface soil in a humid climate. Soil Till Res 23:361–372
Christensen BT (1992) Physical fractionation of soil and organ-ic matter in primary partorgan-icle size and density separates. Adv Soil Sci 20:1–89
Dalla-Tea F, Jokela EJ (1991) Needlefall, canopy light intercep-tion, and productivity of young intensively managed slash and loblolly pine stands. For Sci 37:1298–1313
Echeverria ME, Markewitz D, Morris LA, Hendrick RL (2004) Soil organic matter fractions under managed pine planta-tions of the southeastern USA. Soil Sci Soc Am J 68:950– 958
Ellert BH, Gregorich EG (1995) Management-induced changes in the actively cycling fractions of soil organic matter. In: McFee WW, Kelly JM (eds) Carbon Forms and Functions in Forest Soils. S.S.S.A., Madison, WI, pp 119–138 Escamilla JA, Comerford NB, Neary DG (1991) Soil core break
method to estimate pine root distribution. Soil Sci Soc Am J 55:1722–1726
Feller C (1993) Organic inputs, soil organic matter and func-tional soil organic compartments in low capacity clay soils in tropical zones. In: Mulongoy K, Merckx R (eds) Soil Or-ganic Matter Dynamics and Sustainability of Tropical Agriculture. IITA/K.A. Leuven. John Wiley & Sons, Chichester, NY, pp 77–88
Grierson PF, Comerford NB, Jokela EJ (1998) Phosphorus min-eralization kinetics and response of microbial phosphorus to drying and rewetting in a Florida Spodosol. Soil Biol Biochem 30:1323–1331
Grierson PF, Comerford NB, Jokela EJ (1999) Phosphorus mineralization and microbial biomass in a Florida Spodo-sol: eVects of water potential, temperature and fertilizer application. Biol Fert Soil 28:244–252
Harding RB, Jokela EJ (1994) Long-term eVects of forest fertilization on site organic matter. Soil Sci Soc Am J 58:216–221
Harris WG, Carlisle VW (1987) Clay mineralogical relation-ships in Florida Haplaquods. Soil Sci Soc Am J 51:481– 484
Hassink J, Whitmore AP, Kubat J (1997) Size and density fractionation of soil organic matter and the physical capac-ity of soils to protect organic matter. Eur J Agron 7:189– 199
Jolivet C, Arrouays D, Leveque J, Andreux F, Chenu C (2003) Organic C dynamics in soil particle-size separates of sandy Spodosols when forest is cleared for maize cropping. Eur J Soil Sci 54:257–268
Jokela EJ, Martin TA (2000) EVects of ontogeny and soil nutri-ent supply on production, allocation, and leaf area eY -ciency in loblolly and slash pine stands. Can J For Res 30:1511–1524
Jokela EJ, Dougherty PM, Martin TA (2004) Production dynamics of intensively managed loblolly pine stands in
the southern United States: a synthesis of seven long-term experiments. For Ecol Manage 192:117–130
Liu QM, Wang SJ, Piao HC, Ouyang ZY (2003) The changes in soil organic matter in a forest-cultivation sequence traced by stable C isotopes. Aust J Soil Res 41:1317–1327 Martin TA, Jokela EJ (2004) Stand development and production
dynamics of loblolly pine under a range of cultural treat-ments in north-central Florida USA. For Ecol Manage 192:39–58
Marx MC, Kandeler E, Wood M, Wermbter N, Jarvis SC (2005) Exploring the enzymatic landscape: distribution and kinet-ics of hydrolytic enzymes in soil particle-size fractions. Soil Biol Biochem 37:35–48
Nelson DW, Sommers LE (1982) Total C, organic C, and organ-ic matter. In: Page AL et al. (eds) Methods of Soil Analy-sis, Part 2, Chemical and Microbiological Properties. A.S.A., Madison, WI, pp 539–579
NOAA (2002) State, regional, and national monthly precipita-tion: area-weighted monthly normals, 1971–2000 (and pre-vious periods), 4–2. Historical Climatography Series Polglase PJ, Jokela EJ, Comerford NB (1992a) Nitrogen and
phosphorus release from decomposing needles of southern pine plantations. Soil Sci Soc Am J 56:914–920
Polglase PJ, Comerford NB, Jokela EJ (1992b) Mineralization of nitrogen and phosphorus from soil organic matter in southern pine plantations. Soil Sci Soc Am J 56:921–927 Post WM, Emanuel WR, Zinke PJ, Stangenberger AG (1982)
Soil carbon pools and world life zones. Nature (London) 298:156–159
Puget P, Chenu C, Balesdent J (2000) Dynamics of soil organic matter associated with primary particle size fractions of water-stable aggregates. Euro J Soil Sci 51:595–605 Quenea K, Largeau C, Derenne S, Spaccini R, Bardoux G,
Mar-iotti A (2006) Molecular and isotopic study of lipids in par-ticle size fractions of a sandy cultivated soil (Cestas cultivation sequence, southwest France): Sources, degra-dation, and comparison with Cestas forest soil. Org Geo-chem 37:20–44
Quideau SA, Graham RC, Chadwick OA, Wood HB (1998) Or-ganic C sequestration under chaparral and pine after four decades of soil development. Geoderma 83:227–242 Reeves III JB, Delwiche SR (2003) SAS partial least squares
regression for analysis of spectroscopic data. J Near Infra-red Spectrosc 11:415–431
Richter DD, Markewitz D, Dunsomb JK, Heine PR, Wells CG, Stuanes A, Allen HL, Urrego B, Harrison K, Bonani G (1995) Carbon cycling in a loblolly pine forest: implica-tions for the mission carbon sink and for the concept of soil. In: McFee WW, Kelly JM (eds) Carbon Forms and Functions in Forest Soils. S.S.S.A., Madison, WI, pp 223– 251
Romkens PFAM, Van der Plicht J, Hassink J (1999) Soil organ-ic matter dynamorgan-ics after the conversion of arable land to pasture. Biol Fertil Soils 28:277–284
Roth BE, Jokela EJ, Martin TA, Huber DA, White TL (2007) Family x environment interactions for selected loblolly and slash pine plantations in the southeastern United-States. For Ecol Manage 238:175–188
L. stands in response to 6 years of intensive management. For Ecol Manage 192:59–70
SAS (1996) SAS/STAT Software, Changes and Enhancement through release 6.11. SAS Institute Inc., Cary, NC, pp 1104 Shan JP, Morris LA, Hendrick RL (2001) The eVects of man-agement on soil and plant carbon sequestration in slash pine plantations. J Appl Ecol 38:932–941
Shi W, Dell E, Bowman D, Iyyemperumal K (2006) Soil enzyme activities and organic matter composition in a turf-grass chronosequence. Plant Soil 288:285–296
Solomon D, Lehmann J, Kinyangi J, Liang BQ, Schafer T (2005) Carbon K-edge NEXAFS and FTIR-ATR spectro-scopic investigation of organic carbon speciation in soils. Soil Sci Soc Am J 69:107–119
Stone EL, Harris WG, Brown RB, Kuehl RJ (1993) Carbon stor-age in Florida Spodosols. Soil Sci Soc Am J 57:179–182
Van Rees KCJ, Comerford NB (1986) Vertical root distribution and strontium uptake of a slash pine stand on a Florida Spodosol. Soil Sci Soc Am J 50:1042–1046
Will RE, Markewitz D, Hendrick RL, Meason DF, Crocker TR, Borders BE (2006) Nitrogen and phosphorus dynamics for 13-year-old loblolly pine stands receiving complete com-petition control and annual N fertilizer. For Ecol Manage 227:155–168
Will RE, Munger GT, Zhang YJ, Borders BE (2002) EVects of annual fertilization and complete competition control on current annual increment, foliar development, and growth eYciency of diVerent aged Pinustaeda stands. Can J For Res 32:1728–1740