www.elsevier.com / locate / bres
Research report
Temporal changes in neuronal dropout following inductions of
lithium / pilocarpine seizures in the rat
*
Oksana Peredery, M.A. Persinger , Glenn Parker, Leon Mastrosov
Neuroscience Laboratory, Departments of Psychology and Biology, Laurentian University, Sudbury, Ontario, Canada P3E 2C6 Accepted 18 July 2000
Abstract
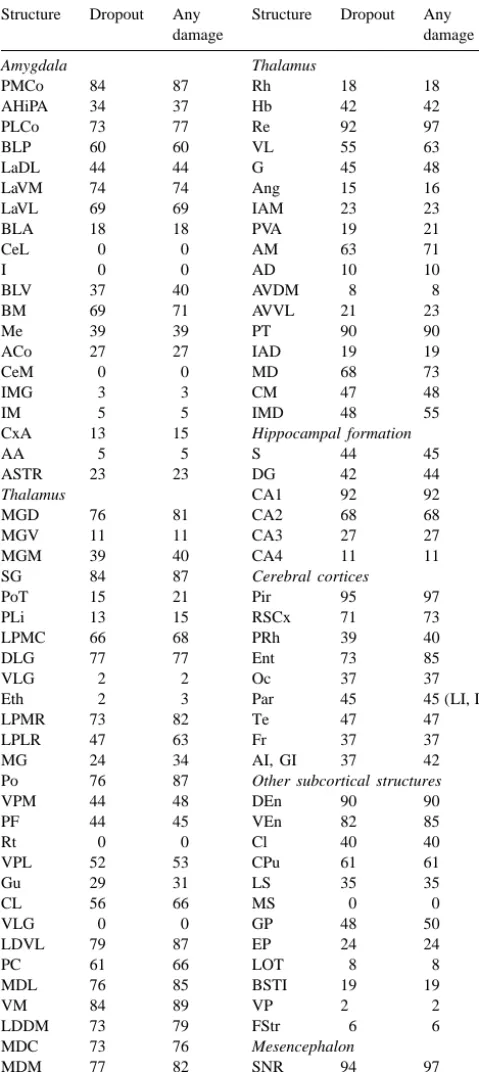
Estimates of neuronal dropout for approximately 100 structures as defined by Paxinos–Watson were completed for brains of male Wistar albino rats between 1 and 50 days after status epilepticus was evoked by a single systemic injection of lithium and pilocarpine. Sample estimates of neuronal loss were strongly correlated with direct measures of cell density. The most extensive immediate damage occurred within the substantia nigra reticulata, CA1 field of the hippocampus, the piriform cortex and the reuniens and paratenial nuclei of the thalamus. Neuronal dropout continued in many other structures over a 50-day period. Structures that showed the greatest 2-deoxyglucose (2-DG) uptake during discrete seizures and waxing and waning seizures within the early stages of status epilepticus but the least 2-DG uptake at the time of late continuous spiking and fast spiking with pauses [Neuroscience 64 (1995) 1057, 1075] exhibited the most neuronal dropout. Relationships between the delay of injection of acepromazine (which facilitated survival) and the amount of damage suggested that the source of the process that results in permanent brain damage may originate within the region of the piriform cortices and its subcortices. 2000 Elsevier Science B.V. All rights reserved.
Keywords: Thalamus; Lithium; Muscarinic effect; Brain region; Acepromazine; Seizure; 2-Deoxyglucose
1. Introduction during the first few hours after the induction of the seizures, as reported by other researchers [5,6]. We The induction of limbic seizures by the systemic in- reasoned that if the neuronal losses following this model of jection of 3 mEq / kg of lithium chloride and 30 mg / kg of lithium / pilocarpine-induced seizures were robust and pilocarpine [10] produces intractable electrical activity that generalizable, our measures of neuronal damage should be results in excitotoxic or (delayed) apoptotic death within correlated significantly with metabolic indicators measured all structures that were functionally associated with the by other researchers for a different sample of rat brains. structures in which the seizures originated. We have been
able to measure these histopathological changes months
after the induction of status epilepticus [11,20,22] because 2. Materials and methods
a single subcutaneous injection of acepromazine within 30
min after the onset of the overt motor component of the 2.1. Animals and treatment seizure reduces the 48-h mortality from more than 90% to
less than 20% [7]. A total of 72, 90 to 120 day old male Wistar albino rats, The present experiments were designed: (1) to discern obtained from Charles River (Quebec) were selected as which structures exhibited histopathological changes over subjects. All rats were injected subcutaneously with 3 the 50 days following the induction of the status epi- mEq / kg of lithium chloride and then either 4 or 24 h later lepticus, and (2) to compare the estimates of neuronal with 30 mg / kg of pilocarpine. The rats whose brains were losses within these structures with their metabolic activity used in the major study (n562) were injected 1 h after the injection of the pilocarpine (about 30 min after the onset of the forepaw clonus) with 25 mg / kg of acepromazine
*Corresponding author. Behavioral Neuroscience Program, Laurentian
(Atravet). Overt signs of status epilepticus were reduced
University, Sudbury, Ontario, Canada P3E 2C6. Tel.:11-705-675-4824 /
but not eliminated.
4826; fax:11-705-671-3844.
E-mail address: [email protected] (M.A. Persinger). Between 1 and 50 days after the onset of the seizure, the
rats were decapitated. The cerebrums were removed within and multiplying by 100. The level of statistical significance
2
5 min, fixed in ethanol–formalin–acetic acid (EFA), and and the effect size (h ) between the measures from brains processed according to established procedures [18]. Coron- in which seizures had been induced and the reference al, 10mm sections were selected every 200 mm between brains were obtained by analysis of variance.
the caudal mesencephalon and the anterior commissure.
Each section was stained with toluidine blue O. This 2.3. Temporal differences fixation and staining produced very sharp
histomorphologi-cal detail that we have found clearer and more consistent Our previous quantitative analyses of this type of brain than fixation in 10% formalin (buffered or not) and damage and the correlative behavioral changes in the rats staining with other basophilic dyes. [14] had suggested two significant inflection times: the first occurred between postseizure days 10 and 18–20 days, 2.2. Micromorphology and quantification when rats began to display many of their bizarre behaviors such as increased aggression [3] and persistent gnawing The total area of each coronal section for each rat was [2]. The second time occurred after 30 to 35 days, when evaluated by light microscopy at 1003and 4003. Each of the progressive (lateral) ventricular dilatation [22] that had the structures, as defined by Paxinos and Watson [16], was been evident since postseizure day 5 had approached an assessed according to an ordinal ranking scale; successive- asymptote and the crystalline formations aggregated into ly higher scores were used to infer more extensive damage. large discernable masses [11].
Construct validity of this measure had been suggested by To test the hypothesis that neuronal loss or changes the strong (0.80) correlation between quantitative values could emerge (or become apparent) in different structures
2
for damage within the medial dorsal thalamic nucleus and after the initial damage from the seizure induction, x
the severity of behavioral deficits in different types of analyses (P,0.05, which was equivalent to a f correla-radial arm mazes [8]. tion .0.40) for the nominal measure of neuronal dropout The scale was constructed as follows: 0, no discernable were completed for the brains of rats that were killed damage; 1, diffuse neuronal dropout; 2, multiple areas of during specific intervals after the induction of the seizures. cystic lesions (e.g., no cells or a fine reticular fiber The intervals, which had been selected on the bases of the network); 3, pervasive distribution of small dark Nissl- qualitative changes in behavior we had observed during staining grains (1 to 10 mm); 4, larger aggregates of dark our original studies [21,22], were: (1) 1 through 5 days staining Nissl material (.1 mm diameter and sometimes (n515) vs. 10 days (n516) postseizure, (2) 1 through 10 involving the entire structure); and 5, crystalline forma- days vs. 15 through 18 days (n515) postseizure, and (3) 1 tions of aggregates of this material which have been shown through 18 days vs. 50 days (n516) postseizure induc-by atomic absorption and histochemistry to contain dense tion. For the latter comparison the measure of the sum of concentrations of calcium [11]. Two measures were ob- the different types of damage was calculated (because of tained for each structure: (1) the percentage of brains the possibility that accretion of the G factor could occur (animals) that displayed only neuronal dropout, and (2) the without continued neuronal dropout) and evaluated by percentage of brains that displayed any form of neuronal one-way analysis of variance.
(sum of Type 1 to Type 5) damage.
To verify that our qualitative measures by visual inspec- 2.4. Comparison with 2-DG measures from other studies tion were valid, neuronal densities were determined for
for the later stages of the status epilepticus and the two regions of the diencephalon and telencephalon following measures of damage in our study. the induction of status epilepticus by lithium and pilocar-pine. Only the reticulata component of the substantia nigra 2.5. Latency before injection of acepromazine (SNR) was damaged within the mesencephalon. Neuronal dropout and diffuse gliosis was found in many regions of To assess if the injection of acepromazine was in- the thalamus, amygdala, SNR, hippocampus and basal strumental in the stabilization of the seizure-induced brain ganglia. The neuropathology within the SNR was always damage, an additional 10 rats were injected with acep- located in the lozenger-shaped region that receives romazine between 0 and 6 h after the injection of the thalamic inputs. After about 20 days following the seizure pilocarpine. These rats were killed 48 h later; the brains induction, there was minimal gliosis and maximal neuronal were removed and processed as specified earlier. Bivariate dropout within this region.
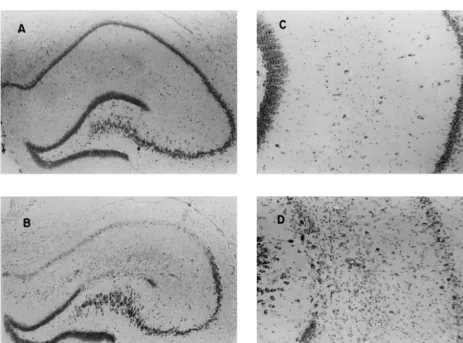
correlations (Pearson r) were completed for the time (in h) Severe neuronal loss and gliosis were found almost between the pilocarpine–acepromazine injections and the always within the CA1 region of the hippocampus (Fig. 1). amount of total damage within each structure. All statisti- Within the amygdala, neuronal dropout and gliosis were cal analyses involved SPSS software on a VAX 4000 distributed diffusely throughout specific nuclear structures computer. while other structures, such as the central group, were not affected. Near-complete neuronal dropout, with cystic lesions, was found only within the limbic cortices such as
3. Results the entorhinal and piriform regions (Fig. 2).
Neuronal dropout and gliosis occurred within 10 days of 3.1. Qualitative patterns the seizure induction in most structures. After about 20 days, within many thalamic nuclei, a second phenomenon Different types of neuronal damage dominated different evolved. Darkly staining Nissl material was accumulated
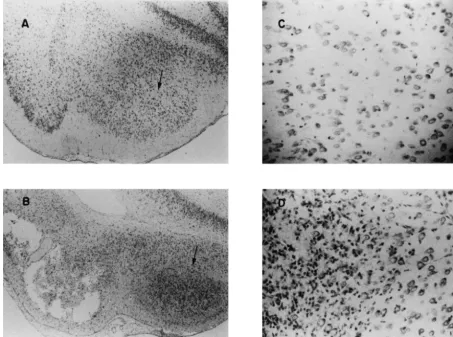
Fig. 2. Photomicrographs (403) of the entorhinal cortices (below the A) and the amygdala (arrow) for a control brain and of the entorhinal cortices with cystic lesions (below the B) and the amygdala (arrow) for a seized brain. The gliosis within the amygdala of the seized brain (D, 1003) is not evident in the amygdala (C, 1003) of the normal brain.
within discrete thalamic structures. By postseizure day 50, around and including the suprageniculate nucleus. The these diffuse bluish areas slowly resolved into dense reuniens and paratenial nuclei of the thalamus deserve formations; about half of them displayed crystalline special attention because of their extremely frequent characteristics (Fig. 3) which were similar to those shown (.90%) devastation of neuronal populations. The least [11] to contain dense calcium deposits embedded within a (.2% but ,15%) damaged structures were the ventral mucopolysaccharide matrix. portions of the lateral and medial geniculate, the reticular nucleus and the limbic thalamic nuclei. Neocortices 3.2. Semiquantitative patterns over time showed a moderate (40%) frequency of damage; the temporal and parietal cortices were damaged significantly The percentages of brains (n562) that displayed any (P,0.05) more often than the frontal, occipital, insular or discernable neuronal dropout within the amygdala, perirhinal cortices. There was almost total neuronal drop-thalamus, and other structures are shown in Table 1. The out within the piriform, retrosplenial, and entorhinal total damage score, defined as the sum of all types of cortices.
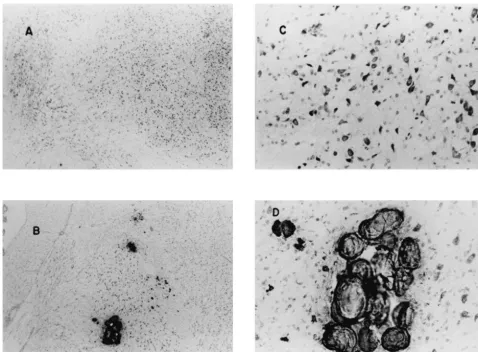
Fig. 3. Photomicrographs (403) of the lateral portion of the thalamus in a control brain (A) and a brain (B) in which seizures had been induced about 50 days previously. The largest aggregate of crystalline material noted in B is magnified (1003) in D. For comparison, a comparable area of the thalamus is magnified (1003) in the control brain.
striatum was sparse, while the dorsolateral region which (MGD, MGM) and the centrolateral, gelatinosus and represents the forelimbs displayed discernable cell dropout; gustatory nuclei of the thalamus. Enhanced dropout was the entopeduncular nucleus was mildly affected but there evident within the occipital, temporal, frontal, perirhinal, were no discernable changes within the nucleus accum- insular (agranular) and cingulate cortices and within sever-bens, substantia innominata, and the region surrounding al subcortical telencephalic structures; damage within the and including the Islands of Calleja. CA3 region during this period was notable. The only Table 2 shows only those structures that displayed conspicuous increase in anomalous histomorphology that postseizure, time-dependent changes in the incidence of occurred between postseizure days 1 through 20 vs. day 50 neuronal dropout between postseizure days: (a) 1 through 5 was evident for the total damage score and involved for the vs. 10, (b) 1 through 10 vs. 15 through 18 and (c) 1 most part those structures in which aggregates of calcium through 18 vs. 50. A ‘1’ refers to an increased incidence deposits had been observed previously [11] in other brains. of neuronal dropout, while a ‘2’ refers to a decrease; the
criterion was a f coefficient of greater than 0.40 (P, 3.3. Quantification and validity of measures 0.05); a ‘0’ reflects no statistically significant change. In
general, the results suggested little additional dropout The means and standard deviations for neuronal cell
2
between days 1 through 5 and days 10 (after the first stage density (cells / mm ) within 10 thalamic nuclei, that dis-of pathology which was evident within 24 h). played the range in percentage incidence of damage within However, between postseizure days 10 and 18, when our population of brains, are shown in Table 3. Means and most of the peculiar rat behaviors began to emerge standard deviations for control brains are also indicated as
2
Table 1 Table 2
Percentage of brains that displayed neuronal dropout or any form of Structures in which there was a significant change (1, increase; 2, necrosis within specific structures. Abbreviations are from Paxinos and decrease) in neuronal dropout or total damage in brains of rats that were Watson [16] killed various times (in days) after seizure induction. Abbreviations are
from Paxinos and Watson [16] Structure Dropout Any Structure Dropout Any
damage damage Structure Neuronal dropout Total damage
,20 vs. 50
BLV 37 40 AVDM 8 8 Thalamus
BM 69 71 AVVL 21 23 MGD 1 0 0 0
CxA 13 15 Hippocampal formation DLG 0 0 0 1
AA 5 5 S 44 45 LPMR 0 0 0 1
SG 84 87 Cerebral cortices LDDM 0 0 0 1
PoT 15 21 Pir 95 97 Hb 1 0 0 0
VPM 44 48 DEn 90 90 Hippocampal formation
PF 44 45 VEn 82 85 S 0 1 1 0
MDC 73 76 Mesencephalon of 10 brains) and the proportion of all (n562) brains that
MDM 77 82 SNR 94 97
displayed some form of damage.
SNC 0 0
3.4. Comparisons of 2-DG measures and neuronal
dropout
variance in cell loss that could be attributed to the seizures
Table 3 3.5. Damage and latency of acepromazine injection
3
Means and standard deviations for the cellular density of neurons (1310
2
cells / mm ) for sample thalamic nuclei. Abbreviations are from Paxinos
The increased incidence and severity of neuronal
drop-and Watson [16]
out within the diencephalon and telencephalon as a
func-2
Nuclei Control Seizure F-value h
tion of the time (20.5 to 6 h) between the seizure onset
M S.D. M S.D. and removal of the brain were qualitatively conspicuous.
Statistically significant (r.0.60) correlations were evident
PF (L) 1.22 0.06 0.99 0.22 4.70* 0.28
VM 0.47 0.04 0.29 0.13 7.22* 0.38 for the entorhinal cortices, amygdaloid–hippocampal tran-RH 2.26 0.11 1.94 0.32 3.56 0.23 sition area, basolateral nucleus (anterior part) of the MD (L) 0.72 0.05 0.12 0.07 242.70*** 0.95
amygdala, anteroventral thalamic nucleus (ventrolateral
LPMC 0.77 0.02 0.12 0.07 303.16*** 0.95
part) and CA3 of the hippocampal formation. The severity
VPL 0.51 0.01 0.40 0.08 8.96* 0.43
of damage rapidly increased when the acepromazine
Re 1.20 0.05 0.05 0.03 2830.86*** 0.99
IAM 1.21 0.18 0.28 0.20 66.60*** 0.85 injection was delayed for more than 2 h. Even when AVVL 2.04 0.22 1.30 0.24 27.93*** 0.70 acepromazine was injected before the seizure onset (within
VLG 0.99 0.10 0.83 0.07 11.22** 0.48
seconds of the pilocarpine), pervasive neuronal dropout
*P,0.05, **P,0.01, ***P,0.001. was still discernable within 48 h for all brains for the
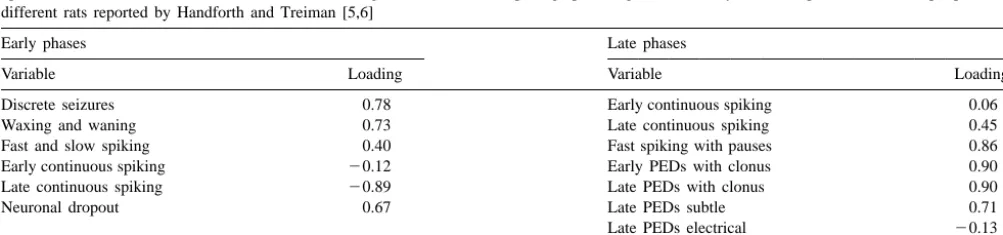
following structures: piriform cortices, CA1 of the hip-pocampus, the dorsal and ventral endopiriform nuclei, 62 brains in our major study) are shown in Table 4. (To be basolateral nucleus of the amygdala (anterior part), conservative, we accepted only loading coefficients that mediodorsal thalamic nuclei (medial and central part), the explained at least 50% of the variance (r.0.70) as nucleus reuniens and the reticulata of the substantia nigra. statistically significant.) The structures that showed the
greatest metabolic activation, as inferred by 2-DG, during
waxing and waning and discrete spiking electrical seizures 4. Discussion
also showed the most consistent neuronal dropout in our
population of brains. The results replicated and extended previous reports that However, the structures that showed the greatest 2-DG evolving histopathology within the rat brain following a activity during the fast spiking with pauses and late systemic injection of lithium and pilocarpine simulates the continuous spiking during the later phases of status patterns of neuronal dropout associated with single, larger epilepticus in the Handforth and Treiman study exhibited dosages of pilocarpine [1,23]. In general, the temporal the least cell loss in our study. The loading coefficients for evolution of the neuronal loss within various diencephalic these variables, when the total damage measures were and telencephalic structures was similar to those that employed instead of the proportion of neuronal dropout, followed limbic status epilepticus evoked by direct electri-were similar in magnitude and statistical significance. The cal stimulation [26].
statistically significant (P,0.05) Pearson r and Spearman The results of the present study indicated that neuronal
r correlations (in parentheses, respectively) between the loss may continue beyond the 48-h period, the frequent neuronal dropout and the EEG measures were: discrete endpoint in many studies. We measured additional losses seizures (0.40, 0.51), late continuous spiking (20.50, of neurons between days 10 and 18 after the induction of
20.61), fast spiking with pauses (20.59, 20.63), early seizures. These changes occurred within structures that PEDs (periodic epileptic discharges) with clonus (20.40, have been associated with the clear emergence of
hy-20.51) and late PEDs with clonus (20.46, 20.60). perresponsiveness to sounds, persistent micromovements
Table 4
Factor loadings (r values) after varimax rotation for the amount of damage in Paxinos and Watson-designated structures in the present study and the 2-DG uptake values (subtracted from lithium controls) during various electroencephalographic stages of the early and later phases of status epilepticus from different rats reported by Handforth and Treiman [5,6]
Early phases Late phases
Variable Loading Variable Loading
Discrete seizures 0.78 Early continuous spiking 0.06
Waxing and waning 0.73 Late continuous spiking 0.45
Fast and slow spiking 0.40 Fast spiking with pauses 0.86
Early continuous spiking 20.12 Early PEDs with clonus 0.90
Late continuous spiking 20.89 Late PEDs with clonus 0.90
Neuronal dropout 0.67 Late PEDs subtle 0.71
Late PEDs electrical 20.13
of the pinnae [19,21], aggressive behavior [3,19], at- What was clear, however, is that those structures that tenuated conditioned taste aversion [19,20], remarkably displayed the greatest uptake of 2-DG during late continu-poor spatial maze acquisition [8,20] and loss of maternal ous spiking and fast spiking with pauses in the Handforth behavior [17]. The cause of the neuronal loss, which could and Treiman study [5,6] displayed less neuronal dropout in include delayed excitotoxic effects, apoptosis, or the our study. If this specific pattern of electrical seizures consequences of recurrent spontaneous seizures that are reflects the changes in inhibitory neurons [25] or metabolic displayed by these rats during their lifetimes, must still be pathways that attenuate excitotoxic consequences within discerned. these structures, then one would expect less neuronal
The specific structures that were damaged and the dropout due to either necrosis or apoptosis. similar magnitudes of this damage were consistent with
results from other techniques [4,12,13,24,25]. For example,
the small lozenger-shaped region of damage within the Acknowledgements substantia nigra reticulata was the region that receives
inputs from the most damaged nuclei of the thalamus. The Thanks to Ayerst Laboratories, Montreal, Quebec, for similar magnitude of the damage within the nucleus supplying the acepromazine. This research was supported, reuniens and layers I and III of the entorhinal cortices and in part, by a grant from the Laurentian University Research the molecular stratum of the CA1 field of the hippocampus Foundation. Technical support from C. Blomme and L. would be compatible with the distribution of contributions Brosseau is appreciated.
revealed by horseradish peroxidase [9,27]. Such conver-gence of results from varied methods may allow discrimi-nation of essential patterns of neuronal loss following
References
hyperactivation of neurons from those artifactual details coupled to specific techniques or procedures.
[1] Y.R.J. Bureau, O. Peredery, M.A. Persinger, Concordance of
Although our measures of neuronal dropout were based
quantitative damage within the diencephalon and telencephalon
upon visual discrimination at 1003, the validity of this following systemic pilocarpine (380 mg / kg) or lithium (3 mEq / method was indicated by the strong correlation between kg) / pilocarpine (30 mg / kg) induced seizures, Brain Res. 648
(1994) 265–269.
actual counts of neurons at 10003 within a random
[2] Y.R.J. Bureau, M.A. Persinger, Transient blocking of persistent
sample of brains and the proportion of rats whose brains
gnawing by haloperidol in rats with seizure-induced multifocal brain
displayed this visible (at 1003) damage. Considering the
damage, Life Sci. 52 (1993) 869–876.
strength of this correlation, we suggest that the results of [3] D. Desjardins, M.A. Persinger, Association between intermale social the factor analyses of the 2-DG data from Handforth and aggression and cellular density within the central amygdaloid
Treiman and our measures of neuronal loss were valid, nucleus in rats with lithium / pilocarpine-induced seizures, Percept. Mot. Skill. 81 (1995) 635–641.
even as an exploratory procedure. These results indicated
[4] M.J. Dolleman-Van Der Weel, M.P. Witter, Different populations of
that those structures that will exhibit the most neuronal
neurons in the nucleus reuniens thalami project selectively to
dropout (as inferred in our studies) show the greatest distinct divisions of the rat hippocampal region, Eur. J. Morphol. 33 metabolic activity during the discrete seizures and waxing (1995) 198.
and waning seizures that begin about 30 min after the [5] A. Handforth, D.M. Treiman, Functional mapping of the early stages
14
of status epilepticus: a C-2-deoxyglucose study in
lithium–pilocar-injection of the pilocarpine. The more recent
measure-pine model in rat, Neuroscience 64 (4) (1995) 1057–1073.
ments [15] of c-fos expression (a marker of cellular
[6] A. Handforth, D.M. Treiman, Functional mapping of the late stages
hyperactivity) within the same structures that have shown of status epilepticus in the lithium–pilocarpine model in rat: a
14
the greatest 2-DG uptake and cell loss following induction C-2-deoxyglucose study, Neuroscience 64 (4) (1995) 1075–1089.
of status epilepticus by lithium and pilocarpine are con- [7] T. Harrigan, Y.R.J. Bureau, M.A. Persinger, G.H. Parker, Prevention of sudden cardiac death by the atypical neuroleptic acepromazine
sistent with this pattern.
following status epilepticus in rats, Life Sci. 54 (24) (1994) PL457–
That the amount of neuronal loss could be minimized
PL462.
was suggested by the correlation between the amount of [8] T. Harrigan, O. Peredery, M.A. Persinger, Radial maze learning neuronal dropout in structures distal to the entorhinal / deficits and mediodorsal thalamic damage in context of multifocal
piriform cortices and its subcortical nuclei and the time seizure-induced brain lesions, Behav. Neurosci. 105 (3) (1991) 482–486.
before the acepromazine was injected. However, even if
[9] M. Herkenhan, The connections of the nucleus reuniens thalami:
the acepromazine was injected at the time of the
observ-evidence for a direct thalamo–hippocampal pathway in the rat, J.
able onset of forelimb clonus and its electrical correlates, Comp. Neurol. 177 (1978) 589–610.
which usually emerge about 30 min after pilocarpine [10] M.P. Honchar, J.W. Olney, W.R. Sherman, Systemic cholinergic
injection [5,6], the cell losses within the piriform cortices agents induce seizures and brain damage in lithium-treated rats, Science 220 (1983) 323–325.
— CA1 — and midline thalamic nuclei were not
at-[11] G.F. Lafreniere, O. Peredery, M.A. Persinger, Progressive
accumu-tenuated. Whether or not prophylactic agents such as
lation of large aggregates of calcium-containing polysaccharides and
acepromazine and ketamine prevent the seizure from basophilic debris within specific thalamic nuclei after lithium / spreading from the piriform region to other areas or protect pilocarpine-induced seizures, Brain Res. Bull. 28 (1992) 825–830.
neurons in the acoustic thalamus that project to the amygdala, J. [21] M.A. Persinger, K. Makarec, J.-C. Bradley, Characteristics of limbic Neurosci. 10 (4) (1990) 1043–1054. seizures evoked by peripheral injections of lithium and pilocarpine, [13] A.J. McDonald, Organization of amygdaloid projections to the Physiol. Behav. 44 (1988) 27–37.
mediodorsal thalamus and prefrontal cortex: a fluorescence retro- [22] M.A. Persinger, O. Peredery, D. Desjardins, A. Eastman, Ventricular grade transport study in the rat, J. Comp. Neurol. 262 (1987) 46–58. dilatation over several weeks following induction of excitotoxic [14] D.C. McIntyre, J.R. Plant, Pyriform cortex involvement in kindling, (systemic lithium / pilocarpine) lesions: potential role of damage to Neurosci. Behav. Rev. 13 (1989) 277–280. the substantia nigra reticulata, Int. J. Neurosci. 94 (1998) 63–74. [15] J. Motte, M.J. da Silva Fernandes, T.Z. Baram, A. Nehlig, Spatial [23] W.A. Turski, E.A. Cavalheiro, M. Schwarz, S.J. Czuczwar, Z.
and temporal evolution of neuronal activation, stress and injury in Kleinrok, L. Turski, Limbic seizures produced by pilocarpine in rats: lithium-pilocarpine seizures in rats, Brain Res. 793 (1998) 61–72. behavioral, electroencephalographic and neuropathological study, [16] G. Paxinos, C. Watson, The Rat Brain in Stereotaxic Coordinates, Behav. Brain Res. 9 (1983) 315–335.
2nd Edition, Academic Press, Orlando, FL, 1986. [24] E.H.S. Vulpen, R.W.H. van Verwer, Organization of projections from [17] O. Peredery, M.A. Persinger, C. Blomme, G. Parker, Absence of the mediodorsal nucleus of the thalamus to the basolateral complex maternal behavior in rats with lithium / pilocarpine seizure-induced of the amygdala in the rat, Brain Res. Bull. 500 (1989) 389–394. brain damage: support of MacLean’s triune brain theory, Physiol. [25] N.Y. Walton, S. Gunawan, D.M. Treiman, Brain amino acid con-Behav. 52 (1992) 665–671. centration changes during status epilepticus induced by lithium and [18] M.A. Persinger, Degranulation of brain mast cells in young albino pilocarpine, Exp. Neurol. 108 (1990) 61–70.
rats, Behav. Neural Biol. 39 (1983) 299–306. [26] L.E. White, J.L. Price, The functional anatomy of limbic status
14
[19] M.A. Persinger, Y.R.J. Bureau, M. Kostakos, O. Peredery, H. Falter, epilepticus in the rat. I. Patterns of C-2-deoxyglucose uptake and Behaviors of rats with insidious, multifocal brain damage induced fos immunocytochemistry, J. Neurosci. 13 (11) (1993) 4787–4809. by seizures following single peripheral injections of lithium and [27] F.G. Wouterlood, E. Saldana, M.P. Witter, Projection from the pilocarpine, Physiol. Behav. 53 (1993) 849–866. nucleus reuniens thalami to the hippocampal region: light and [20] M.A. Persinger, Y.R.J. Bureau, O. Peredery, Dissociation between electron microscopic tracing study in the rat with the anterograde conditioned taste aversion and radial maze learning following tracer Phaseolus vulgaris-leucoagglutinin, J. Comp. Neurol. 296 seizure-induced multifocal brain damage: quantitative tests of serial (1990) 179–203.