SYNTHESIS AND CHARACTERIZATION OF TITANIA-RICE HUSK SILICA COMPOSITES AS
PHOTOCATALYST
Posman Manurung
1,*, Rudy Situmeang
2, Ediman Ginting
1, and Indra Pardede
1 1Department of Physics, Lampung University,
Jl. Sumantri Brojonegoro No. 1, Bandar Lampung 35145, Indonesia 2
Department of Chemistry, Lampung University,
Jl. Sumantri Brojonegoro No. 1, Bandar Lampung 35145, Indonesia
Received October 14, 2014; Accepted December 24, 2014
ABSTRACT
This article describes the synthesis of titania-silica composites by a sol-gel method using a mixture of silica of rice husk and titanium butoxide sols. Microstructures were examined at calcination temperature in the range of 500 to 700 °C, with temperatures interval of 50 °C. The sintered catalysts were subsequently tested for photodegradation of methylene blue (MB) under ultraviolet and sunlight rays. Physical characteristics were analyzed using X-ray diffraction (XRD), scanning electron microscopy (SEM)/energy dispersive X-ray spectroscopy (EDS), and Brunauer-Emmett-Teller (BET). The XRD results did not show the presence of silica crystal phase in each sample. The results showed that the highest BET surface area of samples was obtained at the temperature of 650 °C. In sample calcined 500 °C, the activity of the catalyst on MB was relatively similar in both sunlight and ultraviolet rays.
Keywords:rice husk silica; titania; photocatalysis; dye
ABSTRAK
Artikel ini membahas sintesis komposit titania-silika dengan metode sol-gel yang memakai campuran sol silika dari sekam padi dan titanium butoksida. Mikrostruktur diuji pada temperatur kalsinasi mulai 500 sampai dengan 700 °C dengan interval 50 °C. Bahan katalis yang telah disintering diujicobakan untuk proses fotodegradasi metil biru (MB) di bawah sinar matahari dan ultraviolet. Karakterisasi fisis dianalisis dengan difraksi sinar-X (XRD), mikroskop elekton (SEM)/spektroskopi sinar-X dispersi energi (EDS), dan Brunauer-Emmett-Teller (BET). Hasil XRD tidak menunujukkan kehadiran fasa kristal silika dalam sampel. Hasil menunjukkan bahwa luas permukaan BET tertinggi terdapat pada sampel yang dikalsinasi 650 °C. Pada sampel yg dikalsinasi 500 °C, aktivitas katalis pada fotodegradasi MB adalah relatif sama pada sinar matahari dan ultraviolet.
Kata Kunci:silika sekam padi; titania; fotokatalisis; zat warna
INTRODUCTION
Titania (TiO2) is a kind of transition metal functional oxide that attracted extensive studies as a photocatalyst. This material has the superior physical and chemical properties compared to other catalysts in terms of cost effectiveness, non-toxicness, and long-term stability. These properties make titania as an environmental-friendly photocatalysts [1]. The main usage of titania is used to decompose the toxin organic compound like dye from the textile industry [2]. The dye liquid pollutant flowing to the river without prior processing can influence the environmental health [3-4]. Generally, dye such as rhodamine-B, naphthol blue black, MB, and congo red [5] can be assumed as a long chain organic compound that makes it difficult to be decomposed with the conventional chemistry reaction.
The photoactivity of pure titania can degrade dye like MB using sunlight radiation as photon energy source [6]. The MB concentration was significantly decreased in one hour irradiation. In the photocatalysis degradation process, titania produces mineralization compound such as CO2, SO4
2-, NH4
+
and NO3
nitrogen [9], iodine [10], and Cr [11] to titania. Addition of 5% Ni/Ti revealed that the absorbance of sample increased from 342 to 350 nm [12]. Mahltig et al. [13] prepared TiO2/SiO2 coating agents for application of photocatalytic treatments and Jafry et al. [14] enhanced photocatalytic activity of P25 by silica addition.
Several factors can influence the photocatalytic property of titania-silica such as its crystalline, particle size, surface area, and dislocations on the surface [4,15]. The decreasing in particle size suppresed the recombination of electron photoexcitation, e-and hole, h+ [16-17] so that it photocatalytic property will increase.
Silica from rice husk can be used as a natural silica source for the synthesis of titania-silica composites [18-20]. This material was chosen because it is much cheaper than other oxides since this material is naturally available in large quantity. It is well known that rice husk contains active silica in high content around 87-97 wt% [21-22] which is smooth grain, and reactive. In addition, the availability of rice husk in our region was also the reason as a background to conduct this investigation.
In the previous investigation, mixing titania to silica was conducted by adding Na2SiO3 solution to titanium oxysulfate hydrate and results showed linkages between Si-O-Ti [23]. In the current investigation, the mixing of titania to rice husk silica was conducted by sol gel method where titanium butoxide was used as a source of titania.
In this paper, we present XRD results on the role of silica from rice husk mixture on the crystallization behavior and phase relations of TiO2in the temperature range 500-700 °C. The effect of temperature on the resultant microstructure, composition profile, and surfaces area is discussed by SEM, EDS, BET, and MB degradation by measurement of UV and visible (Vis) spectroscopies.
EXPERIMENTAL SECTION
Materials
Rice husk was obtained from local rice milling industry in Bandar Lampung, Ti(OC4H9)4 99% was
of 150 W from Osram was used to conduct the photocatalysis experiment. Lamp was put perpendicularly above sample at the distance of 30 cm.
Procedure
Preparation of silica sol from rice husk
Rice husk from local product of 100 g was rinsed carefully in fresh water and then immersed into hot water for 6 h. Floating husk was discharged and sinking part was collected, rinsed with distilled water, and then dried at 100 °C for 8 h. For the extraction experiment, an amount of 50 g of dry husk was transferred into a beaker glass and dissolved into 500 mL of KOH 5% (Merck). All materials were heated 100 °C for 30 m using an electric heater for obtaining optimal extraction. Then silica sol was filtered using Whatman paper and put into beaker glass. The extraction was kept for 24 h to obtain a homogeneous silica sol or Si(OH)4.
Synthesis of titania-silica
The synthesis of titania-silica nanocomposites was conducted by the sol-gel method. The molar ratio of titania to silica sols was 1:0.01. Titania sol was obtained from titanium butoxide, Ti(OC4H9)4 99% (Aldrich) with HCl 37% (Merck), and butanol (Merck) with the molar ratio of 1:0.2:4.2. All materials were stirred for 12 h at room temperature. Then silica sol was added to titania sol while stirring for 3 h until a gel was formed. The gel was aged for 24 h and then rinsed with water followed by heating at 120 °C for 12 h. The dried powder was calcined at 500, 550, 600, 650, and 700 °C for 10 h. Table 1 shows the samples in terms of calcination temperature.
Photocatalysis
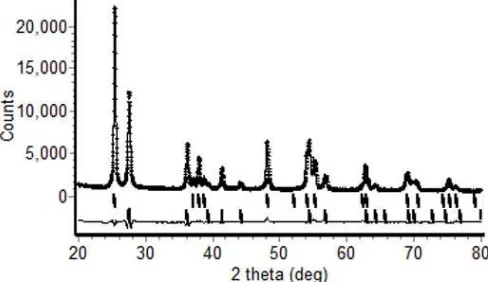
Fig 1. XRD patterns of titania-silica with varying calcination temperature. The wavelength of X-ray is 1.54056 Å. Legend: a = anatase and r = rutile
Fig 2. XRD profile for sample E at 700 °C. Measured and calculated patterns are indicated by crosses (black) and solid line, respectively. Intensity differences between the two patterns are shown along the bottom of the plot. Vertical bars represent the allowable peak position for each of the phases (from top to bottom: anatase and rutile)
Table 2.The weight percentage of samples
Sample Anatase (wt%) Rutile (wt%)
A
into solution and stirred under UV and sunlight rays respectively. The data for sunlight ray were collected when the position of sun is between 11 to 13 o’clock and the weather was very bright. The solution of 20 mL was taken from beaker glass every 10 min for examining the decolorization of MB. The concentration of MB was periodically analyzed by both of UV and Vis rays.
RESULT AND DISCUSSION
Qualitative and Quantitative Analyses of Composites
Fig. 1 shows the XRD patterns of titania-silica samples prepared at the molar ratio of 1:0.01 and calcined at 500-700 °C for 10 h. Qualitative analysis shows that the major diffraction peaks are consistent with the JCPDS file No. 21-1276 for rutile [24] and JCPDS file No. 21-1272 for anatase [25]. For quantitative analysis in counting wt% of anatase and rutile, the data was analyzed using Rietveld method. Model used for analyzing anatase is [26] while for rutile is [27]. Software used for this purpose is Rietica [28]. A typical Rietveld profile fit for XRD data at 700 °C is shown in Fig. 2. The good refinement quality of diffraction data can be discerned with the acceptable fitting parameters ofRp = 4.7;Rwp = 6.3;Rexp= 2.6; =
5.8;RB (anatase) = 2.5 and RB (rutile) = 1.8. Small RB values may indicate that the refinement process is reasonable enough. The composition of samples according to Rietveld analysis was compiled in Table 2. Table 2 shows that rutile formation commenced at 500 °C and increased gradually with the increase of calcination temperature. On the other hand anatase phase decreased with the increase of temperature. It is well known that the formation temperature of anatase is lower than rutile phases [29]. Beside temperature, the doping can also influence the formation temperature of anatase and rutile phases [30]. However, in our case, the addition of 10% of rice husk silica did not affect the formation temperature of rutile phase. The different evidence is happened when the addition of silica into TiO2 is in a large quantity. Silica can inhibit the formation rutile by impeding direct contact between TiO2 particle with forming the Ti-O-Si binding [8]. The same phenomenon was also observed on Cr-doped nano-titania in argon [31] where rutile phase is dominant after temperature above 900 °C. The use of SiO2 for TiO2 matrix of 50% will reduce the anatase phases and forming amorphous TiO2-SiO2. This can happen because the formation of Si-O network by the excess of SiO2can block the formation of anatase [32]. In this investigation, rice husk silica cannot prohibit the growth of rutile even at 500 °C. It is interesting to note that there is no silica phase present in all samples as its formation temperature occurred above 900 °C [33]. It is believed that the presence of silica compound really exists based on EDS picture of sample B that the result was compiled in Table 3.
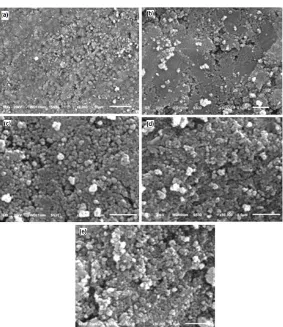
Fig 3.SEM images of samples with various calcined temperatures: (a) sample A at 500; (b) B at 550; (c) C at 600; (d) D at 650; and (e) E at 700 °C
Table 3.Compound of sample B calcined at 550 °C
Compound % mol % mass
SiO2
TiO2
8.19 91.81
1.27 10.73
silica compounds on sample B contains 8.19 and 91.81%. It is interesting to note that there are no other elements or compounds other than Ti, Si and O can be traced in the samples. This implies that the procedure in preparing titania-rice husk silica meets the requirements of good processing experiment. The presence of both Ti and Si elements can be also confirmed by the relation of energy and wavelength of Kα for Ti (4.508 KeV = 2.74841 Å) and (1.739 KeV = 7.12528 Å) for Si [34].
Microstructure of Samples
Fig. 3 shows SEM characterization of titania-rice husk silica at various temperatures. These images clearly show distinct contrast in microstructures in composites prepared at different temperatures. This indicates that the temperature can lead to a significant change in the microstructures of titania-rice husk silica composites.
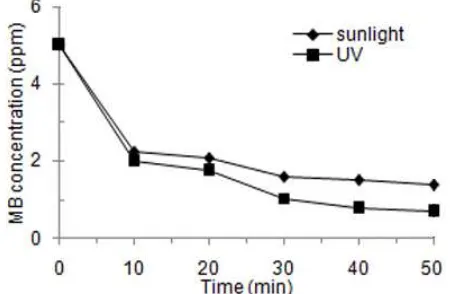
Fig 4. Decreasing MB concentration as a function of time under UV and Vis rays at 500 °C (sample A)
Fig 5. Decreasing MB concentration as a function of time under UV and Vis rays at 550 °C (sample B)
Table 4. Measurement of surface area by BET
Sample Surface area (m2/g)
A
Table 4 shows the BET characterization titania-rice husk silica with molar ratio of 1:0.01 in different calcinations temperatures. The surface area of titania-rice husk silica samples was varied as calcination temperature. The lowest surface area was found for sample C and the highest one in sample D. Initially surface area decreases with increase of calcination temperature and then increases after heating samples to 650 and 700 °C. On the other hand, at these temperatures, the weight percentage of rutile is more than anatase. The presence of more rutile influences to surface area of sample. Pillai et al. [36] reported that the surface area of TiO2prepared from titanium isopropoxide in isopropanol solution and calcined at 500 °C is 38 m2/g. The surface area of the current investigation is higher than reported above. The presence of rice husk silica probably influences the surface area of sample by suppressing the growth and agglomeration of TiO2 crystals [23]. The particle size can influence the surface area where surface area increases with a decrease of particle size [37].
Photodegradation of MB
Degradation of MB using the powder of titania-rice husk silica calcined at different temperature was observed at wavelength of 664 nm. Titania-rice husk silica and MB were activated under UV and sunlight irradiation. Figs. 4 and 5 show the reduction of MB concentration against time in minutes.
In Fig. 4, the concentration of MB is significantly reduced from 5 ppm to less than 1 ppm in just 50 min irradiation. It is interesting to note that even in the first 10 min activation, the MB concentration was dramatically reduced to around 20% both under UV and sunlight irradiation. This behavior is probably caused by the decreasing of gap energy (Eg) of TiO2 after combining with rice husk silica. It is well known that the lower the Eg of TiO2 the better its photocatalysis performance. The good agreement using either UV or sunlight irradiation inspires our research group to investigate in further the degradation of MB under visible light. However, with increase of calcination temperature the ability of photocatalysis to reduce the MB concentration was decreased to 40% (Fig. 5). This phenomenon can be explained using research reported by Yanagisawa and Ovenstone [38] stated that the anatase phase is more active than rutile. On the other hand, Ali et al. [39] reported that the larger surface area of a sample the more its photocatalysis activity. Furthermore, Fajriati et al. [40] also reported that the decolorization of methylene orange increased with smaller TiO2-chitosan particles size. But in this sample, the presence of anatase phase is more dominant than surface area factor.
CONCLUSION
ACKNOWLEDGEMENT
The present work was supported by the Directorate of Higher Education (DIKTI) Indonesia through Hibah BersaingGrant (No. 389/UN26/8/PL/2013).
REFERENCES
1. Rong, L., Dao, L.N.S., and Chang, W.H., 2006,Chin. Chem. Lett., 17(8), 1089–1096.
2. Cani, D., and Pescarmona, P.P., 2012, J. Catal., 311, 404–411.
3. Yuan, S., Sheng, Q., Zhang, J., Yamashita, H., and He, D., 2008, Microporous Mesoporous Mater., 110(2-3), 501–507.
4. Cetinkaya, T.,Neuwirthová, Lucie K.,Kutláková, M., Tomášek, V.,and Akbulut,H., 2013,Appl. Surf. Sci., 279, 384–390.
5. Chen, X., and Mao, S.S., 2007,Chem. Rev., 107(7), 2891–2959.
6. Nogueria, R.F.P., and Jardim, W.F., 1993,J. Chem. Educ., 70, 861–862.
7. Houas, A., Lachheb, H., Ksibi, M., Elaloui, E., Guillard, C., and Herrmann, J-M., 2001,Appl. Catal., B, 31(2), 145–157.
8. Cheng, P., Zheng, M., Jin, Y., Huang, Q., and Gu, M., 2013,Mater. Lett., 57(20), 2989–2994.
9. Mrowetz, M., Balcerski, W., Colussi, A.J., and Hoffmann, M.R., 2004, J. Phys. Chem. B, 108(45), 17269–17273.
10. Tojo, S., Tachikawa, T., Fujitsuka, M., and Majima, T., 2008,J. Phys. Chem. C, 112(38), 14948–14954. 11. Ameta, A., Bhati, I., Ameta, R., and Ameta, S.C.,
2010,Indones. J. Chem., 10(1), 20–25.
12. Hermawan, P., Pranowo, H.D., and Kartini, I., 2011, Indones. J. Chem., 11(2), 135–139.
13. Mahltig, B., Gutmann, E., and Meyer, D.C., 2011, Mater. Chem. Phys., 127(1-2), 285–291.
14. Jafry, H.R., Liga, M.V., Li, Q., and Barron, A.R., 2011,Environ. Sci. Technol., 45(4), 1563–1568. 15. Chen, K.Y., and Chen, C.S., 2011,J. North. Taiwan,
34, 16–24.
21. Daifullah, A.A.M., Awwad, N.S., and El-Reefy, S.A., 2004,Chem. Eng. Process., 43(2), 193–201. 22. Yalçin, N., and Sevinç, V., 2001,Ceram. Int., 27(2),
219–224.
23. Krivtsov, I.V., Ilkaeva, M.V., Samokhina, V.D., Avdin, V.V., Khainakov, S.A., Uchaev, D.A., and Garcia, J.R., 2013, J. Sol-Gel Sci. Technol., 67, 665–669.
24. Swanson,H.E., and Tatge, E.,1953,U.S. Nat. Bur. Stds.Circular, 539(1), 46–47.
25. Swanson,H.E., and Tatge, E.,1953,U.S. Nat. Bur. Stds.Circular, 539 (1), 44–46.
26. Djerdj, I., and Tonejc, A.M., 2006, J. Alloys Compd., 413(1-2), 159–174.
27. Howard, C.J., Sabine, T.M., and Dickson, F., 1991, Acta Crystallogr., Sect. B: Struct. Sci., B47, 462– 468.
28. Hunter, B.A., 1997, Rietica for 95/98/NT Version 1.71.
29. Bakardjieva, S., Stengl, V., Szatmary, L., Subrt, J., Lukac, J., Murafa, N., Niznansky, D., Cizek, K., Jirkovsky, J., and Petrova, N., 2006, J. Mater. Chem., 16, 1709–1716.
30. Kim, T.K., Lee, M.N., Lee, S.H., Park, Y.C., Jung, C.K., and Boo, J.H., 2005,Thin Solid Films, 475(1-2), 171–177.
31. Low, I.M., Albetran, H., Prida, V.M., Vega, V., Manurung, P., and Ionescu, M., 2013, J. Mater. Res., 28(3), 304–312.
32. Im, H-J., Park, K.K., and Jung, E.C., 2012, Nanoscale Res. Lett., 7, 51–57.
33. Cho, S-B., Nakanishi, K., Kokubo, T., Soga, N., Ohtsuki, C., Nakamura, T., Kitsugi, T., and Yamamuro, T., 1995, J. Am. Ceram. Soc., 78(7), 1769–1774.
34. Bearden, J.A., 1967,Rev. Mod. Phys., 39, 7–124. 35. Cullity, B.D., 1978, Elements of X-ray Diffraction,
Addison-Wesley Publishing Company, Inc. New Jersey, USA, 84, 102.
37. Kim, S.S., Chang, H., Cho, K., Kil, D.S., Jang, H.D., Choi, J-W., and Choi, J., 2011, Mater. Lett., 65(21-22), 3330–3332.
38. Yanagisawa, K., and Ovenstone, J., 1999, Phys. Chem. B,103(37), 7781–7787.
39. Ali, M., Behnajady, M.A., and Naser, M., 2010, Indian J. Chem., 49A, 1953–1600.