| 77 E-ISSN: 2355-6544
http://ejournal.undip.ac.id/index.php/geoplanning doi: 10.14710/geoplanning.3.1.77-86
MONITORING THE LAND USE CHANGE IN CAMPUS 2 STKIP PGRI PONTIANAK
A. Purwantoa, G. Bayuardia
a.
IKIP PGRI Pontianak, Indonesia
Abstract: The aims of the research are: 1) investigating the changes of land-use occurring at campus 2 of STKIP PGRI Pontianak, 2) determining the tendency towards changes of land-use at campus 2 of STKIP PGRI Pontianak and, 3) mapping the land-use change at campus 2 of STKIP PGRI Pontianak from 2003 to 2011. The methods used in this research were survey and interpretation of the image of a multiple-color composite in 2003, 2008 and 2011 using GIS software. The data used were the types of land-use and the width of land-use change area. The data were analyzed by overlay method. The results have shown the following: 1) The changes of land use have been largely from forest land and paddy fields to settlement area; 2) The trend of the change is approaching to the North side, East side, South side and West side of the campus; 3) The characteristics of the extension of land-use changes from 2003 to 2011 are: settlement increased 66,110 m2, field service (restaurant) became 10,254 m2, the fields had added 17,097 m2, paddy field had decreased 25,211 m2, the forest area had decreased 104,327 m2 and educational facilities had increased 35,427 m2 while police station had extended 650 m2.
Copyright © 2016 GJGP-UNDIP This open access article is distributed under a Creative Commons Attribution (CC-BY-NC-SA) 4.0 International license.
How to cite (APA 6th Style):
Purwanto, A. and Bayuardi, G. (2016). Monitoring the land use change in Campus 2 STKIP PGRI Pontianak. Geoplanning: Journal of Geomatics and Planning, 3(1), 77-86. doi:10.14710/geoplanning.3.1.77-86
1.
INTRODUCTION
Land use change is basically a transition from a certain purpose in using land to another. Changes in land use can be a reflection of an area experiencing growth, especially in the growing of physical infrastructure in the form of economic infrastructure, roads and others. In land use development, changes should be distributed in certain places that have good potential. Thus, monitoring, data collection and mapping land use change are very important to comprehend the changes. One of the tools that can be used for the puspose is Remote Sensing-Geographic Information System (RS-GIS).
Studies on land use change have been developing during the recent years with a variety of methods and cases. Several recent studies indicate a strengthening of land-use change identification method by utilizing the technology of remote sensing and geographic information system. In China the study of land use changes on the value of land use spatio temporal GIS techniques were conducted in 1992, 1996, 2001, 2004 and 2008 (Du et al., 2014). They were able to produce patterns of land, thereby, increasing the efficiency of the investment value of the land. Still in China, in Yucheng City of Shandong Province, the study of changes in land use in rural areas is becoming one of the alternatives to see policy changes in land use and land ownership. The study used comparative methods of spatial land use by using map results of image interpretation (Liu et al., 2014).
In Slovakia, similar studies using the spatio temporal GIS technique and remote sensing also obtain significant results about the patterns of land use change. The importance of the findings in Slovakia can actually help in seeing the history of land use patterns in three different time periods, namely Monarchy era, revolutionary era, and the present (Kanianska et al., 2014). The studies are interesting to be replicated by adopting the pattern and methods of remote sensing and geographic information system especially to see the dynamics of land use change. RS-GIS is a precise and accurate tool to provide information about the
78 |
spatial distribution of land use change covering a wide area. Past studies carried out by organizations and institutions around the world have been concentrating on the application of RS-GIS for analyzing and evaluating the land use change. Geographical Information System provides flexible facilities for collecting, storing, displaying and analyzing digital data which is required for the detection of changes in land use (Reis, 2008).
Land use is dynamic, it will change in accordance with the increase of population, social and economic activities. Rapid population growth will have implications to the increased need for space to conduct various activities manifested in the land uses. Meanwhile, to meet the needs of the land, there are limitations occur in local, physical, geographical, and the ability of governments to provide infrastructure and land use policy instruments. Land use policy becomes an interesting subject for discussion in developing countries like Indonesia. Unclear conditions pushes the need for clear monitoring system (Mialhe et al., 2015) clear policy direction (Zimmermann et al., 2016), and the clear rule of land transition (Romo-Leon et al., 2014). Sumaatmadja (1988) outlined changes in land use is influenced by the attractiveness of the place, such as: 1) the larger amounts of land available in expansion area, 2) low prices of land in expansion area, so it encourage residents to live in the area, 3) a more pleasant atmosphere, especially in the division still has environmental conditions that are free from all kinds of pollution, 4) are likely to take their education outside of town, 5) approaching the workplace.
Urban population growth due to natural growth and migration also has implications for the growing population pressure on urban land because of the land requirement for residential activities and other supporting increasing facilities. It becomes a big challenge for planners, city managers and the residents themselves. Therefore, this study aims to: 1) determine land use changes occur at campus 2 STKIP PGRI Pontianak, 2) know the trend towards land use change at campus 2 STKIP PGRI Pontianak and 3) to map the area of land use change from 2003 to 2011. Study for the development of the campus land use has also been done in Purwokerto (Munggiarti & Buchori, 2015) and Bandung (Wijaya, 2015). University campus is a strategic area where the dynamics of economic growth affect the use of land. The increasing number of students, along with the related facilities, will create change in both the structure and spatial patterns.
In 2003 to 2011, the area of Campus 2 STKIP PGRI Pontianak has been as urban expansion area of southern Pontianak part that has been developing quite rapidly. The number of buildings is growing comprising the lecture buildings, settlements ones, buildings for businesses and others, showing the dynamics of land use change in the campus area.
2.
DATA AND METHODS
The methods used to see the changes in land use were the remote sensing and remote sensing temporal data (Du et al., 2014; Kanianska et al., 2014; Lillesand et al., 2014; Liu et al., 2014; Munggiarti & Buchori, 2015; Wijaya, 2015). The data used in this study were multi-color composite images taken from Google Earth with multi-years of 2003, 2008 and 2011. The method used in this study was a survey of image interpretation and checks. Mechanical research was done in several stages as described below.
2.1 The Preparatory Stage
The first was a study of literature, magazines and brochures associated with the object of research. The study was used to supplement the theories related to the study of land use change. Second, a composite image of a multi-year available from 2003, 2008 and 2011 was done. These data were used to determine land-use change periodically over the next eight years. The third was to set up a map of West Pontianak sub-district administration, to determine the areas experiencing land use change. The fourth was to set up additional equipment used for image interpretation process.
2.2 The Interpretation Stage
| 79 interpretation process (Sutanto, 1998). Selection or determination of GCP (Ground Control Point), with data analysis used in this study was the interpretation of using the keys of interpretation, identification of the development direction pattern and overlaying the images of Composite multi-years of 2003, 2008 and 2011. The study framework can be seen in Figure 1 and the study area in Figure 2.
80 |
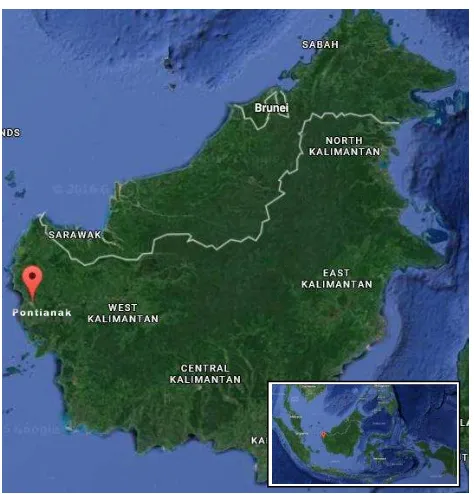
Figure 2. The study area, Pontianak, West Borneo (Google Map, 2015)
3.
RESULTS AND DISCUSSION
3.1 Land Use in 2003
Interpretation of satellite image in 2003 was done to make land use map of campus 2 STKIP. Elements of interpretation were used as a reference in determining the land cover in the process of image interpretation. Determination of the land use map unit was done by classification method, it means that mapping unit of the territory into smaller units groupings based on physical unit that can be observed from the image. Block boundary was determined based on clear and unequivocal limits in the form of major roads that were visually observed.
Based on the interpretation of color composite image from Google Earth 2003 the land use at campus 2 STKIP PGRI Pontianak consists of forest, settlement, wetland, paddy field, and restaurants. It can be seen in
Figure 3. Based on the satellite image interpretation, it is known that the most extensive land use is forest land, which has an area of 962,458 m2 or 77.71 % of the total area of the mapped region. On the other hand, the smallest use was for restaurant, which was only 1,550 m2 or 0.10 %. The results are shown in
Table 1 and Figure 4.
Table 1. STKIP land use in 2003 (Analysis, 2015)
Land use Area (m2) %
1. Settlement 32,337 2.61
2. Service:
- Restaurant 1,550 0.10
3. Agriculture:
- Paddy field 78, 698 6.35
- Wetland 143,985 11.62
4. Forest 962,458 77.71
5. Others
- Grass 14,877 1.20
- Road 4,696 0.38
| 81
Figure 3. STKIP land cover satellite imagery in 2003 (Google Earth, 2003)
82 |
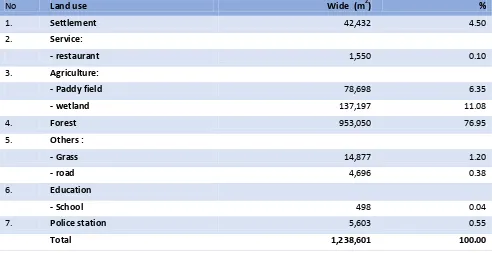
3.2 Land Use in 2008
Based on the color composite image of Google Earth in 2008, the land use has undergone a variety of changes, such as for settlement, schools, paddy fields and the police station as can be seen in Figure 5. The most extensive land use was still the forest. However, the forest was reduced by 9,408 m2 or 0.76% to 953,050 m2 or 76.95% of the total area being mapped. The smallest land use was for school, which was only 498 m2 (0.04 %). In details, the interpretation results are shown in Table 2.
Figure 5. STKIP land cover satellite imagery in 2008 (Google Earth, 2008)
Table 2. STKIP land use area in 2008 (Analysis, 2015)
No Land use Wide (m2) %
1. Settlement 42,432 4.50
2. Service:
- restaurant 1,550 0.10
3. Agriculture:
- Paddy field 78,698 6.35
- wetland 137,197 11.08
4. Forest 953,050 76.95
5. Others :
- Grass 14,877 1.20
- road 4,696 0.38
6. Education
- School 498 0.04
7. Police station 5,603 0.55
| 83
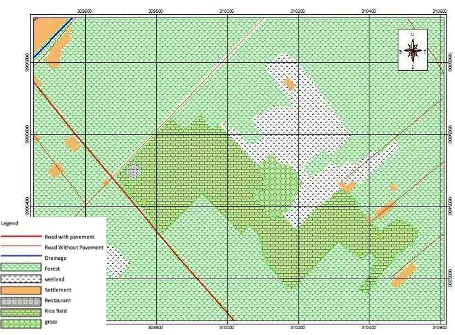
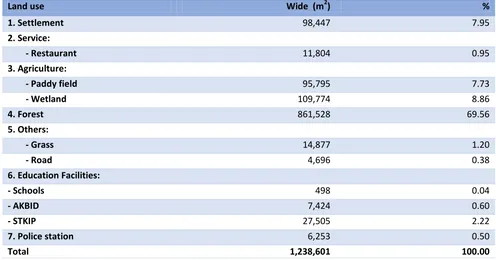
3.3 Land Use in 2011
In 2011, the land use around campus 2 STKIP PGRI Pontianak was classified into settlements, restaurants, farm comprising fields and paddy fields, forest, grass, educational facilities and police stations, the uses of the land can be seen in Figure 6. Based on the interpretation it is known that the most extensive use was still for forest land. However, it experienced a reduction again from originally 953,050 m2 (77.62%) in 2008 to 861,528 m2 (68.71%). This reduction was 104,327 m2 or 8.42% of the total area being mapped. The smallest land use was for schools, which was only 498 m2 (0.04%). The interpretation results can be seen in Figure 7 and Table 3.
Figure 6. STKIP land cover satellite imagery in 2011 (Google Earth, 2011)
84 |
Table 3. STKIP land use area in 2011 (Analysis, 2015)
Land use Wide (m2) %
3.4 Changes in Land Use in the Area of Campus 2 STKIP PGRI Pontianak
Changes in land use in fact are complicated as can be seen from the various types of use and extensive changes to the various uses. So it is necessary to be able to know clearly about the change per unit of land use. The following describes the types of land use and the changes (see Table 4). The results of the imagery interpretation of 2003, 2008 and 2011 show that the land use in the area of Campus 2 STKIP PGRI Pontianak was increasingly varied and complex. The number of units of land use has increased, especially the blocks of land for settlement while experiencing a reduction in forests and fields. The decrease of forest and field areas was due to conversion to settlement, restaurants, educational facilities (schools, Academy of Midwifery, STKIP) and the Police stations.
The pattern of land use settlement is a manifestation of the people’s activities to utilize the land in order to meet their needs. The use of land for settlements in the study area is ranked at the top in terms of its expansion, and it is also the most extensive change. The high intensity and the change in scale are widely associated with the development or population intervention that is relatively high in the study area. The use of land for settlements was around 32,337 m2 in 2003, and then increased sharply to 101,346 m2 in 2011, meaning that the expansion of settlements was as much as 66,110 m2 or 5.34%. Many of the new settlements occupy the agricultural land and forest.
This development is unfortunate given that the agricultural land in the study area is very fertile . For the foreseeable future, the remaining agricultural land should be used as urban agricultural land, so that the urban community's food dependency on the supply of the hinterland or the surrounding countryside can be reduced and at the same time can improve the housing environment ecologically.
| 85
Table 4. Land use change in the area of STKIP in 2003-2011 (Analysis, 2015)
Land use Area (m2)
Further conversion of agricultural land and forest to settlement use should be avoided. However, it can be allowed for non-conservation forest. It is intended that the agricultural land can keep producing appropriately to ensure food security. Concentration of land conversion in certain areas will lead to the unequal distribution of various fasilities both socially and economically. So, further land use conversion should be directed to cropland and for non built-up uses only.
5.
ACKNOWLEDGMENTS
The author(s) would like to thank the Directorate of Research and Community Services of the Ministry of Research, Technology and Higher Education for funding this research through the scheme of Young Researchers Grant in 2015.
6.
REFERENCES
Du, J., et. al. (2014). Urban land market and land-use changes in post-reform China: A case study of Beijing.
Landscape and Urban Planning, 124, 118–128.
Kanianska, R., et. al. (2014). Land-use and land-cover changes in rural areas during different political systems: A case study of Slovakia from 1782 to 2006. Land Use Policy, 36, 554–566.
Lillesand, T., et. al. (2014). Remote sensing and image interpretation. John Wiley & Sons.
Liu, Y., et. al. (2014). Implications of land-use change in rural China: A case study of Yucheng, Shandong province. Land Use Policy, 40, 111–118.
Mialhe, F., et. al. (2015). Monitoring land-use change by combining participatory land-use maps with standard remote sensing techniques: showcase from a remote forest catchment on Mindanao, Philippines. International Journal of Applied Earth Observation and Geoinformation, 36, 69–82.
Munggiarti, A., & Buchori, I. (2015). Pengaruh keberadaan perguruan tinggi terhadap perubahan morfologi kawasan sekitarnya. Geoplanning: Journal of Geomatics and Planning, 2(1), 51–68.
86 |
Romo-Leon, J. R., et. al. (2014). Using remote sensing tools to assess land use transitions in unsustainable arid agro-ecosystems. Journal of Arid Environments, 106, 27–35.
Sumaatmadja, N. (1988). Studi geografi suatu pendekatan dan analisa keruangan. Bandung: Alumni. Sutanto. (1998). Penginderaan jauh, Jilid I. Fakultas Geografi Universitas Gadjah Mada.
Wijaya, N. (2015). Deteksi perubahan penggunaan lahan dengan citra landsat dan sistem informasi geografis: studi kasus di Wilayah Metropolitan Bandung, Indonesia. Geoplanning: Journal of
Geomatics and Planning, 2(2), 82–92.
Zimmermann, J., et. al. (2016). Assessing land-use history for reporting on cropland dynamics—A comparison between the Land-Parcel Identification System and traditional inter-annual approaches.