| 23 http://ejournal.undip.ac.id/index.php/geoplanning
doi: 10.14710/geoplanning.3.1.23-32.
LAND USE CHANGE IN SUBURBAN AREA: A CASE OF MALANG CITY,
EAST JAVA PROVINCE
S. N. Rukmanaa, I. Rudiartob
a PGRI Adibuana University, Surabaya, Indonesia b
Diponegoro University, Indonesia
Abstract: The development of suburban areas of Malang City has developed an expansion of built-up areas between urban and suburban areas. There has been a great phenomenon that mostly occurs along the suburban areas where industrial activities took place. This study aims to determine what factors have influenced the land use change i the su ur a areas of Mala g City y e ployi g GeoDa appli atio . It is one of the Geographical Information System applications that particularly deals with statistical analysis. To achieve this purpose, the objectives are: delineating the study area, analyzing the characteristics of land use change, assessing and analyzing the variable influencing the land use change. The results have shown that the characteristics of land use change, such as population, distance, migration, and occupation transformation are directly proportional to the land use change. It has also been identified that the high level of density is only located in the surrounding areas of industries. From the assessed variables through the statistical model, population (X1), density (X2) and migration (X3) are found as the influencing factors of land use change.
Copyright © 2016 GJGP-UNDIP This open access article is distributed under a Creative Commons Attribution (CC-BY-NC-SA) 4.0 International license.
How to cite (APA 6th Style):
Rukmana, S. N. & Rudiarto, I. (2016). Land use change in suburban area: a case of Malang City, East Java Province. Geoplanning: Journal of Geomatics and Planning, 3(1), 23-32. doi:10.14710/geoplanning.3.1.23-32
1.
INTRODUCTION
Land use change in peri-urban area is one of the impacts of urbanization process where urban activities expand (Arta & Pigawati, 2015; Ives & Kendal, 2013; Paül & McKenzie, 2013; Shi, Sun, Zhu, Li, & Mei, 2012). This issue has become one of the most interesting subjects to be studied particularly in developing countries. One of the prominent factors in land use change is population growth. UN-HABITAT (2005) reported that i 95 Asia’s ur a populatio as a out illio or a out 7% of the total population, and in 2005 it increased up to 40%. The distribution of population within and between cities, regions and nations is influenced further by certain migration patterns because the city as a generator region provides complete facilities, vacancies, and other attracting forces such as industry, education, etc. Therefore, the high rate of migration living in urban area can lead to uncontrolled land needs, and it will in turn affect the land use change in the future.
In the context of land use change, many of it were caused by urban development located in suburban areas. As Webster & Muller (2009) mentioned, peri-urban zone begins just beyond the contiguous built up area and sometimes extends as far as 150 km from the core city. It has positive and negative impacts. One of the positive impacts is the creation of new job for people living in suburban areas, for example as industrial labors. On the other hand, the negative impacts can be related to the quality of land use in terms of the economic aspect (Phuc, Van Westen, & Zoomers, 2014; Zhang et al., 2015). It means that when the quality of agriculture decreases, the tendency of farmers to sell their agriculture land is high (Kangalawe, Christiansson, & Östberg, 2008). Through the process of land conversion, agricultural land is converted into
24 |
more productive land such as settlements, industry, etc., and creates transformation of the occupation from farmers to labors (McGee, 1991). Malang is one of the regions that has such experience from 1990 to 2011. Malang has promoted expansion urban areas that caused land use change. In addition, the presence of industrial activities also creates a high in-migration flow. Thus, the impact of this phenomenon is occupation transformation.
This article elaborates some influencing factors that contributed to land use change and its impacts on occupation transformation. Some studies have been conducted to assess land use change from different perspectives and approaches such as physical and socio-economic aspects. The urbanization process also has an impact on the reduction of agricultural land use through the enlargement of residential and industrial areas (Guan et al., 2011; Su, Jiang, Zhang, & Zhang, 2011). They used physical aspects to measure the relationships between land use change and urbanization process. These aspects are total area, patch density, parameter area ratio distribution, Euclidian nearest neighbor distance, and aggregation index. In addition, patch numbers and patch areas of a built-up land are still increasing and showing the diffused distribution patterns from an urban center to suburban region (Guan et al., 2011). Both studies measured tra sfor atio of agri ultural la ds apes u der rapid ur a izatio y applyi g Glo al Mora ’s I statistics and Local Indicators of Spatial Association (LISA) analysis.
2.
DATA AND METHODS
2.1 Data
This research used data collected from different sources. The data is related to the physical and social aspects and divided into two purposes as shown in Table 1.
Table 1. The Data (Authors, 2015)
Data and information Sources
Delineation of study area: initial urban and rural status, density, accessibility and built up area.
Basic Village Data (Podes), CBS (2010-2012), Spatial Planning of Malang City (2010-2012)
Assessing the influence of land use change;
Population
This research used quantitative approach in analyzing the factors influencing land use change as well as scoring method to delineate the study area. Scoring method was applied in order to delineate study area into a more realistic condition. The analysis itself was conducted into two types, i.e., descriptive and spatial statistical analyses.
a) Descriptive analysis was applied for:
(1) Delineating the study area based on scoring in each criteria (i.e. the percentage of built up area and road level)
| 25 n
Range
b) Spatial Statistical Analysis
Spatial multiple regressions analysis was employed through Open GeoDa and ArcGIS 9.3 software. The regression analysis was divided into two processes, i.e., simple linear regression and spatial regression. The spatial regression analysis can be continued if the value of Lagrange Multiplier (LM) Lag and LM error in simple linear regression is less than 0.05. Spatial regression in this analysis was based on the following rules. Spatial weight describes the model of spatial interaction between a polygon and another polygon. It can be used to analyze total villages of the study area that have been influenced and to be included in the model formula. The output of this model can be visualized as follows:
Y = A.W+B+ a.X1+ b.X2+ c.X3+d.X3+ e.X4+ f.X5
+…
where:
Y = Land use changes A = Lambda
W = spatial weight (Queen Contiguity) B = constants
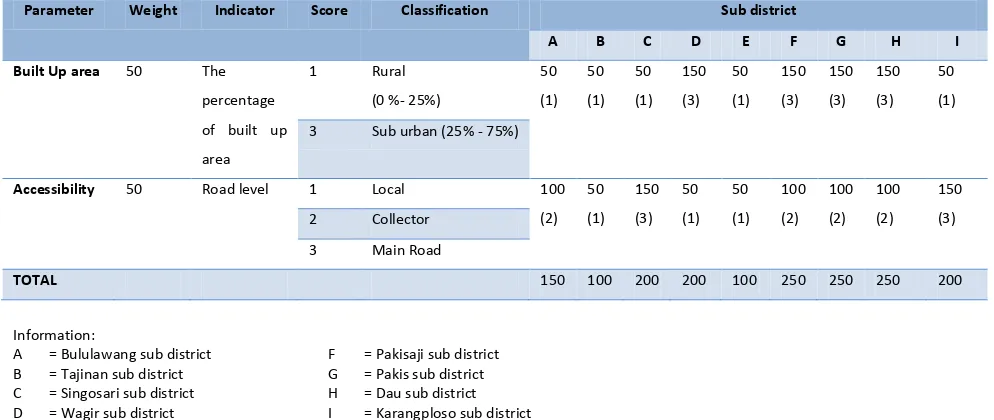
The process of delineating suburban area was done by collecting initial data. There are two criteria to assess suburban area, i.e., total built up area and road level or accessibility. These criteria were applied to each village in the study area by using scoring and then summarizing them into the final weights (see Table 2).
Table 2.Total of Delineation Area (Analysis, 2015)
Parameter Weight Indicator Score Classification Sub district
A B C D E F G H I
The range of the class can be calculated as follows:
p = Range = the highest data – the lowest data
26 |
p = 250 - 100 = 75 2
Based on the formula, the class intervals in terms of classification zone were (1) Rural = 100-175; (2) Suburban = 176 – 250.
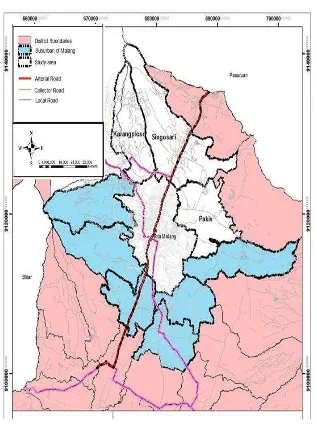
Based on the overall analysis above, the delineation area is located in the northern part of Malang City (Singosari, Karangploso, and Pakis) as shown in Figure 1. It is reasonable since those three sub districts are industrial area for different products such as tobacco and furniture. In addition, it is also recognized from the physical appearance that these three sub districts have strategic location and accessibility (Malang-Surabaya) and hence, the tendency of land conversion is quite high.
Figure 1. Delineation Map (Analysis, 2015)
3.2 Characteristics of Land Use Change
| 27 a) Population
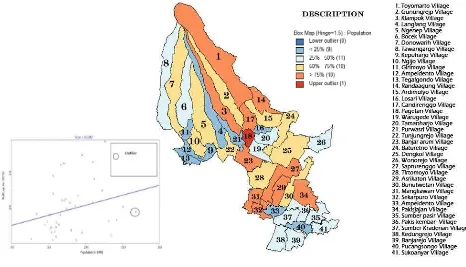
Lynch (2005) mentioned that the rapid population of third world cities raises concerns on the changing nature of the relationships between urban and rural area. Malang is one of the cities that have such experience of population growth. Based on the analysis, the highest population percentage was found in Pangentan Village-Singosari Sub-districts. High population concentration in these areas is merely because of two factors, i.e., location of furniture industries and major access from Malang to Surabaya. Box map analysis was applied to show the relation between population and land use change. As shown in Figure 2, the population variable is directly correlated to land use change, which means high population level will affect land use change in the suburban of Malang.
Figure 2. Scatter Plot and Box Map Analysis of Population (Analysis, 2015)
b) Density
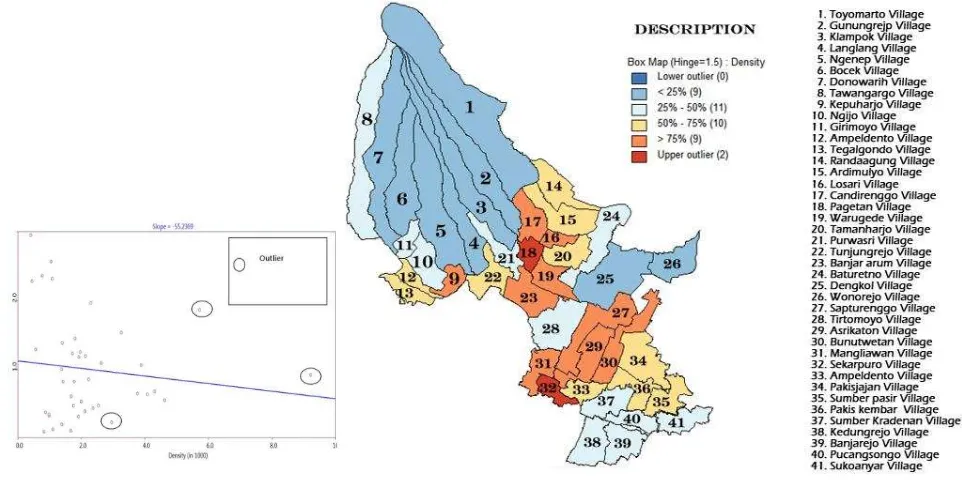
Density is one of the drivers of urbanization process where it may indicate that the built up area is growing (Knox & McCarthy, 1994). It is also relevant to Malang City. High density areas are found in some parts of the city particularly in the industrial area. Population and density are two aspects directly correlated to the urbanization process. High population concentration will influence the level of density. Based on the analysis, it is indicated that the highest density is located in Pangentan Village-Singosari Sub-districts as well as Sekarpuro village of Pakis Sub-district. In those sub-Sub-districts, agriculture and furniture industries are dominant.
28 |
Figure 3. Scatter Plot and Box Map Analysis of Density (Analysis, 2015)
c) Migration
In this research, the migration is only about the number of entrants in each village - people who work in surrounding their workplace and people who do not have the ability to live in urban area. The highest migration number was found in Purwoasri Village-Singosari Sub-district. This village is located just on the side of the major road of Malang-Surabaya. It is found that the migration variable is in line with land use change and therefore high migration number will also affect land use change in Mala g’s suburban (see Figure 4). Migration i Mala g’s su ur a is very much related to the pull factor of the region, i.e., industrial area.
| 29 d) Distance
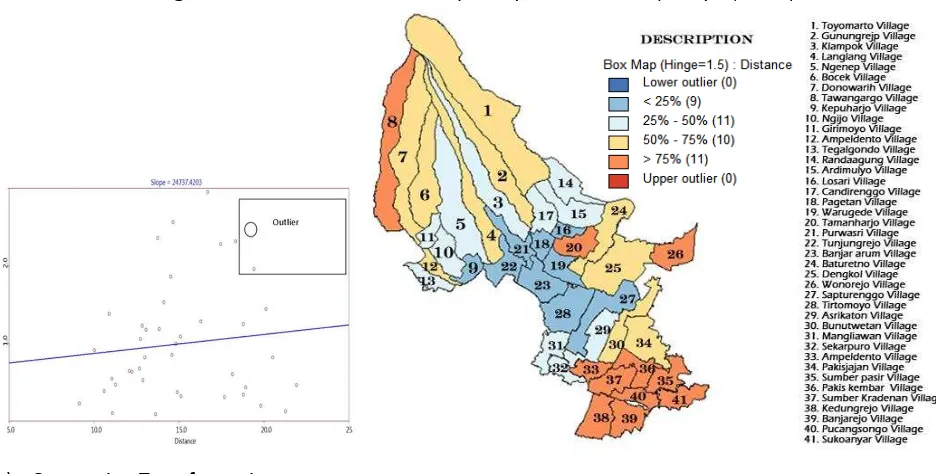
Dista e aria le as sele ted to o pare illage’s lo atio to the ity e ter here dista es a o g villages were assessed. The results show that there were no villages became outliers in the model of box map analysis. It means that the average of distance between each village to the urban area is not so far. Moreover, the distance variable is directly correlated to the land use change; it means that land use change occurs on a far distance from the city center. From the current condition, land use change was not found in the whole location but only in several places where industrial and commercial activities were located (see Figure 5).
Figure 5. Scatter Plot and Box Map Analysis of Distance (Analysis, 2015)
e) Occupation Transformation
The occupation transformation variable was focused on the total labors in each village. It was found that the highest occupation transformation is located in Banjararum Village-Singosari Sub-district. The occupation transformation in this village tends to follow the development of the area where a large tobacco industry is located. As the conclusion from the statistical test, the occupation transformation variable is in line with the land use change in the suburban area of Malang (see Figure 6).
Figure 6. Scatter Plot and Box Map Analysis of Occupation Transformation (Analysis, 2015)
30 |
Previous analysis by using box map and scatter plot only shows the preliminary relation of each variable in correspondent with land use change. The challenge is how to assess all the variables into a single model and based on the model the factors that influence land use change can then be identified. Two approaches have been done in order to assess the best land use change model, as follows:
a) Correlation analysis; from this analysis, it was found that variables of density and occupation transformation have a strong relationship to land use change. Therefore, simple regression analysis was necessary to compare the model resulted from each approach.
b) Regression analysis was employed to see the correlation between variables by reducing the outliers through one by one outlier of independent variables. If the value of Lagrange Multiplier (LM) Error is appropriate (less than 0.05) then spatial regression analysis is possible to be applied.
To determine the best model of land use change, these criteria need to be fullfilled:
a) The model should has a high coefficient of determination value (R2), where this value range from 0 to 1
(closer to 1 considered as the best),
b) Total of independent variables; the independent variables which are entered in the formula can be identified as the best model.
Based on the whole model process done in linear regression analysis, two models were identified that can further be processed into spatial regression analysis, as shown in Table3.
Table 3. The Models (Analysis, 2015)
Dependent variable Model of land use change R2 value Total of
The best model of land use change in Malang suburban area must have two criteria as mentioned in the previous explanation. Therefore, the best model in this study is chosen by eliminating village used as population variable and reducing one by one of the outliers with the equation as follows;
Y = 3,733.646 – 0.140907 .W + 98.51888 X1 – 341.7208 X2 + 3,579.966 X3
| 31 purposes such as settlement and facilities. The result also shows that most of the land use change in suburban area occurred because of the development of industrial area. This has been the pull factor for the surrounding areas to be developed. The existence of industrial area as the pull factor then determines the density level of its area where more people would like to stay around. It is also found out that the distance from city center is not one of the influence factors in land use change. In Malang City, the development of suburban areas was mostly caused by the growth of the industrial areas instead of the city center expansion.
4.
CONCLUSION
The development of industrial areas has contributed greatly to the total migration of suburban area of Malang City with the average rate of 7.69% in 2010-2012. This phenomenon creates occupation transformation from agricultural activities to non-agricultural ones such as residential, commercial, service, labor, etc. As this study focused on the labor activities with the average level of 3.04%, therefore, the people particularly those working as labors prefer to choose their dwelling around the workplace for two reasons, i.e., the location close to their workplace to minimize their transportation cost and cheaper land price for housing and ownership purposes. The two reasons have made Malang urban region grows to the areas where industries are located, and this phenomenon creates unbalance development. Consequently, the growth of Malang urban region has only been in particular location, which may cause inefficiency in managing the city.
5.
REFERENCES
Anselin, L., & Getis, A. (1993). Spatial Statistical Analysis and Geographic Information System. In M. M. Fischer & P. Nijkamp (Eds.), Geographic Information Systems, Spatial Modeling, and Policy Evaluations. Berlin Heidelberg: Springer-Verlag.
Anselin, L., et. al. (2006). GeoDa: an introduction to spatial data analysis. Geographical Analysis, 38(1), 5– 22.
Arta, F., & Pigawati, B. (2015). the Patterns and Characteristics of Peri-Urban Settlement in East Ungaran District, Semarang Regency. Geoplanning: Journal of Geomatics and Planning, 2(2), 103–115. environment of the Irangi Hills, central Tanzania. Agriculture, Ecosystems and Environment, 125(1-4), 33–47. http://doi.org/10.1016/j.agee.2007.10.008
Knox, P. L., & McCarthy, L. (1994). Urbanization. Englewood Cliffs (MJ): Prentice-Hall. Lynch, K. (2005). Rural–Urban Interaction in the Developing World. New York: Routledge.
McGee, T. G. (1991). The Emergence of Desakota Regions in Asia: Expanding a Hypothesis. The Extended Metropolis Settlement Transition in Asia, Honolulu: University of Hawai, 3–26.
Paül, V., & McKenzie, F. H. (2013). Peri-urban farmland conservation and development of alternative food networks: Insights from a case-study area in metropolitan Barcelona (Catalonia, Spain). Land Use Policy, 30(1), 94–105.
Phuc, N. Q., et. al. (2014). Agricultural land for urban development: The process of land conversion in Central Vietnam. Habitat International, 41, 1–7.
Shi, Y., et. al. (2012). Landscape and Urban Planning Characterizing growth types and analyzing growth density distribution in response to urban growth patterns in peri-urban areas of Lianyungang City.
Landscape and Urban Planning, 105(4), 425–433. http://doi.org/10.1016/j.landurbplan.2012.01.017 Su, S., et. al. (2011). Transformation of agricultural landscapes under rapid urbanization: a threat to
32 |
UN-HABITAT. (2005). Housing the Poor City in Asia. Project Report. Nairobi.
Webster, D., & Muller, L. (2009). Peri-urbanization: Zones of rural-urban transition. Human Settlement Development-Volume I, 280.