Amphetamine-Induced Dopamine Release in Human
Ventral Striatum Correlates with Euphoria
Wayne C. Drevets, Clara Gautier, Julie C. Price, David J. Kupfer, Paul E. Kinahan,
Anthony A. Grace, Joseph L. Price, and Chester A. Mathis
Background: Studies in experimental animals have
im-plicated the mesolimbic dopaminergic projections into the ventral striatum in the neural processes underlying behav-ioral reinforcement and motivated behavior; however, understanding the relationship between subjective emo-tional experience and ventral striatal dopamine (DA) release has awaited human studies. Using positron emis-sion tomography (PET), we correlated the change in endogenous dopamine concentrations following dextro-amphetamine (AMPH) administration with the associated hedonic response in human subjects and compared the strength of this correlation across striatal subregions.
Methods: We obtained PET measures of [11C]raclopride
specific binding to DA D2/D3 receptors before and after AMPH injection (0.3 mg/kg IV) in seven healthy subjects. The change in [11C]raclopride binding potential (DBP) induced by AMPH pretreatment and the correlation be-tween DBP and the euphoric response to AMPH were compared between the anteroventral striatum (AVS; com-prised of accumbens area, ventromedial caudate, and anteroventral putamen) and the dorsal caudate (DCA) using an MRI-based region of interest analysis of the PET data.
Results: The meanDBP was greater in the AVS than in the DCA (p , .05). The AMPH-induced changes in euphoria analog scale scores correlated inversely with DBP in the AVS (r5 2.95; p,.001), but not in the DCA (r5.30, ns). Post hoc assessments showed that changes in tension–anxiety ratings correlated positively withDBP in the AVS (r5.80; p [uncorrected],.05) and that similar relationships may exist betweenDBP and emotion ratings in the ventral putamen (as were found in the AVS).
Conclusions: The preferential sensitivity of the ventral
striatum to the DA releasing effects of AMPH previously demonstrated in experimental animals extends to humans. The magnitude of ventral striatal DA release correlates positively with the hedonic response to AMPH. Biol
Psychiatry 2001;49:81–96 © 2001 Society of Biological Psychiatry
Key Words: Positron emission tomography (PET),
dopa-mine, mesolimbic, striatum, accumbens
Introduction
T
he existence of brain regions specialized for reward processing was initially suggested by studies showing that rats responded operantly to stimulation of specific sites to the exclusion of other activities (Olds and Milner 1954). Sites that proved particularly sensitive to electrical self-stimulation included the midbrain dopaminergic pro-jections from the ventral tegmental area (VTA) into the nucleus accumbens shell region and the medial prefrontal cortex (PFC; reviewed in Spanagel and Weiss 1999). This mesolimbic DA system was subsequently shown to play important roles in the reinforcing properties of some drugs of abuse and of natural rewards such as food and gender in studies of experimental animals (Carboni et al 1989; Everitt et al 1989; Fibiger 1991; Wise and Rompre 1989). Nevertheless, the relationship between endogenous DA release, stimulation by primary rewards, and reward-directed behavior is complex, and the specific role of dopamine release in the striatum in these behaviors has remained unclear (Grace 1995; Spanagel and Weiss 1999). Human studies may contribute to understanding the role of mesolimbic DA release because humans can describe subjective experiences under experimental conditions in which dopamine concentration ([DA]) is altered. Such studies are possible using recently developed positron emission tomography (PET) and single photon emission computed tomography (SPECT) imaging techniques that indirectly measure [DA] via the change in DA receptor radioligand binding to DA D2/D3 receptors (Dewey et al 1991; Innis et al 1992). The striatal [11C]raclopride bind-ing thus decreases durbind-ing administration of drugs that stimulate DA release, such as dextroamphetamine (AMPH), or block DA reuptake such as methylphenidate and cocaine (Breier et al 1997; Carson et al 1997; Dewey et al 1993; Hartvig et al 1997; Laruelle et al 1995;From the Departments of Psychiatry (WCD, CG, DJK, AAG), Radiology (WCD, JCP, PEK, CAM), and Neuroscience (AAG), University of Pittsburgh School of Medicine, Pittsburgh, Pennsylvania, and the Department of Anatomy and Neurobiology, Washington University School of Medicine, St. Louis, Missouri (JLP).
Address reprint requests to Wayne C. Drevets, M.D., University of Pittsburgh Medical Center, PET Facility Room B-938 PUH, 200 Lothrop Street, Pitts-burgh PA 15213.
Received April 4, 2000; revised August 7, 2000; accepted August 21, 2000.
© 2001 Society of Biological Psychiatry 0006-3223/01/$20.00
Schlaepfer et al 1997; Volkow et al 1994a, 1994b). In combined PET- or SPECT-microdialysis studies of non-human primates, the change in DA D2/D3 receptor radio-ligand specific binding was linearly related to the integral of the DA pulse induced by AMPH administration over the AMPH doses tested (Endres et al 1997; Laruelle et al 1997). The most sensitive of these neuroimaging tech-niques uses PET to measure changes in the binding potential (BP; Mintun et al 1984) of the DA D2/D3-receptor antagonist, [11C]raclopride. [11C]Raclopride’s sensitivity to changes in endogenous [DA] may be partly conferred by its relatively fast dissociation rate (in vivo koffof 0.10 min
21
in humans; Farde et al 1989) and low affinity for DA D2 receptors (KD51.2 nmol/L; Kohler et
al 1985; Seeman et al 1989). Nevertheless, the reduction in [11C]raclopride binding following administration of phar-macologic agents that increase extracellular [DA] does not appear solely explained by competition between radioli-gand and endogenous DA for DA D2/D3 receptors and may also involve agonist-mediated internalization of DA D2/D3 receptors (Laruelle 2000).
The portion of the mesolimbic dopaminergic system where DA release is most clearly measurable by extant neuroimaging methods is the ventral striatum because available radioligands that are sensitive to endogenous [DA] have very low specific-to-nonspecific binding ratios in extrastriatal tissues. Within the striatum, the anteroven-tral subregion may comprise the area where PET measures will prove most sensitive to changes in DA release induced by drugs of abuse because microdialysis studies of rats show greater increases in extracellular fluid [DA] in the accumbens than the dorsal caudate-putamen during AMPH, cocaine, phencyclidine, nicotine, narcotic analge-sic, and ethanol challenge (Brazell et al 1990; Carboni et al 1989; Di Chiara et al 1993; Di Chiara and Imperato 1988a, 1988b; Imperato et al 1986; Imperato and Di Chiara 1986; Kuczenski and Segal 1992; Segal and Kuc-zenski 1992; Sharp et al 1987). In the case of AMPH, a preferential sensitivity of the accumbens to DA release was shown by Di Chiara and Imperato (1988a) and confirmed by some (Sharp et al 1987) but not other (Kuczenski and Segal 1992; Pehek et al 1990; Robinson and Camp 1990) studies. The inconsistency of these results appeared to reflect differences in dialysis probe placement, such that the ability to detect regional differ-ences in AMPH-induced DA release required that the dialysate from the dorsal caudate-putamen exclude extra-cellular fluid from the accumbens and that the dialysate from the accumbens include fluid from the accumbens shell (DiChiara 1991; DiChiara et al 1993).
In primates, the cells with connectional and histochem-ical features of the accumbens blend with those of the anteroventral putamen and ventromedial caudate, such that
the nucleus accumbens lacks distinct microscopic and macroscopic borders (Heimer and Alheid 1991). Never-theless, by obtaining PET measures over the anteroventral striatal region that would encompass cells of the accum-bens shell, DA release can be compared relative to the dorsal caudate (DCA) in a manner that approximates the microdialysis probe positions of Di Chiara and Imperato (1988a). Using this approach in a PET study of baboons, Drevets et al (1999) found that the reduction in [11 C]ra-clopride BP in the AVS exceeded that in the DCA (p,
.002). The proportional magnitude of this difference ap-peared similar to that of the difference in the AMPH-induced increase in extracellular fluid [DA] in the accum-bens relative to the dorsal caudate-putamen in microdialysis studies of rats (Di Chiara et al 1993).
Our study applies the PET-[11C]raclopride method to human studies to test the hypothesis that the hedonic response to AMPH will correlate more strongly with DA release in the AVS than in the DCA. The AVS is innervated by the amygdala and the orbital and medial PFC areas implicated in reward-related and emotional processing, whereas the DCA primarily receives afferent connections from cortical areas involved in sensorimotor function (Everitt et al 1989; Haber et al 1995; Kunishio and Haber 1994; Kunzle 1975; Nauta and Domesick 1984; O¨ ngu¨r and Price 2000; Parent 1990; Selemon and Gold-man-Rakic 1985). Dissociating the effects of DA release in these striatal subregions may thus prove functionally relevant to studies of emotion.
Previous human imaging studies that correlated emo-tional responses with DA receptor radioligand displace-ment during AMPH, cocaine, or methylphenidate admin-istration did not obtain measures specifically from the ventral striatum or compare the strength of such correla-tions across striatal subregions (Laruelle et al 1995; Schlaepfer et al 1997; Volkow et al 1994b, 1999). Perhaps as a result, the findings from these studies are in disagree-ment (see Discussion). Nevertheless, recent improvedisagree-ments in the spatial resolution and sensitivity of PET scanners and in the accuracy of PET-MRI coregistration methods now permit valid comparisons across distinct striatal subregions that may refine understanding about the rela-tionship between regional DA release and emotion.
Methods and Materials
Subjects
(documented by serum testing) or lactation; blood pressure.
140 mm Hg systolic or.90 mm Hg diastolic; weight.250 pounds; exposure to medications likely to alter cerebral catechol-amine neurochemistry within 4 weeks; previous illicit use of or treatment with amphetamine, dextroamphetamine, methamphet-amine, cocaine, methylphenidate, or antipsychotic drugs; lifetime history of substance abuse or dependence; or other Axis I psychiatric disorders (as confirmed by both structured [SCID; First et al 1995] and unstructured interviews with a psychiatrist [WCD]), cerebrovascular disease; hypertension; angina; cardiac arrhythmia; hyperthyroidism; glaucoma; renal or hepatic impair-ment; or hypersensitivity to sympathomimetic amines. A urine drug screen was obtained within 48 hours of scanning to document the absence of illicit drugs. Within 4 weeks before scanning, subjects were required to have a physical examination with results within normal limits and an electrocardiogram free of evidence of arrhythmia, conduction defect, infarction, or ischemia.
Acquistion of PET Image
Subject preparation included intravenous and radial arterial cannulation. The subject’s head was oriented within the scanner gantry and immobilized using a Tru-scan thermoplastic mask so that image planes were acquired parallel to the orbital–meatal line. The PET scans were acquired in three-dimensional mode using a Siemens/CTI HR1(63 contiguous slices over a 152-mm axial field-of-view; 2.4-mm plane separation; inherent full-width at half-maximum [FWHM] resolution of a point source in air5
560.5 mm transverse and 4.560.5 mm axial [Brix et al 1997]) as subjects rested with eyes closed. A transmission scan was obtained for attenuation correction of the emission scans using rotating rods of68
Ge/68
Ga with electronic windowing around the rods to minimize scatter. Images were corrected for scatter using Siemens’ model-based method (Townsend et al 1998) and reconstructed using a Hanning window with cutoff5 0.5 of Nyquist frequency. The FWHM resolution of the final, recon-structed images was 6.6 mm transverse and 5.3 mm axial (P. Kinahan, unpublished data), measured as described in Meltzer et al (1999).
High specific activity [11
C]raclopride (.1500 Ci/mmol) was synthesized as described by Halldin et al (1991). Dynamic emission scans (29 frames of increasing length over 60 min) were initiated at the beginning of slow (over 30 sec) IV bolus administration of 10 mCi of [11
C]raclopride. Arterial blood was sampled during emission scanning (35 total samples with 20 over the initial 2 min). Arterial blood was also sampled at 2, 5, 10, 30, and 60 min postinjection to obtain the ratio of unmetabolized [11
C]raclopride to total plasma radioactivity using high-perfor-mance liquid chromotography (Dewey et al 1992). To obtain the arterial input function the time course of the fraction of unme-tabolized [11
C]raclopride was fit to a sum of exponentials and used to correct the total plasma radioactivity (Drevets et al 1999; Smith et al 1998). Following the baseline scan, subjects were removed from the scanner and allowed to stretch and void.
Subjects were subsequently repositioned in the scanner by aligning laser lines projected from the scanner gantry onto markings on the hardened thermoplastic mask worn during the
baseline scan so that the head position was approximately the same in both scans. Transmission scanning was repeated. At least 120 min (range 123–182 min) following the baseline [11 C]raclo-pride injection, AMPH 0.3 mg/kg was injected IV over a 2-min period. Five min after initiation of the AMPH injection, 10 mCi of [11
C]raclopride was injected, and a second 60-min scan was acquired.
Intrascan Evaluation
Heart rate and blood pressure were recorded before the [11
C]ra-clopride and AMPH injections and at 5-min intervals during scanning using a Critikon Dinamap. The subjective emotional experience was rated at baseline (during transmission scanning before AMPH administration) and at 15 min intervals during each scan using 10-point analog scales for euphoria, irritability, anxiety, and restlessness (Eckman 1967). The AMPH-induced change in these ratings was assessed as the difference between the baseline score and the mean of analog scores obtained at 15, 30, and 45 min following AMPH injection. The mean of these three analog scale scores was used as the outcome measure to enhance measurement stability and because the time to peak euphoria score ranged from 15 to 45 min; however, post hoc analyses also examined correlations involving the peak euphoria response as well.
The Profile of Mood States (POMS; McNair et al 1971) was also administered 15 min after each [11
C]raclopride injection (i.e., 20 min after initiating the AMPH injection when the peak [DA] was expected; Endres et al 1997; Laruelle et al 1997). The POMS, which involved verbally rating 68 items on a 5-point scale, was administered only once per scan to reduce the likelihood of head movement during scanning. The change in the six POMS subscale factor scores (listed in Table 4; McNair et al 1971) were determined by comparing ratings obtained during the pre- versus the post-AMPH [11
C]raclopride scans.
Magnetic Resonance Imaging–Based Region of Interest Definition
Magnetic resonance imaging (MRI) scans were obtained using a 1.5 T GE Signa scanner and a 3-dimensional spoiled gradient recalled (SPGR) sequence (TE55, TR525, flip angle540°, NEX51, slice thickness51.5 mm, voxel size50.9431.253
1.5 mm) optimized for delineating gray matter–white matter– cerebrospinal fluid boundaries (Johnson et al 1993). The PET and MR images were prepared for alignment by centering them at the midsagittal plane using Automated Image Registration (AIR; Woods et al 1993) and the method of Minoshima et al (1992) for establishing symmetry, and segmenting the brain from extrabrain tissues in the MR image using ANALYZE (Mayo Biomedical Engineering, Rochester, MN). The PET images were aligned to each other and to the MR image, and the MR image was resliced to yield images with the same slice thickness and voxel size as the PET images using AIR (Woods et al 1993). Alignment was performed using early distribution PET images comprised of summed frames from the first 15 min following [11
sufficiently evident to guide AIR (Figure 1). The precision of PET–MRI alignment was verified (West et al 1997; Wong et al 1997) in three dimensions using “IV_volumetool” software (C. Michel, University of Louvain-la-Neuve, Belgium) by visually comparing seven internal points/lines evident on both the PET and MRI images (Figure 1) as described by Wiseman et al (1996) and Drevets et al (1999).
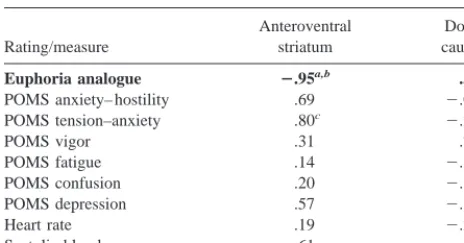
Regions of interest (ROIs) were defined by one rater (WCD) on the aligned transverse MR image planes by manually tracing around the gray matter of that structure using ImageTool (CTI Figure 1. Coregistered magnetic resonance (MR; lower) and positron emission tomography (PET; upper) image sections exemplifying steps in the procedure used to verify alignment of the [11
C]raclopride and MR images. The PET images shown are comprised of summed frames from the first 15 min following [11
C]raclopride injection, which overly represent free and non-specifically bound radiotracer so that cortical outlines are suffi-ciently evident to guide Automated Image Registration (Woods et al 1993). The precision of each PET–MR image alignment was verified by visually comparing (via spatially linked cross-lines) seven internal points/lines evident on both the PET and MRI images: the basal and anterior borders of the temporal and frontal poles (of which the latter is illustrated in A), the anterior- and posteriormost points of the corpus callosum (of which the former appears in B), the midpoint of the thalamus (shown in C), and the basal and posterior surfaces of the occipital cortex (Wiseman et al 1996). The orientation is sagittal for A and B, horizontal for the left half and coronal for the right half of C. Dorsal is to the top of the page, anterior to the left.
Figure 2. (A) Horizontal sections from coregistered magnetic resonance imaging (MRI; upper panel) and positron emission tomography (PET; lower panel) images showing examples of the striatal regions of interest used to measure [11
C]raclopride binding. The PET image shown is a summation of dynamic image frames acquired from 15to 60 min following [11
PET Systems, Knoxville, TN; Figure 2A). The same ROI set was applied to both the baseline and the post-AMPH PET images, eliminating the possibility that rater bias affectedDBP measures. The primary ROI were defined as the following:
1. DCA: the gray matter of the caudate head and neck in the four image planes (spanning 9.6 mm along the dorsal– ventral axis) beginning one slice ventral to the dorsum of the caudate. The dorsal- and ventral-most planes contain-ing striatal tissue were excluded from the DCA and AVS ROI, respectively, to reduce the effects of possible move-ment or misalignmove-ment error.
2. AVS: the gray matter surrounding the ventral edge of the anterior limb of the internal capsule (Heimer and Alheid 1991), in 2 to 3 horizontal planes ventral to the ventral-most tip of the frontal horn of the lateral ventricle (Figure 2A; Baumann et al 1999). This ROI was bounded anteri-orly, medially, and laterally by white matter and posteri-orly by the anterior commissure (DeArmond et al 1989). It included the accumbens area and parts of the ventromedial caudate and anteroventral putamen.
To ensure that differences between the DCA and AVS were not accounted for by a largerDBP in caudate tissue located between these ROI, control ROI were defined in the following:
3. Middle caudate (MCA): the caudate head in the 3 to 5 image planes situated between the DCA and AVS regions. 4. Dorsal putamen (DPU): the gray matter bounded anteri-orly and posterianteri-orly by the anterior and posterior limbs of the internal capsule, and laterally by the external capsule in the first three planes ventral to the plane containing the dorsum of the putamen.
5. Ventral putamen (VPU): putamen on the next three hori-zontal planes (passing ventrally), bounded medially by pallidum, laterally by external capsule, and anteriorly by either the internal capsule or, in slices ventral to the internal capsule, by the posterior boundary of the AVS– ROI. The dorsal- and ventralmost slices containing puta-men tissue were excluded from analysis.
Finally, a whole striatum measure was obtained by computing the spatially weighted average of the five subregions.
The reference region for measuring free and nonspecifically bound [11
C]raclopride was defined in the cerebellar cortex (Hall et al 1994). Cerebellar ROI were positioned in three MRI planes where the cortex sampled was situated $2 FWHM from the brain edge and from the ventral occipital and basal temporal cortices to reduce “spilling in” of radioactive counts from these areas (Links et al 1996). Placement of ROI was limited to axial planes dorsal to plane 54 (of 63) to sample from planes where the signal-to-noise ratio was relatively uniform in three-dimensional images (Townsend et al 1998).
Data Analysis
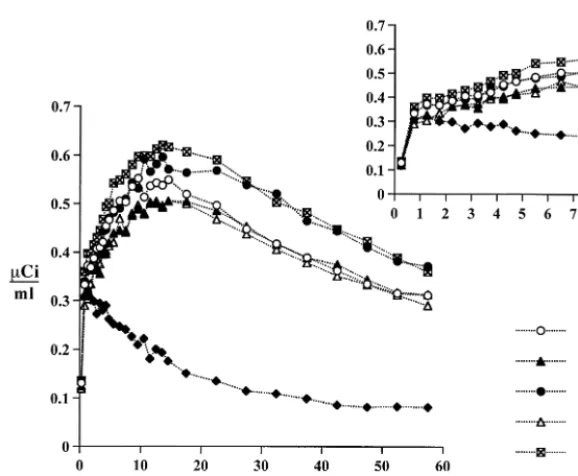
Decay-corrected, time-radioactivity curves were obtained from the dynamic PET images for each ROI (corresponding ROI from Figure 3. Positron emission tomography (PET) measures of the radioactivity concentration over 60 min in the anteroventral striatum (AVS), dorsal caudate (DCA), dorsal putamen (DPU), middle caudate (MCA), ventral putamen (VPU), and cer-ebellum (CER) following intravenous injection of high specific activity [11C]raclopride (12.5 mCi). The inset graph shows the early time-radioactivity data from 0 to 8 min postinjection. Similar curve shapes are observed for all five striatal regions of interest, whereas lower uptake and rapid clearance is observed in the cerebellum. The tissue concen-tration inmCi/mL (corrected for decay of radioac-tivity) appears on the y axis and time (min) on the x axis.
4™™™™™™™™™™™™™™™™™™™™™™™™™™™™™™™™™™™™™™™™™™™™™™™™™™
the left and right hemispheres were combined) using a calibrated phantom standard to convert tomographic counts tomCi/mL for each time point (Figure 3). The BP was determined from the PET data using a three-parameter (simplified) reference tissue model (Lammertsma et al 1996a, 1996b) as implemented by Gunn et al (1997). In this method, the kinetics of the time-tissue radioac-tivity concentration in a reference region where virtually all radioactivity reflects free and nonspecifically bound tracer is used to simplify the compartmental equations so that the BP in regions where specific binding exists can be determined without arterial sampling (Figure 2B). The cerebellum served as the reference tissue because it is nearly devoid of DA D2/D3 sites (Hall et al 1994). Receptor binding as a function of AMPH-induced changes in endogenous [DA] was assessed as the percent difference in regional DA D2/D3 receptor BP between pre-and post-AMPH conditions:DBP 5 ([BPAMPH 2 BPbaseline]/
BPbaseline) 3100. The AMPH binding to DA D2/D3 receptors
was considered negligible (Burt et al 1976).
The BP values were also computed using a graphic analysis method for assessing reversible radioligand-receptor interactions (Dewey et al 1992; Logan et al 1990). This Logan analysis employed the metabolite-corrected, arterial plasma input func-tion to provide a linear regression slope that was a measure of the total radioligand distribution volume (DV; Logan et al 1990). Regional DV values were used to compute DA D2/D3 receptor-specific binding, as (Lammertsma et al 1996a):
BP5(DVROI2DVF1NS) / DVF1NS5(DVROI/ DVF1NS)21
The cerebellar data determined the DV of free and nonspecific binding (DVF1NS), under the assumptions that specific binding
in the cerebellum was negligible and the concentration of free and nonspecifically bound radioligand (F1NS) in cerebellum approximated F1NS in all regions.
The effect of AMPH on the [11
C]raclopride plasma clearance was assessed by examining the final exponential term (y5e2bt
) of the input function. A monoexponential term was fit to the points of the input function corresponding to 20 to 60 min postinjection to determine the “smallest plasma exponent” (bi; Logan et al 1990; Patlak et al 1983). The meanbi was compared between pre- and post-AMPH scans.
The difference inDBP between the AVS and the DCA was assessed using a paired t test. Relationships betweenDBP and the euphoric response to AMPH were assessed using linear regres-sion. Post hoc assessments examined the specificity of the results in the AVS and DCA via correlations between euphoric response andDBP in the VPU, DPU, and MCA, and betweenDBP in the AVS and DCA and other emotional and autonomic variables. In
addition, the relationships between baseline emotion ratings and
DBP were assessed post hoc after Volkow et al (1994b) (see Discussion).
Results
Immediately after [11C]raclopride infusion, radioactivity accumulated bilaterally in the striatum, reaching a peak in 10 to 20 min and clearing to between 60 and 80% of the peak at 60 min (Figure 3). Cerebellar radioactivity reached a peak within 5 min but cleared more rapidly.
The mean ROI volumes were (in mL6one SD): DCA, 3.1660.528; AVS, 2.7760.722; MCA, 2.146 0.294; DPU, 2.9460.399; VPU, 2.6660.279. All striatal ROI were positioned within 20 mm of the center of the axial field-of-view.
Comparison between Logan-Derived and Simplified Reference Tissue Model–Derived Binding Measures
Arterial blood was obtained in six subjects because at-tempted cannulation was unsuccessful in one subject. For these six subjects, the Logan method applied to data acquired from 5 to 60 min postinjection showed valid model fits with correlation coefficients (r2) for the linear regression exceeding 0.99 for all ROI and all scans. High-performance liquid chromotography analysis of the concentrations of [11C]raclopride and its radiolabeled metabolites showed that the [11C]raclopride metabolism was also not significantly altered by AMPH (Table 1). Similarly, the [11C]raclopride plasma clearance measure did not significantly differ between the pre- and post-AMPH conditions (mean bi 5 0.0123 6 0.0025 and 0.0144 6 0.0033, respectively; t 5 1.17). Finally, the mean Logan-derived DV in the cerebellum did not signif-icantly differ between the baseline and post-AMPH con-ditions (0.376 60.030 and 0.35260.031, respectively). Linear regression analysis showed that the reference tissue model-derived BP values correlated tightly with those obtained using the Logan method both before and after AMPH (Table 2). The best-fit trend lines for the correlations between Logan-derived and simplified refer-ence tissue model (STRM)-derived values had a mean
Table 1. Rate of [11
C]Raclopride Metabolism during the Baseline and AMPH-Challenged Conditions, as Reflected by the Mean Fraction of Parent [11
C]Raclopride Remaining at Various Time Points (in Min from Tracer Injection)
Baseline
Time sampled 2.2960.11 10.160.13 20.160.14 40.260.20 60.260.25
Mean fraction 0.98660.013 0.96060.006 0.91660.016 0.84760.025 0.79060.038
AMPH pretreatment
Time sampled 2.2660.090 10.160.15 20.060.14 40.160.26 60.160.21
Mean fraction 0.99160.002 0.96860.009 0.93260.017 0.82960.047 0.76960.068
slope of 1.0060.056 for theDBP values, 0.99060.028 for the baseline BP values and 0.961 6 0.082 for the post-AMPH scan. The mean y intercepts corresponding to the regression lines for the BP values were 0.03660.069 for the baseline scans and 0.130 6 0.242 for the post-AMPH scans. One outlying value was noted, in which the BPAMPHvalue for the DPU was 2.84 by Logan and 2.93
by SRTM. Without this outlier, the mean slope (0.9926
0.0476) and y intercept values (0.03360.120) of the post AMPH scans were virtually the same as those of the baseline scans. The mean Logan-derived regional BP values were within 1.2% of the corresponding SRTM-derived BP values (Table 2). This slight difference reached significance only for the comparison of the baseline BP values in the DPU (t52.84, p [uncorrected],.05, df5
5). The DBP values did not differ in relation to the modeling method employed.
The baseline BP values were highest in the putamen and lower in the AVS, consistent with human postmortem studies showing that the DA D2/D3 receptor Bmax is
highest in the putamen and lower in the accumbens (Hall et al 1994). The AMPH pretreatment significantly reduced BP in the AVS (t5 23.84, p [one tail],.005, df56) but not the DCA (t5 21.45) (Table 3), and theDBP values in these ROI were not correlated (r5.16, ns). The mean
DBP for the ROI assessed post hoc appear in Table 3, and that for the whole striatum was210.666.9 (t5 24.06, p,.005). The DBP in the AVS was greater than that in the DCA (t52.01, p [one tail],.05) and the MCA (t5
3.49, p, .01), and similar to that in the VPU (Table 3). There was no evidence of a linear relationship between baseline BP and the AMPH-induced DBP.
Behavioral Assessments
During the initial baseline [11C]raclopride scan, the mean of emotion ratings obtained at 15, 30, and 45 minutes post-[11C]raclopride injection did not significantly differ from ratings obtained before [11C]raclopride injection (mean scores were 4.161.1 and 3.26 0.8 for euphoria,
Table 2. Relationships between Logan-Derived and SRTM-Derived BP andDBP Values for Subsample with Arterial Plasma Input Functions Available (n56)
Condition
Anteroventral striatum
Dorsal caudate
Midlevel caudate
Dorsal putamen
Ventral putamen
Correlation coefficients (r values) between Logan-derived and SRTM-derived values
Baseline BPa .997 .998 .998 .994 .998
BP under AMPHa .997 .978 .978 .981 .990
DBPb .999 .953 .984 .983 .987
Mean % difference in BP values (6SD) between Logan-derived and
SRTM-derived BP values
Baseline BP 20.15261.27 20.69160.692 20.33960.749 21.0960.959c 20.57060.726
BP under AMPH 21.1861.63 20.57961.53 20.56061.44 21.0961.36 20.62661.67
MeanDBP values (6SD) obtained using Logan-derived and
SRTM-derived BP values
Logan-derivedDBP 215.8610.7 21.8565.28 24.2765.91 27.5669.07 212.868.88
SRTM-derivedDBP 214.8611.5 21.9765.26 24.0566.19 27.5768.69 212.769.19
SRTM, simplified reference tissue mode; BP, binding potential; AMPH, dextroamphetamine. aAll correlations significant at p,.001; see Results for slope and y intercept values.
bAll correlations significant at p,.01.
cDifference significant by paired t test at p,.05, df56.
Table 3. Mean Baseline Reference Tissue Model–Derived BP and % Changes in BP in the Postdextroamphetamine Relative to the Baseline Scan for All Seven Subjects
Kinetic parameter
Primary ROI Secondary ROI assessed post hoc
Anteroventral striatum Dorsal caudate Midlevel caudate Dorsal putamen Ventral putamen
Mean BPBaseline(SD) 2.60 (0.450) 2.59 (0.282) 2.54 (0.342) 3.34 (0.365) 3.25 (0.364)
MeanDBP (SD) 215.4 (10.6)b 24.46 (8.15) 210.8 (12.1)a 210.2 (10.6)a 214.9 (10.1)b
BP, binding potential;DBP, percent change in binding potential; ROI, region of interest. ap,.05, df56.
2.462.1 and 1.761.8 for anxiety, 1.161.1 and 1.36
1.5 for irritability, and 2.5 6 1.7 and 2.2 6 1.6 for restlessness, for the periods before and after [11 C]raclo-pride injection, respectively).
In contrast, the emotional response following AMPH administration varied widely. Six subjects rated the eu-phoric response to AMPH as “marked” or “extreme,” but one became mildly dysphoric. The euphoria was compared with an orgasm by some subjects and described as a “rush of a very good feeling like nothing previously experi-enced” by others. The emotional response usually peaked about 15 min following AMPH administration and grad-ually diminished through the remainder of the scan.
Although the POMS had no subscale that closely reflected euphoria, the change in the POMS “tension– anxiety” factor score (mean change51.1610) correlated with changes in both the anxiety (r 5 .69) and the restlessness (r5.74) analog scores, and the change in the POMS “anxiety-hostility” factor (mean change5 20.14
6 4.9) correlated with changes in the irritability analog score (r5 .78). Thus, to reduce the number of post hoc comparisons, these POMS factors replaced the corre-sponding analog scores when computing correlations with
DBP (Table 4). The POMS subscale scores that changed in the same direction in all subjects were the “vigor” factor (reflecting how alert and energetic one felt), which in-creased 1064.3 points (p,.01), and the “fatigue” factor, which decreased 5.363.1 points (p ,.05). The POMS “depression– dejection” factor score showed little change (mean 5 20.71 6 1.7), and changes in the “confusion” factor were inconsistent (mean 5 21.4 6 5.3). The changes in euphoria were inversely correlated with the POMS tension–anxiety (r 5 2.73) and the restlessness analog scores (r5 2.62) and did not correlate with POMS vigor scores (r5 2.15).
Autonomic changes induced by AMPH were consistent across subjects. The mean, peak systolic blood pressure increase was 436 14 mm Hg, which occurred within 10 to 25 min post-AMPH. The mean, peak heart rate eleva-tion was 326 21 beats per minute.
Relationships betweenDBP and Behavioral Assessments
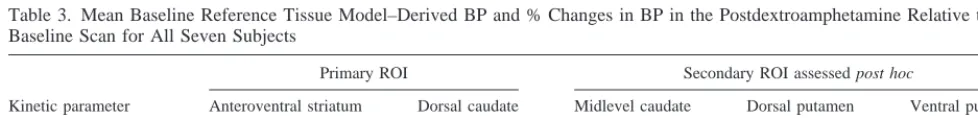
The change in euphoria ratings correlated withDBP in the AVS (r5 2.95, p5.001), but not in the DCA (r5.30; Figure 4). The difference between these correlation coef-ficients was significant (p,.01), confirming the a priori hypothesis. Post hoc tests showed that the correlation between the euphoric response andDBP in the AVS also differed from that in the DPU (p , .01) and whole striatum (p [one sided], .05], trended toward differing from that in the MCA (.05,p [one sided],.10) and did not significantly differ from that in the VPU. The changes in euphoria correlated withDBP in the VPU (r5 2.77, p, .05) but not in the DPU (r 5 .25), the MCA (r 5 2.61), or the whole striatum (r 5 2.50). Correlations between DBP and the peak euphoric response yielded similar results (AVS, r5 2.85, p5.01; DCA, r5 .28; MCA, r5 2.61; DPU, r5 .23; VPU, r5 2.74, .05, p , .10; whole striatum, r 5 2.46). The correlation between euphoria and the AVS DBP was also similar when analysis was limited to the six subjects who devel-oped AMPH-induced euphoria (r5 2.85, p,.05; Figure 4).
The results of post hoc correlations between DBP and other behavioral and autonomic measures are summarized in Table 4, and are only remarkable for a positive correlation between the AVS DBP and changes in the POMS tension-anxiety factor score. The baseline happi-ness/euphoria ratings were also significantly correlated withDBP in the AVS (r 5 .91, p ,.005) and the VPU (r5.87, p5.01), but not in the DCA (r5.15), DPU (r5
.11), or MCA (r5.71, .05, p,.1). Exploratory post hoc correlations betweenDBP and baseline anxiety ratings and between baseline BP, and baseline emotion ratings were not significant in any ROI.
Discussion
These data confirm the hypothesis that the euphoric response to AMPH correlates positively with the magni-tude of DA release in the AVS, as reflected by the inverse correlation withDBP. Conversely, the anxiety response to AMPH was inversely correlated with the magnitude of DA release in the AVS. Similar relationships may exist be-tween these emotional responses and DA release and the VPU. In contrast, AMPH-induced emotional changes did
Table 4. Correlation Coefficients (r Values) betweenDBP and Changes in Emotion Ratings, and Autonomic Measures
Rating/measure
Anteroventral striatum
Dorsal caudate
Euphoria analogue 2.95a,b .30
POMS anxiety– hostility .69 2.059
POMS tension–anxiety .80c 2.28
POMS vigor .31 .79c
POMS fatigue .14 2.62
POMS confusion .20 2.32
POMS depression .57 2.18
Heart rate .19 2.28
Systolic blood pressure 2.61 2.33
The test of the a priori hypothesis is bolded.DBP, percent changes in binding potential; POMS, Profile of Mood States.
ar value significant (p,.001).
bDifference between correlation coefficients for anteroventral striatum and
dorsal caudate significant (p,.01).
not correlate with DA release in the DCA or the DPU. These are the first human imaging data that demonstrate that pharmacologically induced changes in [DA] differ across striatal regions in their relationship to emotional responses.
The magnitude of the AMPH-induced reduction in [11C]raclopride binding was significantly higher in the AVS than in the DCA or the MCA (Table 3), consistent with previous findings in anesthetized baboons (Drevets et al 1999). In this baboon PET study, AMPH pretreatment at 0.3 mg/kg decreased BP values by an average of216.36
10.8 and 24.45 6 13.4 in the AVS and DCA, respec-tively, similar to the corresponding meanDBP values of
215.4610.6 and24.4668.15, respectively, found here in humans using comparable methods (Table 3). The proportional magnitude of these differences is also similar to the greater AMPH-induced DA pulse in the accumbens relative to the dorsal caudate-putamen measured in rats by microdialysis (Di Chiara et al 1993).
Finally, the DBP values were similar whether derived using the SRTM or Logan graphical analysis methods for modeling DA D2/D3 receptor specific [11C]raclopride binding (Table 1). Lammertsma et al (1996a) showed that under resting conditions, SRTM-derived BP values corre-lated with those obtained using compartmental modeling approaches that required an arterial input function. Our study additionally found that under the AMPH-pretreat-ment condition, SRTM-derived BP values correlated with Logan-derived BP values obtained using an arterial input function (r. .97). Although comparisons of BP values modeled using these approaches did not exclude the possibility of a subtle bias in the SRTM-derived BP values, which were ;1% higher than the corresponding Logan-derived values, because this difference existed in both the pre- and post-AMPH data, theDBP values did not differ across methods.
Study Limitations
The DA projections of greatest interest in our study innervate cells with histochemical and connectional
fea-4™™™™™™™™™™™™™™™™™™™™™™™™™™™™™™™™™™™™™™™™™™™™™™™™™™
Figure 4. The relationship between the change in euphoria analog scale scores (x axis) and the change in binding potential
(DBP; y axis) in the AVS, DCA, MCA, DPU, and VPU
tures of the accumbens shell. In primates, these cells are scattered through the ventromedial caudate and anteroven-tral putamen (Gerfen et al 1985; Heimer et al 1991; Heimer and Alheid 1991). Neuroimaging studies are thus incapable of assessing whether the DA projections to the shell specifically account for the correlation between DA release and euphoria.
Also related to PET’s limited spatial resolution, regional BP values were affected by radioactivity spilling in from surrounding tissues and dilutional effects from adjacent structures with low tracer uptake (Links et al 1996). Because pre- and post-AMPH scans are similarly affected by such partial volume effects, the relationship between
DBP and the integral of the AMPH-induced DA pulse measured by microdialysis is approximately linear at the AMPH dose tested (Endres et al 1997; Laruelle et al 1997). Nevertheless, regionalDBP values are influenced byDBP in adjacent pixels.
In computer simulations performed to assess bias from partial volume effects in baboon [11C]raclopride images, Drevets et al (1999) showed that measured signals from the DCA and the AVS were easily differentiated but that the AVS and putamen results were weakly correlated. For example, altering the change in the putamen’s tracer distribution volume (DDV) from220% to230% resulted in an absolute difference inDBP of 2.5% in the AVS and of ,1% in the DCA in baboon images (Drevets et al 1999). These results reflected the greater axial separation between the AVS and the DCA (7–12 mm in humans) relative to the axial scanner resolution, compared with the smaller anterior–posterior separation of the AVS and putamen relative to the transverse resolution. In our study, bias from partial volume effects was less problematic because of the larger size of the human striatum (e.g., the mean AVS volumes were 2.7760.722 mL and 0.4846
0.145 mL in humans and baboons, respectively).
To validate these results, the volumetric resolution of a 1.25-mm point radioactivity source was measured in the HR1using the acquisition and reconstruction parameters applied herein. The measured FWHM resolution of 5.3 mm axial and 6.6 mm transverse yielded a volumetric resolution of 0.23 mL, which was only 8.3% of the mean AVS volume (2.776 0.722 mL). The axial resolution of 5.3 mm FWHM implies that pixels located$11 mm from the edge of the AVS will have virtually no effect on PET measures from the AVS. The center-to-center separation between the AVS and the DCA ROI was well over this distance. In humans, measured signals from the AVS will therefore be easily differentiated from those of the DCA and the DPU but will be weakly influenced by those from the VPU and MCA.
Demonstrating differential regional sensitivities to AMPH across subregions thus depended on showing that
the meanDBP was greater in the AVS than in the DCA and that this difference was not accounted for by an even greaterDBP in the MCA or the VPU (Drevets et al 1999). Similarly, the specificity of the correlation between the AVSDBP and euphoria was established by showing that the strongest correlation involved the AVS, whereas cor-relations involving other striatal subregions were weaker. This approach was facilitated by the low [11C]raclopride specific binding in extrastriatal areas, which reduced the number of comparisons required across regions (Hall et al 1994; Figure 2A). The ability to assess relative differences in radiotracer concentration across conditions in ROI separated by less than the FWHM resolution is central to PET’s utility in localizing voxels of maximal difference or correlation in brain mapping studies (Fox et al 1986; Friston et al 1996).
Nevertheless, the spatial resolution limitations obscured interpretation of the post hoc observations that euphoria ratings correlated with DBP in the adjacent VPU (r 5 2.77, p [uncorrected],.05). Because this correlation was weaker than that found in the AVS, it may reflect spilling in of radioactive counts from the adjacent AVS. In primates, however, the VPU and the medial portion of the MCA receive projections from the amygdala and the orbital and medial PFC (O¨ ngu¨r and Price 2000; Russchen et al 1985), suggesting that the weaker correlations found in these ROI between DA release and emotion may be biologically relevant. In contrast, the DCA and DPU are predominantly innervated by sensorimotor cortex, and the lack of correlation between DBP and euphoria ratings in these ROI presumably signifies regional differences in function.
Presumably related to the large size of the AVS ROI relative to that of the volumetric resolution of the images analyzed, Martinez et al (2000) reported that the repro-ducibility forDBP measures from the AVS are nearly the same as for the entire striatum. The test–retest repeatabil-ity, measured using a Siemens HR-series PET scanner as the mean absolute difference in [11C]-raclopride receptor
specific binding between time 1 and time 2, was 967% in a ventral striatal ROI defined by the anatomical rules we used to define the AVS (Baumann and Bogerts 1999; Drevets et al 1999), 86 4% in the dorsal caudate, and 6
6 2% in the dorsal putamen (Martinez et al 2000). Because these values were obtained using a bolus plus constant infusion method for administering [11
(although they did not report correlations between DBP and emotion).
Although regionalDBP measures are subject to poten-tial error from image misalignment and head movement, the variability introduced by such sources is unlikely to account for the regional differences in DBP or the rela-tionship between DBP and euphoria found herein. The method used to align PET and MRI images has a mean error of#2 mm at the striatum as validated using PET images of blood flow and glucose metabolism (Black et al 1997; Woods et al 1993). The anatomic resolution and statistic quality of early [11C]raclopride distribution
im-ages acquired 3D on the HR1(Figure 1) is superior to that of the blood flow images used to validate AIR by Woods et al (1993) and Black et al (1997) and approaches that of the glucose metabolic images used in the invasive valida-tion study of Woods et al (1993).
The likelihood of movement between image frames was reduced by using Tru-scan thermoplastic masks, which con-strain head position at multiple surfaces (e.g., forehead, temporal and occipital surfaces, mandible) when bolted to the rigid headholder of the HR1. If head movement occurs within this mask-mold, subjects generally must reestablish their original head position to remain comfortable. In addi-tion, because the effects of image misalignment and move-ment are greatest at striatal edges, the dorsal-and ventral-most planes containing striatal tissue were excluded from analysis. Finally, the AMPH dose of 0.3 mg/kg was selected because it was within the center of the dose-response curve for reducing [11C]raclopride binding (enhancing sensitivity for detecting the responsiveness of DA neurons) but was below the range likely to cause agitation (Breier et al 1997; Endres et al 1997; Laruelle et al 1995).
Nevertheless, it is conceivable that a bias toward lower counts and larger apparent [11C]raclopride displacement would be introduced in subjects who had more movement following AMPH administration. This bias would not explain the regional differences inDBP or in the correla-tion between DBP and euphoria, however. Movement effects are presumably random in direction, affecting the DCA and AVS similarly (these ROI are comparable in mean volume and are both situated near striatal–nonstria-tal tissue edges), yetDBP was greater in the AVS than in the DCA. Moreover, because movement would likely correlate with changes in anxiety and restlessness, which were inversely correlated with changes in euphoria, mo-tion artifact would be expected to produce correlamo-tions opposite to those found in Figure 4.
Finally, a potential limitation of the paired bolus method for infusing [11C]raclopride is that AMPH-induced changes in cerebral blood flow (CBF) may influence BP. Logan et al (1994) showed that large changes in CBF affect tracer distribution volume (DV), although the
stri-atal-to-cerebellar DV ratio (and hence BP) is relatively insensitive to cerebrospinal fluid (CBF) differences that remain stable throughout scanning; however, if CBF fluctuates during scanning, errors in the derivation of BP may result. Moreover, SRTM-derived BP values are sen-sitive to CBF such that very large increases in CBF can slightly increase the calculated BP (Gunn et al 2000), and large, disproportionate CBF changes in the ROI relative to the reference tissue can subtly bias the BP (Slifstein et al 2000).
To address these issues, CBF was measured using H2
15
O-PET in anesthetized baboons at 5, 25, 45, and 65 min following AMPH administration (0.6 mg/kg, IV; Price et al 2000). The test–retest variability following AMPH (11%) was similar to that of baseline CBF scans acquired at 20-min intervals before AMPH (10%). The mean CBF did not significantly differ between pre- and post-AMPH conditions in either the striatum or the cere-bellum, and the striatal-to-cerebellar CBF ratio remained stable across the post-AMPH scans (Price et al 2000). These data are consistent with previous findings that compartmental modeling-derived, [11C]raclopride K1
val-ues (which putatively reflect tracer delivery) do not differ between the DCA and AVS at baseline and do not significantly change in the DCA or the AVS following AMPH administration (Drevets et al 1999). Furthermore, Kahn et al (1989) showed that PCO2corrected CBF is not
significantly altered in the human cerebral cortex at either 3 or 30 min following AMPH administration (0.3 mg/kg IV). Larger doses of dextroamphetamine have generally been required to consistently alter CBF in experimental animals (reviewed in Kahn et al 1989).
Previous Imaging Studies of the Emotional–Behavioral Correlates of Striatal DA Release
three image slices, a technique that would emphasize radioactive counts from the putamen (Table 3 and Figures 2A and 3; Hall et al 1994), and to a lesser extent the DCA, but would substantially dilute the contribution from the AVS.
Volkow et al (1994b, 1999) assessed relationships between emotion ratings and [11C]raclopride receptor specific binding during methylphenidate (MP) administra-tion. Image data were obtained from ROI defined on two consecutive, PET planes (spanning 13 mm) through the center of the striatum (Volkow et al 1993), where the majority of the striatal tissue is comprised of putamen and caudate (DeArmond et al 1989; Talairach and Tournoux 1988). In an initial study of 15 healthy men imaged before and after MP administration (0.5 mg/kg IV), striatal DA release was not correlated with ratings of drug-induced “high.” Volkow et al (1994b) hypothesized that this negative finding was explained by the limitation that their striatal measures predominantly reflected dorsal, rather than ventral, striatal DA release. In contrast, in a later study of 14 subjects (8 men, 6 women) who received MP doses varying between 0.025 and 0.5 mg/kg IV, Volkow et al (1999) found that the change in DA D2/D3 receptor binding significantly correlated with analog scale ratings of “high” and “rush” (rs5.78 and .75, respectively). Our study extends these findings by showing that the euphoric response to psychostimulant drugs more specifically re-lates to [DA] in the ventral striatum.
Volkow et al (1994b) also found that the magnitude of DA release during MP administration correlated inversely with baseline mood analog scale scores (de-fined as the contrast between happy vs. depressed) and positively with baseline anxiety ratings (rs5 2.68 and .70, respectively). The observation that the happier a subject’s mood was at baseline, the less DA they released during MP administration, was consistent with our observation that baseline happiness/euphoria ratings were inversely correlated with AMPH-induced DA release in the AVS (r5.91) and the VPU (r5.87). Our data thus extend these findings by indicating that the relationship between the baseline emotional state and the dopaminergic response to psychostimulant chal-lenge is strongest in the ventral striatum.
Schlaepfer et al (1997) assessed the relationship between cocaine-induced DA release and euphoria in cocaine abusers. The [11C]raclopride receptor specific binding was reduced
10.7% in an ROI defined in the dorsal putamen. This change did not correlate with euphoria ratings, consistent with our finding that the euphoric response to AMPH was not corre-lated with DA release in the DPU.
Koepp et al (1998) assessed changes in [11C]raclopride BP in healthy humans playing a video game for monetary reward in ROI defined on PET images in the dorsal and
ventral striatum. In both ROI, BP decreased, but these reductions were more prominent in the ventral striatum. Although emotion ratings were not examined, perfor-mance (points earned) correlated inversely with DBP, possibly reflecting activation of DA projections into the ventral striatum during incentive–reward-related processing.
Finally, a functional MRI study of cocaine-associated euphoria and craving in cocaine-dependent subjects showed a hemodynamic response in the vicinity of the accumbens during cocaine infusion (Breiter et al 1997). Although this physiologic activity accompanied the co-caine “rush,” the hemodynamic response in this area was most robust during craving. These results were thought to challenge the view that DA release in the accumbens plays a central role in mediating euphoria and reward (Spanagel and Weiss 1999); however, hemodynamic changes convey no specific information about DA transmission and instead reflect a complex summation of the neurophysiologic events affecting blood flow and oxygen utilization. These events are dominated by the energy utilized during syn-aptic transmission from afferent connections, which in the striatum are predominantly nondopaminergic. The hemo-dynamic response Breiter et al (1997) observed in the accumbens area during craving may thus have reflected afferent transmission from the PFC and limbic structures (Childress et al 1999; Grant et al 1996).
Role of Ventral Striatal DA Release and the Emotional Response to AMPH
Although AMPH induces release of norepinephrine and serotonin as well as DA, [11C]raclopride displacement specifically reflects [DA]. In microdialysis studies of nonhuman primates the striatal [DA] increases to a peak at 15 to 20 min post-IV bolus injection of AMPH and remains elevated above baseline$ 60 min (Endres et al 1997; Laruelle et al 1997). Similarly, euphoria ratings typically peak 10 to 20 min post-AMPH injection and remain elevated at least 60 min (Laruelle et al 1995).
whereas similar lesions of the caudate-putamen are inef-fective (Roberts et al 1980).
Nevertheless, the temporal relationships between expo-sure to natural rewards (which produce only transient [DA] elevations), DA neuronal firing activity, and extra-cellular [DA] suggest that ventral striatal DA release does not maintain the subjective sense of pleasure but is instead involved in forming associations between salient contex-tual stimuli and internal rewarding events (Schultz et al 1997; Spanagel and Weiss 1999). The DA signal may also participate in regulating the frequency and timing of behavioral selection by facilitating switching between behaviors and attentional– cognitive sets as reinforcement contingencies change (Redgrave et al 1999; Robbins and Sahakian 1983). Mesolimbic DA release also modulates afferent synaptic transmission from nondopaminergic pro-jections originating in the ventral striatum, PFC, amyg-dala, hypothalamus, and other limbic structures that may play more critical roles in maintaining behavioral rein-forcement (Mogenson et al 1993; O¨ ngu¨r and Price 2000; Phillips and Fibiger 1978; Spanagel and Weiss 1999).
The hypothesis that DA release functions as a learning signal by highlighting rewarding stimuli is noteworthy in light of our subjects’ experiences during AMPH exposure. For example, during the baseline scan one subject repeatedly complained of discomfort at his arterial cannulation site during blood sampling. During the post-AMPH scan, how-ever, the valence of this sensory stimulus as a potential reinforcer was apparently altered because the same manipu-lation of the catheter hub became highly pleasurable.
By stimulating release of cytosolic DA through a mechanism independent of DA neuronal firing and by inhibiting reuptake of DA released during DA neuronal firing, AMPH increases interstitial [DA] (Kuczenski and Segal 1989); however, elevating [DA] activates presynap-tic mechanisms for reducing DA release and synthesis, and modulates glutamate release from afferent PFC and limbic axon terminals in a manner that also inhibits DA release (Grace 1991, Mogenson et al 1993; Roth 1987; O’Donnell and Grace 1994; Verma and Moghaddam 1998). Such autoregulatory mechanisms may be activated to a greater extent in subjects showing relatively smallerDBP (only a small amount of the variability of DBP in response to a fixed AMPH dose is accounted for by interindividual differences in plasma AMPH concentrations, implying that other factors play important roles in determining intersubject differences inDBP; Hartvig et al 1997). In the subject who developed dysphoria (which is not uncommon during AMPH administration, e.g., Laruelle et al 1995), it is conceivable that AMPH induced such small net changes in [DA] that the emotional response was dominated by pharmacologic effects on other systems. Alternatively, this subject may have been more sensitive to AMPH producing
a preferential augmentation of tonic DA levels, leading to a decrease in spike-dependent, phasic DA release because the euphorigenic effects of AMPH may primarily depend on phasic DA release (Grace 1991, 1995).
Implications for Future Studies
The anteroventral and dorsal striata comprise major targets of the mesolimbic and mesostriatal subdivisions of the telencephalic DA system, respectively. The data presented here highlight the significance of distinguishing dynamic neurotransmitter function in the ventral versus the dorsal striata in investigations of human emotion. Probing the function of the human mesolimbic DA system is relevant to neuroimaging studies of a variety of psychopathologic conditions, including depression, mania, psychosis, and substance abuse (Grace 1991, 1995).
This study was supported by a grant from NARSAD (WCD), NIH Grants Nos. MH01713 (WCD) and MH30915 (DJK), and NIH/NCRR/GCRC Grant No. RR00056.
The authors thank David Townsend, Ph.D., for advice regarding image acquisition; Michael Zigmond, Ph.D., for discussions relevant to data interpretation; Phil Greer, M.S., for assistance with image alignments; and the UPMC PET Laboratory staff for technical assistance.
References
Baumann B, Danos P, Krell D, Diekmann S, Leschinger A., Stauch R, et al (1999): Reduced volume of limbic system-affiliated basal ganglia in mood disorders: Preliminary data from a post mortem study. J Neuropsychiatry Clin Neurosci 11:71–78.
Black KJ, Gado MH, Videen TO, Perlmutter JS (1997): Baboon basal ganglia stereotaxy using internal MRI landmarks: Val-idation and application to PET imaging. J Comput Assist Tomogr 21:881– 886.
Brazell MP, Mitchell SN, Joseph MH, Gray JA (1990): Acute administration of nicotine increases the in vivo extracellular levels of DA, 3,4-dihydroxyphenylacetic acid and ascorbic acid preferentially in the nucleus accumbens of the rat: Comparison with caudate-putamen. Neuropsychopharmacol-ogy 29:1177–1185.
Breier A, Saunders R, Carson RE, Kolachana BS, de Bartolomeis A, Weinberger DR, et al (1997): Schizophrenia is associated with elevated amphetamine-induced synaptic dopamine con-centrations: Evidence from a novel positron emission tomog-raphy method. Proc Natl Acad Sci U S A 94:2569 –2574. Breiter HC, Gollub RL, Weisskoff RM, Kennedy DN, Makris N,
Berke JD, et al (1997): Acute effects of cocaine on human brain activity and emotion. Neuron 19:591– 611.
Brix G, Zaers J, Adam L-E, Belleman ME, Ostertag H, Trojan H, et al (1997): Performance evaluation of a whole-body PET scanner using the NEMA protocol. J Nucl Med 38:1614 – 1623.
Burt DR, Creese I, Snyder SS (1976): Properties of [3
H]halo-peridol and [3
release in calf brain membranes. Mol Pharmacol 12:800 – 812.
Carboni E, Imperato A, Perezzani L, Di Chiara G (1989): Amphetamine, cocaine, phencyclidine, and nomifensine in-crease extracellular DA concentrations preferentially in nu-cleus accumbens of freely moving rats. Neuroscience 28:653– 661.
Carson RE, Breier A, de Bartolomeis A, Saunders R, Su TP, Schmall B, et al (1997): Quantification of amphetamine-induced changes in [11
C]raclopride binding with continuous infusion. J Cereb Blood Flow Metab 17:437– 447.
Childress AR, Mozley PD, McElgin W, Fitzgerald J, Reivich M, O’Brien CP (1999): Limbic activation during cue-induced cocaine craving. Am J Psychiatry 156:11–18.
DeArmond SJ, Fusco MM, Dewey MM (1989): Structure of the Human Brain: A Photographic Atlas. New York: Oxford University Press.
Dewey SL, Logan J, Wolf AP, Brodie JD, Angrist B, Fowler JS, Volkow ND (1991): Amphetamine induced decreases in (18
F)-N-methylspiroperidol binding in the baboon brain using positron emission tomography (PET). Synapse 7:324 –327. Dewey SL, Smith GS, Logan J, Brodie JD, Ding WY, Ferrieri
RA, et al (1992): GABAergic inhibition of endogenous dopamine release measured in vivo with11
C-raclopride and positron emission tomography. J Neurosci 12:3773–3780. Dewey SL, Smith GS, Logan J, Brodie JD, Fowler JS, Wolf AP
(1993): Striatal binding of the PET ligand 11
C-raclopride is altered by drugs that modify synaptic dopamine levels. Synapse 13:350 –356.
Di Chiara G (1991): On the preferential release of mesolimbic dopamine by amphetamine. Neuropsychopharmacology 5:243–244.
Di Chiara G, Imperato A (1988a): Drugs abused by humans preferentially increase synaptic dopamine concentrations in the mesolimbic system of freely moving rats. Proc Natl Acad Sci U S A 85:5274 –5278.
Di Chiara G, Imperato A (1988b): Opposite effects ofm and
k-opiate agonists on dopamine release in the nucleus accum-bens and in the dorsal caudate of freely moving rats. J Phar-macol Exp Ther 244:1067–1080.
Di Chiara G, Tanda G, Frau R, Carboni E (1993): On the preferential release of dopamine in the nucleus accumbens by amphetamine: Further evidence obtained by vertically im-planted concentric dialysis probes. Psychopharmacology 112: 398 – 402.
Drevets WC, Price JC, Kupfer DJ, Kinahan P, Lopresti B, Holt D, Mathis C (1999): PET measures of amphetamine-induced dopamine release in ventral versus dorsal striatum. Neuropsy-chopharmacology 21:694 –709.
Eckman G (1967): The measurement of subjective reactions. Forsvarsedicine 33:27– 41.
Endres CJ, Kolachana BS, Saunders RC, Su T, Weinberger D, Breier A, et al (1997): Kinetic modeling of [11
C]raclopride: Combined PET-Microdialysis studies. J Cereb Blood Flow Metab 17:932–942.
Everitt BJ, Cador M, Robbins TW (1989): Interactions between the amygdala and ventral striatum in stimulus-reward associ-ations: Studies using a second-order schedule of sexual reinforcement. Neuroscience 30:63–75.
Farde L, Eriksson L, Blomquist G, Halldin C (1989): Kinetic analysis of central [11
C]raclopride binding to D2-dopamine
receptor studies by PET—a comparison to the equilibrium analysis. J Cereb Blood Flow Metab 9:696 –708.
Fibiger HC (1991): The dopamine hypotheses of schizophrenia and mood disorders. In: Willner P, Scheel-Kruger J, editors. The Mesolimbic Dopamine System: From Motivation to Action. New York: Wiley, 615– 638.
First MB, Spitzer RL, Gibbon M, Williams JBW (1995): Structured Clinical Interview for DSM-IV Axis I Disorders— Patient Edition (SCID-I/P, Version 2.0). New York: New York State Psychiatric Institute, Biometrics Research Depart-ment.
Fox PT, Mintun MA, Raichle ME, Miezin FM, Allman JM, Van Essen DC (1986): Mapping human visual cortex with positron emission tomography. Nature 30:806 – 809. Friston KJ, Holmes A, Poline J-B, Price CJ, Frith CD (1996):
Detecting activations in PET and fMRI: Levels of inference and power. Neuroimage 40:223–235.
Gerfen CR, Baimbridge KJ, Miller JJ (1985): The neostriatal mosaic: Compartmental distribution of calcium-binding pro-tein and parvalbumin in the basal ganglia of the rat and monkey. Proc Natl Acad Sci U S A 82:8780 – 8784. Grace AA (1991): Phasic versus tonic dopamine release and the
modulation of dopamine system responsivity: A hypothesis for the etiology of schizophrenia. Neuroscience 41:1–24. Grace AA (1995): The tonic/phasic model of dopamine system
regulation; its relevance for understanding how stimulant abuse can alter basal ganglia function. Drug Alcohol Depend 37:111–129.
Grant S, London ED, Newlin DB, Villemagne VL, Liu X, Contoreggi C, et al (1996): Activation of memory circuits during cue-elicited cocaine craving. Proc Natl Acad Sci U S A 93:12040 –12045.
Gunn RN, Lammertsma AA, Grasby PM (2000): Quantitative analysis of [carbonyl-11
C]WAY-100635 PET studies. Nu-clear Med Biol 27:477– 482.
Gunn RN, Lammertsma AA, Hume SP, Cunningham VJ (1997): Parametric imaging of ligand-receptor binding in PET using a simplified reference region model. Neuroimage 6:279 –287. Haber SN, Kunishio K, Mizobuchi M, Lynd-Balta E (1995): The
orbital and medial prefrontal circuit through the primate basal ganglia. J Neurosci 15:4851– 4867.
Hall H, Sedvall G, Magnusson O, Kopp J, Halldin C, Farde L (1994): Distribution of D1- and D2-dopamine receptors, and
dopamine and its metabolites in the human brain. Neuropsy-chopharmacology 11:245–256.
Halldin C, Farde L, Ho¨gberg T, Hall H, Stro¨m P, Ohlberger A, Solin O (1991): A comparative PET study of five carbon-11 or fluorine-18 labelled salicylamides. Preparation and in vitro dopamine D-2 receptor binding. Nucl Med Biol 18:871– 881. Hartvig P, Torstenson R, Tedroff J, Watanabe Y, Fasth KJ, Bjurling P, Långstro¨m B (1997): Amphetamine effects on dopamine release and synthesis rate studied in the Rhesus monkey brain by positron emission tomography. J Neural Transm 104:329 –339.
Heimer L, Zahm DS, Churchill L, Kalivas PW, Wohltmann C (1991): Specificity in the projection patterns of accumbal core and shell in the rat. Neuroscience 41:89 –125.
Imperato A, Di Chiara G (1986): Preferential stimulation of dopamine-release in the nucleus accumbens of freely moving rats by ethanol. J Pharmacol Exp Ther 239:219 –228. Imperato A, Mulas A, Di Chiara G (1986): Nicotine
preferen-tially stimulates dopamine release in the limbic system of freely moving rats. Eur J Pharmacol 132:337–338. Innis RB, Malison RT, Al-Tikriti M, Hoffer PB, Sybirska EH,
Seibyl JP, et al (1992): Amphetamine-stimulated dopamine release competes in vivo for [123I]IBZM binding to the D2 receptor in nonhuman primates. Synapse 10:177–184. Johnson LA, Pearlman GD, Miller CA, Young TI, Thulborn KR
(1993): MR quantification of cerebral ventricular volume using a semiautomated algorithm. Am J Neuroradiol 14: 1373–1378.
Kahn DA, Prohovnik I, Lucas LR, Sackeim HA (1989): Disso-ciated effects of amphetamine on arousal and cortical blood flow in humans. Biol Psychiatry 25:755–767.
Kiyatkin EA, Stein EA (1995): Fluctuations in nucleus accum-bens dopamine during cocaine self-administration behavior; an in vivo electrochemical study. Neuroscience 64:599 – 617. Koepp MJ, Gunn RN, Lawrence AD, Cunningham VJ, Gagher A, Jones T, et al (1998): Evidence for striatal dopamine release during a video game. Nature 393:266 –268.
Kohler C, Hall H, Ogren SO, Gawell L (1985): Specific in vitro binding and in vivo binding of the [3
H]Raclopride: A potent substituted benzamide drug with high affinity for dopamine D-2 receptors in the rat brain. Biochem Pharmacol 34:2251– 2259.
Kuczenski R, Segal D (1989): Concomitant characterization of behavioral and striatal neurotransmitter response to amphet-amine using in vivo microdialysis. J Neurosci 9:2051–2065. Kuczenski R, Segal D (1992): Differential effects of amphet-amine and DA uptake blockers (cocaine, nomifensine) on caudate and accumbens dialysate DA and 3-methoxytyra-mine. J Pharmacol Exp Ther 239:219 –228.
Kunishio K, Haber SN (1994): Primate cingulostriatal projection: Limbic striatal versus sensorimotor striatal input. J Comp Neurol 350:337–356.
Kunzle H (1975): Bilateral projections from the prefrontal motor cortex to the putamen and other parts of the basal ganglia: An autoradiographic study in macaca fascicularis. Brain Res 88:195–209.
Lammertsma AA, Bench CJ, Hume SP, Osman S, Gunn K, Brooks DJ, Frackowiak RSJ (1996a): Comparison of methods for analysis of clinical [11
C]raclopride studies. J Cereb Blood Flow Metab 16:42–52.
Lammertsma AA, Hume SP (1996b): Simplified reference tissue model for PET receptor studies. Neuroimage 4:153–158. Laruelle M (2000): Imaging synaptic neurotransmission with in
vivo binding competition techniques: A critical review. J Cereb Blood Flow Metab 20:423– 451.
Laruelle M, Abi-Dargham A, vanDyck CH, Rosenblatt W, Zea-Ponce Y, Zoghbi SS, et al (1995): SPECT imaging of striatal dopamine release after amphetamine challenge. J Nucl Med 36:1182–1190.
Laruelle M, Iyer RN, Al-Tikriti MS, Zea-Ponce Y, Malison R,
Zoghbi SS, et al (1997): Microdialysis and SPECT measure-ments of amphetamine-induced dopamine release in nonhu-man primates. Synapse 25:1–14.
Links JM, Zubieta JK, Meltzer CC, Stumpf MJ, Frost JJ (1996): Influence of spatially heterogenous background activity on “hot object” quantitation in brain emission computed tomog-raphy. J Comput Assist Tomogr 20:680 – 687.
Logan J, Fowler JS, Volkow ND, Wolf AP, Dewey SL, Schlyer D, et al (1990): Graphical analysis of reversible radioligand binding from time activity measurements applied to [N-11
C-methyl]-(2)-cocaine PET studies in human subjects. J Cereb Blood Flow Metab 10:740 –747.
Logan J, Volkow ND, Fowler JS, Wang G-J, Dewey S, Mac-Gregor R, et al (1994): Effects of blood flow on [11
C]raclo-pride binding in the brain: Model simulations and kinetic analysis of PET data. J Cereb Blood Flow Metab 14:995– 1010.
Martinez D, Hwang DR, Broft A, Mawlawi O, Simpson N, Ngo K, et al (2000): Amphetamine-induced endogenous dopamine release in mesolimbic and nigrostriatal dopamine systems in humans using PET and [11
C]raclopride. Neuroimage 11:S19. McNair DM, Lorr M, Droppleman LF (1971): Manual for the Profile of Mood States. San Diego: Educational and Industrial Testing Service.
Meltzer CC, Kinahan PE, Greer PJ, Nichols TE, Comtat C, Cantwell MN, et al (1999) Comparative evaluation of MR-based partial volume correction schemes for PET. J Nucl Med 40:2053–2065.
Minoshima S, Berger KL, Lee KS, Mintun MA (1992): An automated method for rotational correction and centering of three-dimensional functional brain images. J Nucl Med 33: 1579 –1585.
Mintun MA, Raichle ME, Kilbourn MR, Wooten GR, Welch MJ (1984): A quantitative model for the in vivo assessment of drug binding sites with positron emission tomography. Ann Neurol 15:217–227.
Mogenson GJ, Brudzynski SM, Wu M, Yang CR, Yim CCY (1993): From motivation to action: A review of dopaminergic regulation of limbic 3 nucleus 3 accumbens 3 ventral
pallidum3pedunculopontine nucleus circuitries involved in
limbic-motor integration. In: Kalivas PW, Barnes CD, edi-tors. Limbic Motor Circuits and Neuropsychiatry. London: CRC Press, 193–236.
Nauta WJH, Domesick V (1984): Afferent and efferent relation-ships of the basal ganglia. CIBA Found Symp 107:3–29. O’Donnell P, Grace AA (1994): Tonic D2-mediated attenuation
of cortical excitation in nucleus accumbens neurons recorded in vitro. Brain Res 634:105–112.
Olds J, Milner P (1954): Positive reinforcement produced by electrical stimulation of septal area and other regions of rat brain. J Comp Physiol Psychol 47:419 – 426.
O¨ ngu¨r D, Price JL (2000): The organization of networks within the orbital and medial prefrontal cortex of rats, cats, and monkeys. Cereb Cortex 10:206 –219.
Parent A (1990): Extrinsic connections of the basal ganglia. Trends Neurosci 13:254 –258.
![Table 1. Rate of [11Fraction of Parent [C]Raclopride Metabolism during the Baseline and AMPH-Challenged Conditions, as Reflected by the Mean11C]Raclopride Remaining at Various Time Points (in Min from Tracer Injection)](https://thumb-ap.123doks.com/thumbv2/123dok/3142736.1383372/6.612.63.546.104.171/raclopride-metabolism-challenged-conditions-reflected-raclopride-remaining-injection.webp)