KEY WORDS:Point Cloud, Cloud Computing, Change Detection, Mobile Mapping, LiDAR
ABSTRACT:
Change detection has long been a challenging problem although a lot of research has been conducted in different fields such as remote sensing and photogrammetry, computer vision, and robotics. In this paper, we blend voxel grid and Apache Spark together to propose an efficient method to address the problem in the context of big data. Voxel grid is a regular geometry representation consisting of the voxels with the same size, which fairly suites parallel computation. Apache Spark is a popular distributed parallel computing platform which allows fault tolerance and memory cache. These features can significantly enhance the performance of Apache Spark and results in an efficient and robust implementation. In our experiments, both synthetic and real point cloud data are employed to demonstrate the quality of our method.
1. INTRODUCTION
The acquisition of point cloud data continuously becomes more convenient and more economical due to the great development of surveying technologies such as mobile mapping [Tao and Li, 2007]. Mobile mapping employs a vehicle with mounted laser scanners, panorama cameras, GPS (global positioning system), and IMU (inertial measurement unit) together to collect geospa-tial data. Not only can mobile mapping deliver a low-priced ac-quisition with high density and accuracy, the entire process is much faster than traditional LiDAR and a big volume of data can be produced in a moment, e.g., up to 500,000 points per sec-ond [ABA Surveying, 2015]. Such large datasets can cause the classical data processing methods inadequate due to a high de-mand for computing resources, which encourages new approaches to fill the gap.
Change detection of LiDAR data is still quite difficult although many methods have been proposed over the last few decades [M´emoli and Sapiro, 2004, Richter et al., 2013, Lindenbergh and Pietrzyk, 2015]. First, LiDAR data is a discrete format by sam-pling on continuous object surfaces, and thus surface reconstruc-tion [Kazhdan et al., 2006] is often required. Second, different types of errors are inevitable such as missing points caused by blocking and misalignment in point cloud registration. Moreover, data sets acquired using different devices can vary in sampling density and distribution. Last but not least, the methods should be efficient enough to compensate for the increasing data vol-ume. These aforementioned factors can seriously affect the per-formance of change detection, which makes the problem fairly challenging.
In this paper, we present a method using cloud computing tech-nologies to address the problem of change detection in the con-text of big data. We employ Apache Spark [Zaharia et al., 2010] as the distributed computing framework to implement the whole method. Voxel grid [Curless and Levoy, 1996] and resilient dis-tributed datasets [Zaharia et al., 2012] intertwined naturally in the framework contribute to the proposed method which is able to process a large data set efficiently. In summary, this paper makes the following two contributions:
∗Corresponding author.
1. proposing an efficient method to detect changes in mobile LiDAR data,
2. demonstrating the great potential of Apache Spark on large LiDAR data processing.
In the experiments, both synthetic and real mobile LiDAR data are used to evaluate the accuracy and the efficiency of the pro-posed method.
This paper is organized as follows. Previous work on change de-tection is briefly discussed in Section 2. Section 3 presents our method and Section 4 explains implementation details. Experi-mental results are analysed in Section 5. Section 6 concludes and close the paper.
2. RELATED WORK
A theoretical and computational framework has been proposed in [M´emoli and Sapiro, 2004] for comparing point clouds. The un-derlying framework is based onGromov-Hausdorff distance and embedded in a probabilistic setting. Gromov-Hausdorff distance generalizes Hausdorff distance to compare two compact metric spaces with respect to all isometric embedding. Therefore, the framework can compare two point clouds using certain isomet-ric deformation. However, computing a discrete approximation of Gromov-Hausdorff distance is not straightforward. Pairwise geodesic distances between points are required, which introduces efficiency issue.
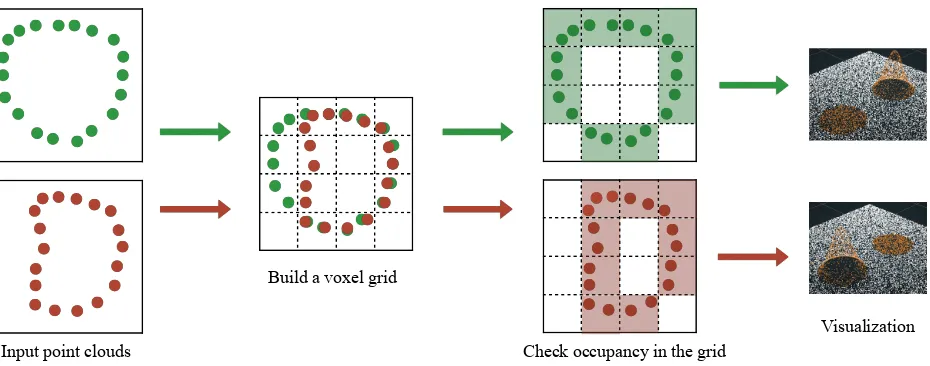
Input point clouds
Visualization Build a voxel grid
Check occupancy in the grid
Figure 1. The figure outlines the algorithm to compare the geometry of two point clouds. A voxel grid is built based on the point clouds. Geometry differences of the point clouds can be computed by comparing occupancy status of each voxel with respect to the two point clouds. The rightmost column visualizes the computed geometry differences which are illustrated as orange dots in the figure.
Recent approaches on change detection in laser scan data were reviewed in [Lindenbergh and Pietrzyk, 2015]. Major existing difficulties are studied including local varying properties of point cloud, registration, varying view points during acquisition, and temporary objects. In the report, methods are categorized into two groups. i.e., pure binary change detection methods and de-tection methods that quantify changes. Our proposed method in Section 3 belongs to the former category. A variety of applica-tions based on change detection are discussed as well, e.g., struc-tural monitoring, forestry, geomorphology, and urban changes. Readers can also refer to [Xiao et al., 2015] for a brief overview on change detection methods from different fields such as remote sensing and photogrammetry, computer vision, and robotics.
Our method is similar to the approach proposed in [Barber et al., 2008] which is based on anoctree. On the other hand, we em-ploy avoxel gridand implement entire method by means of cloud computing. The differences between an octree and a voxel grid and the reasons of applying a voxel grid in our work are further investigated in Section 3.2.
3. OUR METHOD
In this section, the research problem is formulated first and after-wards our proposed method is explained in detail.
3.1 Problem Statement
The purpose of our research work is to detect spatial changes of mobile LiDAR data automatically. Concretely, for example, we have two LiDAR data collections of the same city region which are captured at different dates even using different mobile map-ping systems. The earlier acquired data set is chosen as the ref-erence, and the newer one is selected as the target. Change de-tection is performed to obtain differences in the target regarding the reference. As a reference and a target are exchangeable, we will address a more general problem, difference detection without distinguishing a reference and a target.
LetP1 andP2 be two point clouds inR proposed method takes the two point clouds as inputs, performs difference detection, and assigns a label to each point. The out-puts of the method are two sets,Q1={(pi, li)|pi∈P1andli∈
{0,1}}andQ2 ={(pj, lj)|pj ∈P2andlj ∈ {0,1}}, where li andlj are the labels for points and equal either1or0. The
value 1 indicates the point ‘exists’ in the other point cloud while the value 0 indicates the point does not ‘exist’ in the other point cloud. Such ‘existence’ is defined in a sense of geometry, which will be explained in more detail in Section 3.2.
3.2 Algorithm for Difference Detection
As stated previously in Section 3.1, the input of our method are two point clouds without further assumption such as sampling density and distribution. The aim of our method is to compute geometry differences between the input point clouds.
The algorithm for difference detection is outlined in Figure 1. Given the input point cloudsP1 (green) andP2 (red), a voxel grid is built. A voxel grid, which is a regular grid in three-dimensional space, is popularlly used in computer graphics, espe-cially in 3D reconstruction [Curless and Levoy, 1996] and render-ing [Fujimoto et al., 1986]. To construct the grid, the minimum bounding box of the two point clouds is computed first and then the box is partitioned regularly by voxels within the same size. In our algorithm, the voxel size is a parameter prescribed by users to control the resolution of detected geometry differences. A voxel
visoccupiedby point cloudPif and only if some pointp∈P
is located in the voxelv. Furthermore, an occupied voxelvmust be one of the three following cases:
1. occupied byP1only,
2. occupied byP2only,
3. occupied by bothP1andP2.
In our algorithm, a labellis assigned to each pointpby checking such occupancy information. Concretely, for a pointpi ∈ P1, letvibe the voxel wherepiis located in, the labelliforpiis
evaluated as1(0) ifviis case 3 (case 1). P2 can be labeled similarly as well. Thus, the outputQ1andQ2are obtained.
implementation are discussed in Section 4.
4. IMPLEMENTATION
We implement our method based on Apache Spark [Zaharia et al., 2010] which is a popular open-source platform for large-scale data processing. Implementation details are given in this section.
4.1 Apache Spark
Apache Spark [Zaharia et al., 2010] is a fast and general-purpose cluster computing library. Similar to Hadoop [White, 2009], it supports the well-known MapReduce [Dean and Ghemawat, 2008] paradigm. As a primary abstraction in Apache Spark, the resilient distributed dataset (RDD) plays a key role to organize data and achieve parallel computation. An RDD can be consid-ered as a list of elements of the same type. In general, an RDD is partitioned into pieces distributed to cluster nodes. Each piece has several copies in different nodes in order to realize fault tol-erance. In addition, an RDD can be cached in memory which is different from Hadoop. This feature dramatically enhances the performance of Apache Spark, especially for applications with iterative operations. In Apache Spark, several convenient built-in libraries are available built-includbuilt-ing Spark SQL for structured data processing and MLib for machine learning applications. It pro-vided APIs in Java, Scala, Python and R, and we use Scala in our implementation.
4.2 RDD operations
To recapitulate briefly, the core of our method is detecting geom-etry differences between point clouds by means of a voxel grid. Once the voxel grid is created, voxel occupancy is examined. To implement the occupancy checking, a straightforward way is to create two 3D arrays of the same size respectively recording voxel occupancy status for each point cloud. Afterwards, geometry dif-ferences can be obtained by comparing values in the two 3D ar-rays. Indexing of such arrays is very efficient in single machine setup, whereas in our distributed setup it is impossible due to discontinuous memory storage. Moreover, occupied voxels are fairly sparse in the voxel grid and only a small portion of voxels holds points. Therefore, the 3D arrays contain many empty items and can waste lots of memory.
A solution possible for our platform is to create two RDDs con-sisting of voxels occupied by the two point clouds respectively. Differences can be computed by applying set operations on the two RDDs such as union, intersection, and complementation. We implement such idea in an equivalent way based on Apache Spark. A key is assigned to each point to generate a key-value pair and the key is chosen as theMorton codeof the voxel where the point is located in. The Morton code can be easily computed as voxel grid is used in our method (see Section 4.3). The key-value pairs are collected using the cogroup functionality provided by Apache Spark and finally geometry differences can be derived from the
Q2←cogroup(PairRDD2,PairRDD1)
Figure 2. A 2D illustration of morton code.
In our implementation, Morton code [Morton, 1966] is used for key assignment. Morton code is a function mapping high-dimensi-onal data to 1-dimensihigh-dimensi-onal space while preserving locality. A 2D case of Morton code is shown in Figure 2. A square is partitioned by a4×4grid. Each cell can be labeled using a pair of integers, e.g., the top-left cell is labeled as(0,0). If the integers are writ-ten in binary, interleaving the two integers to generate another integer can produce an order for cells in the grid. For example, given an integer pair(d2
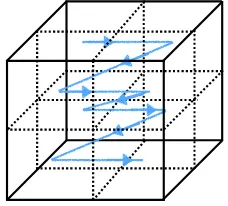
is generated. Such order is illustrated as the blue line in Figure 2. Since the line has a Z-shape, Morton code is also named Z-order. Morton code of voxels in a 3D voxel grid can also be computed in a similar way and Figure 3 displays the Z-curve in a2×23D voxel grid.
Figure 3. A 3D illustration of morton code.
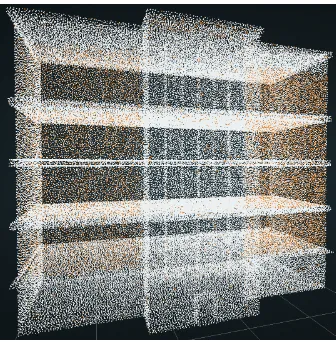
4.4 Visualization
Figure 4. The figure is a snapshot of the Potree user interface. The 3D data shows London Bloomsbury area. The color encodes the height information
render, especially for large point data sets. Its user interface is similar to most of computer graphics modeling tools as shown in Figure 4. Potree supports level of detail and is able to render a large point set interactively by virtue of a special octree structure implemented inside. In our experiments, the biggest point cloud manipulated in Potree has about 1 billion points.
5. EXPERIMENTAL RESULTS
We first conduct a sanity check using two synthetic point clouds as illustrated in Figure 5. The two point clouds are generated by randomly sampling on two Gaussian surfaces with different peaks. The orange dots represent geometry differences detected by our method correctly as expected.
(a) (b)
Figure 5. The point clouds representing two Gaussian surfaces with different peaks.
(a) (b)
Figure 6. Two exactly same building models except the right one does not have part of the facade.
An important aim of this work is to detect changes in city build-ings. Such changes are fairly difficult to detect by using airborne
Figure 7. The change detection result of the two models shown in Figure 6. The change is represented by orange dots.
LiDAR or satellite images. As illustrated in Figure 6, two build-ing models are exactly same except that part of the facade in the right one is knocked down. This is a common scenario occur-ring in most of cities. By using these two models, we obtain two point clouds by random sampling and perform our change detec-tion method on the generated point clouds. The result shown in Figure 7 indicates a successful detection of the missing part of the building.
We also apply our method on two mobile LiDAR data sets cap-tured around London Bloomsbury area at different times by dis-tinct acquisition systems. One of the two data set is illustrated in Figure 4. Figure 8 illustrates the results of change detection for a building in Bloomsbury. The left figure shows the building be-fore refurbishment, and the right one displays the same building under refurbishing without walls and windows.
(a) (b)
Figure 8. (a) shows a building before refurbishment and the rect-angle highlights a piece of wall before knocking down. (b) dis-plays the same building under refurbishing. The small rectangle highlights the detected floor as no wall can obstruct laser from scanners. The big rectangle highlights the scaffold.
6. CONCLUSIONS
Barber, D., Holland, D. and Mills, J., 2008. Change detection for topographic mapping using three-dimensional data structures. International Archives of Photogrammetry, Remote Sensing and Spatial Information Sciences 37(B4), pp. 1177–1182.
Curless, B. and Levoy, M., 1996. A volumetric method for build-ing complex models from range images. In: Proceedings of the 23rd Annual Conference on Computer Graphics and Inter-active Techniques, SIGGRAPH ’96, ACM, New York, NY, USA, pp. 303–312.
Dean, J. and Ghemawat, S., 2008. Mapreduce: Simplified data processing on large clusters. Commun. ACM 51(1), pp. 107–113.
Fujimoto, A., Tanaka, T. and Iwata, K., 1986. Arts: Accelerated ray-tracing system. IEEE Computer Graphics and Applications 6(4), pp. 16–26.
Kazhdan, M., Bolitho, M. and Hoppe, H., 2006. Poisson sur-face reconstruction. In: Proceedings of the fourth Eurographics symposium on Geometry processing, Vol. 7.
Laine, S. and Karras, T., 2011. Efficient sparse voxel octrees. Vi-sualization and Computer Graphics, IEEE Transactions on 17(8), pp. 1048–1059.
Lindenbergh, R. and Pietrzyk, P., 2015. Change detection and deformation analysis using static and mobile laser scanning. Ap-plied Geomatics 7(2), pp. 65–74.
M´emoli, F. and Sapiro, G., 2004. Comparing point clouds. In: Proceedings of the 2004 Eurographics/ACM SIGGRAPH sym-posium on Geometry processing, ACM, pp. 32–40.
Morton, G. M., 1966. A computer oriented geodetic data base and a new technique in file sequencing. International Business Machines Company New York.
Potree, 2015. Potree,https://github.com/potree/potree.
Richter, R., Kyprianidis, J. E. and D¨ollner, J., 2013. Out-of-core gpu-based change detection in massive 3d point clouds. Transac-tions in GIS 17(5), pp. 724–741.
Tao, C. V. and Li, J., 2007. Advances in mobile mapping tech-nology. CRC Press.
White, T., 2009. Hadoop: The Definitive Guide. 1st edn, O’Reilly Media, Inc.