Grassland desertification by grazing and the resulting
micrometeorological changes in Inner Mongolia
Sheng Gong Li
a,∗, Yoshinobu Harazono
b,1, Takehisa Oikawa
a,2,
Ha Lin Zhao
c,3, Zong Ying He
c,3, Xue Li Chang
c,3 aInstitute of Biological Sciences, University of Tsukuba, Tsukuba 305-8572, Ibaraki, JapanbNational Institute of Agro-Environmental Sciences, Tsukuba 305-8604, Ibaraki, Japan cInstitute of Desert Research, Chinese Academy of Sciences, Lanzhou 730000, Gansu, China
Received 9 June 1999; accepted 11 January 2000
Abstract
Overgrazing is one of the most primary causes of desertification in semi-arid zones of China. From 1992 to 1994 we conducted a grazing experiment in Naiman (lat. 42◦58′N, long. 120◦43′E, 345 m asl), Inner Mongolia, China to elucidate
desertification mechanisms. Our experimental field, which was covered with some short grasses, legumes and forbs, included four plots where grazing sheep numbers differed (0, 3, 6, or 9 individuals). Micrometeorological measurement data were analyzed using the Bowen ratio energy balance method. Ground surface reflectivity (albedo) increased with grazing intensity. The overgrazed plot had been desertified after 3 year’s grazing experiment. Albedo can be regarded as an important indicator of potential grassland desertification. When desertification occurs, then albedo will exceed a critical value. Partitioning of net radiation exhibited distinct patterns among the four plots as a result of the interplay between albedo and in situ vegetation. Ratios of the net radiation or net available radiation to solar radiation tended to decrease with increasing grazing intensity. But this pattern of changes was largely affected by soil moisture regime and vegetation status during the measurements. Grazing also remarkably affected wind regimes over the grazing experimental plots through altering surface roughness. Especially, sustained overgrazing decreased surface roughness length so substantially that wind could act directly on sandy grassland surface to initiate desertification. A permissible grazing capacity of the studied temperate semi-arid grassland was also proposed for future grassland management. © 2000 Published by Elsevier Science B.V. All rights reserved.
Keywords: Grassland; Grazing intensity; Micrometeorology; Desertification; Albedo
∗Corresponding author. Fax:+81-298-53-2530.
E-mail addresses: [email protected]
(S. Gong Li), [email protected] (Y. Harazono),
[email protected] (T. Oikawa), [email protected] (H.L. Zhao)
1Fax:+81-298-38-8211. 2Fax:+81-298-53-6661. 3Fax:+86-931-8847524.
1. Introduction
Desertification is the process of deterioration in ecosystems of arid and semi-arid areas resulting from interplays of climatic variations and human activ-ities (Dregne, 1985; UNEP, 1992). Desertification and its influence on regional environmental change have become the research focus of many scholars in the past few decades. Charney (1975) and Charney et al. (1975, 1977) suggested that the drought and
dynamics of deserts in the Sahara be controlled by a biogeophysical feedback mechanism. Biological feedbacks play an important role in desertification worldwide (Schlesinger et al., 1990). Deforestation and resulting hydrological changes of land surface affect regional and even global climates (e.g. Shukla and Mintz, 1982; Shukla et al., 1990; Nobre et al., 1991; Wright et al., 1992). Some GCMs suggest that future global warming will likely exacerbate the degradation of semi-arid grasslands on a large scale in North America and Asia (Manabe and Wetherald, 1986). It is also true in the arid and semi-arid zones of Northern China that deforestation and afforestation affect the regional pattern of precipitation and tem-perature regime (Chen et al., 1992; Lin et al., 1993). For example, in the Horqin Steppe, the desertified grassland area is still expanding due to inappropriate anthropogenic activities such as prolonged overgraz-ing, poor farmland management and over-lumbering (Zhu and Wang, 1992). Vegetation plays very impor-tant roles in mass and heat exchange between land surfaces and the atmosphere (Grace et al., 1981). Removal or deterioration of vegetation cover affects water and heat budget of the surfaces. Therefore, in the desertification-prone areas such as the Horqin Steppe, it is requisite to conduct research on the re-lationship between desertification (mainly caused by degradation of vegetation) and micrometeorological changes. The primary objectives of this paper are: (1) to describe impacts of different levels of grazing intensity on the micrometeorological characteristics of grassland; and (2) to assess initiation of grassland desertification under increasing overgrazing.
2. Materials and methods
2.1. Site descriptions and instrumentation
The studied area is located at Daliushu village
(lat. 42◦58′N, long. 120◦43′E, 345 m above mean sea
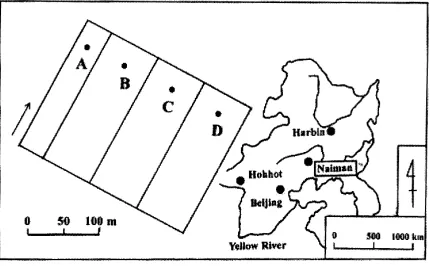
level), Naiman, Inner Mongolia, China, in a zone of continental semi-arid monsoon climate (Fig. 1). The mean meteorological conditions are summarized as follows by Liu et al. (1997): The mean annual solar
radiation is 5200 MJ m–2. The total annual sunshine
duration is about 2946 h. The mean annual air
tem-perature is about 6.4◦C, and the coldest and warmest
Fig. 1. Location of measurement field. Plots A, B, C, and D represent the ungrazed plot, the lightly grazed plot, the moderately grazed plot, and the overgrazed plot at Daliushu village, Naiman, Inner Mongolia, respectively. The dots in the plots indicate the micrometeorological measurement sites. The arrow beside the plots indicates the prevailing wind direction during the measurements.
monthly mean temperatures are−13.1◦C of January
and 23.7◦C of July, respectively. The mean annual
accumulated air temperature above 10◦C ranges
from 3000 to 3400◦C days. The frost-free period is
ca. 137–150 days per year. The normal annual pre-cipitation is about 362 mm, nearly 70% of which falls from June through August. The annual mean pan-evaporation is around 1935 mm. Prevailing wind directions are northwest in winter and spring, and southwest to south in summer and autumn. The mean
annual wind-speed ranges from 3.4 to 4.1 m s−1. The
threshold for sand movement, 5 m s−1, is exceeded
during more than 200 days per year (mainly in spring
and winter). Gales (wind speed≧17.2 m s−1) occur
from 16.9 to 24.1 days per year. The geomorpho-logic landscape in this region is characterized by sand dunes alternating with gently undulating interdunal lowlands where farmlands and residential points are distributed. The zonal soils are sandy with light yel-low color, coarse texture and loose structure. The sandy land is classified into three grassland types: shifting, semi-fixed and fixed. The dominant plant in the shifting sand dunes is Agriophyllum squarrosum. The dominant plant in the semi-fixed sandy land is
Artemisia halodendron, with lesser numbers of Agrio-phyllum squarrosum, Artemisia scoparia, Lespedeza davurica, Caragana microphylla, Hedysarum fruti-cosum var. ligosum, and Salix gordejevii. The major
micro-phylla, Lespedeza davurica, Artemisia frigida and
some grasses.
Sandy grassland in Naiman region is ecologically fragile and is subject to desertification. There are many quantitative and/or qualitative criteria for assessing the degree of desertification (e.g., Mabbutt, 1984, 1986; Dregne, 1985, 1991; Zhu et al., 1989). Zhu’s crite-ria were used in the field to judge whether or not grassland had been desertified. Desertification initiates when wind erosion and sand accumulation occur in the grassland. If vegetation coverage was reduced to 30–50% and area of shifting sand accounts for about 5–20% the total grassland area, then the grassland was regarded as moderately desertified. If vegetation cov-erage was reduced to 10–30% and area of shifting sand accounts for about 20–50% the total grassland area, then the grassland was regarded as severely deserti-fied. If vegetation coverage was reduced to less than 10% and area of shifting sand accounts for more than 50% the total grassland area, then the grassland was regarded as very severely desertified. Grazing density for studied sandy grassland was about five to eight sheep or sheep equivalents before a treatment of en-closure (Zhao, 1992).
In 1992 we chose open and level interdunal sandy grassland as the observation site; the vegetation at this site has been slightly desertified due to poor environ-mental management. Dominant plants are graminoids, accompanied by some legumes and forbs; shrubs and semi-shrubs are few. In the middle of this site, an area of 5.24 ha was fenced with cement piles and barbed wires as the grazing experiment field. This field was further divided into four plots according to grazing sheep numbers, i.e., Plot A, ungrazed (0); Plot B, lightly grazed (three sheep), Plot C, moderately grazed (six sheep), and Plot D, overgrazed (nine sheep). Plot
A was 0.74 ha (200×37 m) and each of the other three
plots had an area of 1.5 ha (200×75 m). The long sides
of these plots were set along the dominant wind di-rection of growing season to guarantee sufficient fetch for meteorological measurements. Grazing was started on 1 June and ended on 30 September each year for 3 years from 1992. From 1991 to 1994 micrometeoro-logical measurements were conducted at the unfenced grassland (Plot E), which was located roughly at the middle of the experimental field before enclosure, at each of the experimental grazing plots, and at a mobile sand dune (Plot F). The dune was about 1 km to the
northeast of the grazing plots. The fetch at the dune measurement site was more than 800 m. These mea-surements were each made on intermittent clear days (generally 3–5 days) in growing season across each of the study years, and the measurements were not con-ducted simultaneously. The monthly mean precipita-tion during the measurements is shown in Table 1.
Wind profiles and wind directions were mea-sured with photo-electric cup anemometers (Makino,
AF750S, Tokyo, Japan, accuracy±3% at 1–10 m s−1)
and a photo-electric anemoscope (Makino, VF016,
Tokyo, Japan, accuracy ±3%). Air temperatures
and relative humidity were measured with type-T thermocouple thermometers (ventilated, fan speed
>3.5 m s−1, accuracy ±0.1◦C) and electrostatic
ca-pacitive humidity sensors that were shielded by white plastic covers against direct sunshine (North Hightech
Co. Ltd., HU-1A, Sapporo, Japan, accuracy ±3% at
25◦C and in 30–90% relative humidity). The wind, air
temperature, and humidity sensors were mounted on a 6 m mast. Solar radiation and reflected solar radiation were measured with thermal-charged pyranometers
(Iio, S-SR2, Tokyo, Japan, accuracy±3%). Net
radi-ation was measured with a ventilated net radiometer
(EKO, CN-11, Tokyo, Japan, accuracy±3% at −15
to 40◦C). Soil heat flux was measured with soil heat
plates (EKO, CN-9, Tokyo, Japan, accuracy ±5%
at−20 to 120◦C). Soil temperatures were measured
with copper-constantan thermocouple sensors. Mea-surement height or depth (minus) above dune surface or grass community surfaces were 5.0, 2.5, 1.4, 0.7, 0.3 m for the wind profiles, 5.0 m for wind direction, 1.4 and 0.3 m for air temperature and humidity, 1.3 m for solar radiation, 1.2 m for net radiation, 1.0 m for
reflected solar radiation,−0.01 m for soil heat plates,
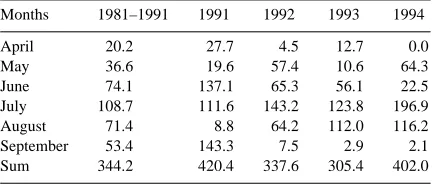
Table 1
Monthly mean precipitation (mm) from April to September during the measurements and monthly mean precipitation from 1981 to 1991
Months 1981–1991 1991 1992 1993 1994
April 20.2 27.7 4.5 12.7 0.0
May 36.6 19.6 57.4 10.6 64.3
June 74.1 137.1 65.3 56.1 22.5
July 108.7 111.6 143.2 123.8 196.9
August 71.4 8.8 64.2 112.0 116.2
September 53.4 143.3 7.5 2.9 2.1
−0.01,−0.05,−0.1, −0.2 and−0.5 m for soil tem-peratures, respectively. Data were digitally recorded once every 2 min in a data logger (North Hightech Co. Ltd., IDL3200, Sapporo, Japan). Wind data and radi-ation data were averaged before recording, and other data were instantaneous values at recording time. The hardness of soil surface at the grazing experimental plots was measured in August 1994 with a hardness meter (Yamanaka-07202301, Fujiwara Scientific Co. Ltd., Tokyo, Japan). A portable power generator was placed ca. 50 m leeward of the mast for power supply. The sensors for micrometeorological measure-ment were calibrated in 1990 at National Insti-tute of Agro-Environmental Sciences (NIAES). The photo-electric cup anemometers were cross calibrated in a wind tunnel of NIAES. The platinum resistance thermometers and the type-T thermocouple ther-mometers were cross calibrated in comparison with an enclosed scale type thermometer certificated by Japan Meteorological Agency, and the correction factor of each sensor was determined to remove systematic difference among the thermometers. The instrumen-tal offsets of the pyranometers and radiometer were also examined at the roof floor of NIAES. Correction factor of each sensor was determined through each calibration curve. The same procedure was made each year in Naiman Station of Desertification Research of Chinese Academy of Sciences or NIAES before field measurements.
2.2. Methods
The heat budget over both the plant communities (both on the unfenced grassland and the experimental grazing plots) and the surface of the sand dune is given by
Rn=H+lE+G (1)
where Rnis net radiation (W m−2), H is sensible heat
flux (W m−2), lE is latent heat flux (W m−2) (l is latent
heat of vaporization of liquid water and E is evapo-transpiration rate), and G is heat flux to and from the
soil (W m−2). In general, Rnis positive in daytime and
negative at night. The sign convention for H, lE and G adopted here is such that each of the vertical fluxes H,
lE and G is positive upwards and negative downwards.
According to the Bowen ratio method (Thom, 1975),
H= (Rn−G)
in whichβ is the Bowen ratio,γ is the psychometric
constant, Ta1and Ta2 are the air temperatures at two
levels, and e1and e2are the corresponding water vapor
pressures at the two levels. Thus if the air temperatures
and water vapor pressures are known, and Rn and G
are obtained by direct measurement, then H and lE can be calculated from Eqs. (2) and (3), respectively. Under neutral conditions, the vertical wind shear or wind-speed gradient over uniform, level ground or over a plant community of uniform height can be de-scribed by (Thom, 1975),
where u is the mean wind-speed at height z; u∗ is
the friction velocity(u∗=(τ/ρ)0.5),τ is the surface
shear stress; k is von Karman’s constant (0.41); d is the zero-plane displacement, usually 0.6–0.7 of the plant
height (Grace, 1977); and zo is called the roughness
length of the surface, often equaling about 10% of the
length of surface protuberances (Grace, 1977). u∗, d,
and zo were computed from the measured wind
pro-files under almost neutral atmospheric stability (abso-lute values of the gradient Richardson number were less than 0.05) by means of the least squares method (reiteration calculation) (Harazono et al., 1992):
ln(z−d)=a×u(z)+b (7)
u∗=
k
a (8)
zo=exp(b) (9)
zo=
0.016u2∗
g (10)
where g is the gravitational constant.
2.3. Data processing
The following criteria were adopted for data se-lection and analysis. (1) Most data were observed in fine days or in a bit cloudy days. (2) Wind directions
were mainly southwest to south (180–240◦). In case of
the ungrazed plot, wind angles were within 194–232◦.
(3) Data obtained when wind speed was smaller than
0.5 m s−1 were rejected. (4) Missing meteorological
data were filled via interpolation between earlier and later measurements. (5) Mean values of 30 min in day-time were used for analysis.
3. Results
3.1. Reflectivity (albedo)
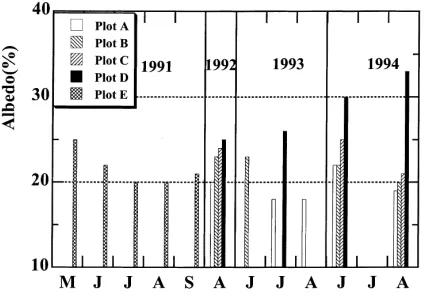
As shown in Fig. 2 and Table 2, the reflectivity of the unfenced grassland (Plot E) in 1991 was higher in May (25%) due to lower vegetation coverage (20%), whereas it became lower in August when plants were growing densely with higher coverage (70%). After enclosure in 1992, albedo was slightly decreased at the ungrazed plot (Plot A) and the lightly grazed plot (Plot B), increased little at the moderately grazed plot
Fig. 2. Changes in albedo of the plots A, B, C, D, and E. An enclosure treatment was started in 1992.
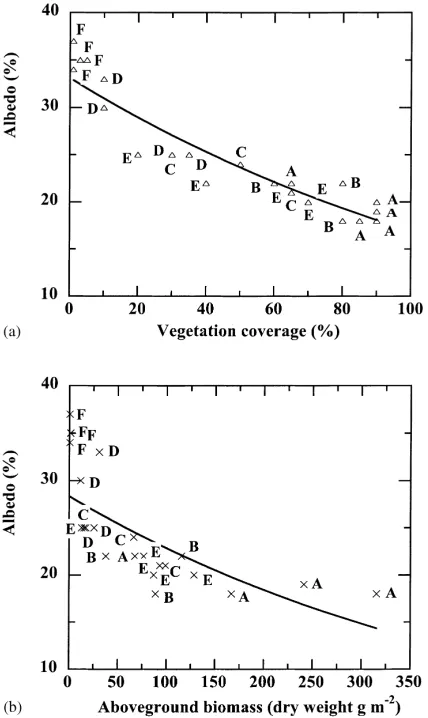
(Plot C), and increased substantially at the overgrazed (Plot D). Consecutive observations after the substan-tial rain events demonstrated that albedo decreased by 3–5% at Plot B, 18–23% at Plot D, and 14–17% at Plot F in comparison with those before the rains. It took less time for the albedo to return to its pre-rainfall values at Plots D and F than at Plot B when met a clear day with a bit strong wind after rain. Albedo was satisfactorily expressed as negative exponential func-tions of aboveground biomass and vegetation coverage (Fig. 3), independent of the plots and the measurement time.
3.2. Heat budget components
Table 3 shows daytime integrated values of energy components and partitioning of the net available radi-ation into the sensible heat and latent heat fluxes. The thermal properties of grassland surfaces demonstrated following changes:
1. Inter-seasonally, ratios of net radiation, Rn, or net
available energy, Rn–G, to incoming solar
radia-tion, Rs, tended to decrease with increase of
graz-ing intensity. For example, the fractions of the net available radiation versus solar radiation in August 1994 were 55% at Plot A (4 August 1994), 53% at Plot B (9 August 1994), 36% at Plot C (23 August 1994), and 20% at Plot D (11 August 1994), re-spectively. Intra-seasonally, these ratios were lower at the beginning of plant growth (May and June, dry seasons) and higher during rapid growth peri-ods (July and August, rainy seasons).
2. In the heat budget, the contribution of latent heat exchange, expressed as evaporative fraction, i.e.,
lE/(Rn–G), tended to decrease with increasing
in-tensity of grazing. For example, it was 37% at Plot A (10 June 1994), 20% at Plot C (4 June 1994), and 15% at Plot D (2 June 1994), respectively. There was only 0.3 mm rainfall in nearly 2 weeks before these measurements were done, indicating similar soil surface conditions at these plots.
3. The mobile sand dune, which can be regarded as an extreme of the desertified grassland, had lower
values of Rn/Rsor (Rn–G)/Rs due to higher albedo
as compared to grassland.
4. Removal of grazing or decrease of grazing
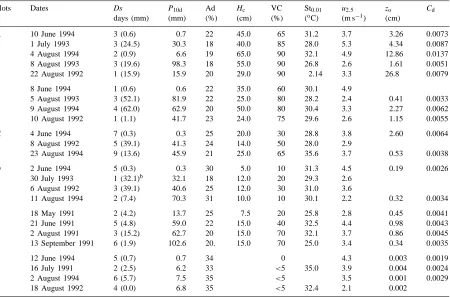
Table 2
Days after rains (Ds, data in parenthesis are amount of rainfall in mm), rainfalls within 10 days before measurements (P10d in mm), mean albedo from 10 a.m. to 15 p.m. (Ad in %), mean canopy heights (Hcin cm), mean vegetation cover (VC in %), daytime mean soil temperatures at 0.01 m depth (St0.01,◦C), daytime mean wind speeds at 2.5 m above the surfaces (u2.5m s−1), roughness lengths (zo, cm) and the drag coefficients in daytime (Cd) at the measured sites are also shown for later discussiona
Plots Dates Ds P10d Ad Hc VC St0.01 u2.5 zo Cd
days (mm) (mm) (%) (cm) (%) (oC) (m s−1) (cm)
A 10 June 1994 3 (0.6) 0.7 22 45.0 65 31.2 3.7 3.26 0.0073
1 July 1993 3 (24.5) 30.3 18 40.0 85 28.0 5.3 4.34 0.0087
4 August 1994 2 (0.9) 6.6 19 65.0 90 32.1 4.9 12.86 0.0137
8 August 1993 3 (19.6) 98.3 18 55.0 90 26.8 2.6 1.61 0.0051
22 August 1992 1 (15.9) 15.9 20 29.0 90 2.14 3.3 26.8 0.0079
B 8 June 1994 1 (0.6) 0.6 22 35.0 60 30.1 4.9
5 August 1993 3 (52.1) 81.9 22 25.0 80 28.2 2.4 0.41 0.0033
9 August 1994 4 (62.0) 62.9 20 50.0 80 30.4 3.3 2.27 0.0062
10 August 1992 1 (1.1) 41.7 23 24.0 75 29.6 2.6 1.15 0.0055
C 4 June 1994 7 (0.3) 0.3 25 20.0 30 28.8 3.8 2.60 0.0064
8 August 1992 5 (39.1) 41.3 24 14.0 50 28.0 2.9
23 August 1994 9 (13.6) 45.9 21 25.0 65 35.6 3.7 0.53 0.0038
D 2 June 1994 5 (0.3) 0.3 30 5.0 10 31.3 4.5 0.19 0.0026
30 July 1993 1 (32.1)b 32.1 18 12.0 20 29.3 2.6
6 August 1992 3 (39.1) 40.6 25 12.0 30 31.0 3.6
11 August 1994 2 (7.4) 70.3 31 10.0 10 30.1 2.2 0.32 0.0034
E 18 May 1991 2 (4.2) 13.7 25 7.5 20 25.8 2.8 0.45 0.0041
21 June 1991 5 (4.8) 59.0 22 15.0 40 32.5 4.4 0.98 0.0043
2 August 1991 3 (15.2) 62.7 20 15.0 70 32.1 3.7 0.86 0.0045
13 September 1991 6 (1.9) 102.6 20. 15.0 70 25.0 3.4 0.34 0.0035
F 12 June 1994 5 (0.7) 0.7 34 0 4.3 0.003 0.0019
16 July 1991 2 (2.5) 6.2 33 <5 35.0 3.9 0.004 0.0024
2 August 1994 6 (5.7) 7.5 35 <5 3.5 0.001 0.0029
18 August 1992 4 (0.0) 6.8 35 <5 32.4 2.1 0.002
aPlots A, B, C, D, E, and F represent the ungrazed plot, the lightly grazed plot, the moderately grazed plot, the overgrazed plot, the unfenced grassland, and the mobile sand dune, respectively.
bThere was also a 10.2 mm rainfall during the measurement.
and lE/(Rn–G) compared with those values before
enclosure.
5. These changes above-mentioned were subject to or affected by such factors as vegetation status and soil moisture regime. Higher vegetation cover often
in-creased values of (Rn–G)/Rsand lE/(Rn–G) through
altering surface albedo. Rain increased Rn/Rs and
lE/Rnratios through wetting soil (Fig. 4), especially
at the mobile dune (Plot F, not shown) and at the
overgrazed plot (Plot D). For example, the Rn/Rs
was increased about 3% at Plot B 1 day after rain (7 August 1994), and it was increased about 20% at Plot D 1 day after rain (14 August 1994).
3.3. Wind profiles
Fig. 3. Relationships between the vegetation coverage (VC, %) and albedo (AD, %), and between the aboveground biomass (Wd, dry weight, g m−2) and albedo. The vegetation coverage was eye-estimated with the quadrat method. The aboveground biomass is monthly averaged value obtained by the quadrat har-vest method. Letters A, B, C, D, E, and F, represent the un-grazed plot, the lightly un-grazed plot, the moderately un-grazed plot, the overgrazed plot, the unfenced grassland, and the mobile sand dune, respectively. The solid lines shown are the lines of best fit with Ad=33.11 exp(−0.0067VC) (n=25, r2=0.90) and Ad=28.35 exp(−0.0022Wd) (n=23, r2=0.57).
evident in June when the experiment started and the canopy heights were lower, and it was very obvious in August when sustained grazing had occurred and vegetation was in well-grown status.
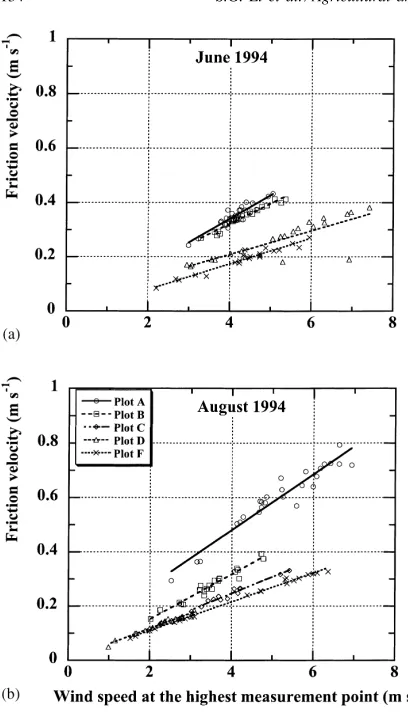
Linear relationships between mean wind speeds at
the highest measurement point, u5.0(m s−1) and
fric-tion velocity, u∗(m s−1) in daytime over the grazing
experiment plots and the mobile dune are shown in Fig. 6. Friction velocity linearly increased with
in-crease of wind speed. For a given value of u5.0, friction
velocity decreased with increasing grazing intensity. As a result of changes of canopy structure, e.g., de-crease of vegetation cover and canopy height, caused by grazing, slope of the regression equations decreased with increase of grazing intensity. This relationship can also be expressed as the drag coefficient, which
was defined as Cd=(u∗/u5.0)2. Cddecreased with
in-crease of grazing intensity as shown in Table 2. For
example, Cd was 0.0137 at Plot A (4 August 1994),
0.0062 at Plot B (9 August 1994), 0.0038 at Plot C (23 August 1994), and 0.0034 at Plot D (11 August
1994), respectively. Cd of the mobile sand dune was
lower than those of the grazing plots.
Also shown in Table 2 are the surface roughness
lengths, zo of the measured sites, which decreased
with increasing grazing intensity. For example, zo
was 12.86 cm at Plot A (4 August 1994), 2.27 cm at Plot B (9 August 1994), 0.53 cm at Plot C (23 Au-gust 1994), and 0.32 cm at Plot D (11 AuAu-gust 1994), respectively.
4. Discussion and conclusions
4.1. Albedo and grassland desertification
Reflectivity (albedo), defined as the reflected frac-tion of incident solar of natural surfaces, depends on many factors such as amount of cloud, sun an-gle, and surface features (Monteith and Unsworth, 1990). The surface albedo clearly depends on veg-etation cover, and vegveg-etation growth status (amount of aboveground biomass) as shown in Fig. 3. The fact that albedo (Ad) decreases with canopy height
(Hc) (Ad=29.28×exp(–0.0091Hc), n=24, r2=0.54)
Table 3
Daytime integrated values (MJ m−2per day) of energy components, fraction (%) of the net radiation versus the solar radiation, partitioning (%) of the net available radiation into the sensible heat and latent heat fluxes, and Bowen ratios (BOW) at the measured sitesa
Plots Dates Rs Rn G H lE Rn/Rs G/Rn (Rn-G)/Rs H/(Rn-G) lE/(Rn-G) BOW
A 10 June 1994 29.0 15.2 2.1 8.2 4.9 52 14 45 63 37 1.67
1 July 1993 29.4 18.1 2.1 61 12 54
4 August 1994 19.9 12.7 1.7 6.5 4.5 64 13 55 59 41 1.44
8 August 1993 26.3 16.6 1.4 5.1 10.1 62 8 58 34 66 0.50
22 August 1992 24.2 15.6 2.5 64 16 54
B 8 June 1994 22.2 11.1 2.7 50 24 38
5 August 1993 18.2 12.8 2.0 5.9 3.0 70 16 59 55 45 1.97
9 August 1994 17.3 10.8 1.6 6.1 3.1 62 15 53 66 34 1.97
10 August 1992 20.3 12.5 3.6 62 29 44
C 4 June 1994 26.5 12.5 2.6 7.9 2.0 47 21 37 80 20 3.95
8 August 1992 17.4 9.5 1.9 55 20 44
23 August 1994 21.5 12.4 4.7 3.1 4.6 58 38 36 40 60 0.67
D 2 June 1994 25.3 10.1 4.6 4.7 0.8 40 46 22 85 15 5.88
30 July 1993 24.2 17.3 3.3 10.6 3.4 71 19 58 76 24 3.12
6 August 1992 21.5 12.0 2.7 7.5 1.8 56 23 43 81 19 4.17
11 August 1994 15.7 7.6 4.5 1.1 2.0 48 59 20 35 65 0.55
E 18 May 1991 28.2 14.0 4.5 9.3 0.2 50 32 34 98 2 46.50
21 June 1991 29.0 17.2 4.1 9.4 3.7 59 24 45 72 28 2.54
2 August 1991 26.5 16.3 5.0 4.1 7.2 62 31 43 36 64 0.57
13 September 1991 21.6 11.3 3.0 52 27 38
F 12 June 1994 24.8 9.2 4.3 4.6 0.3 37 47 20 94 6 15.33
16 July 1991 25.9 11.1 4.4 5.1 1.6 43 40 26 76 24 3.19
2 August 1994 21.1 8.6 3.1 5.3 0.2 41 36 26 96 4 26.50
18 August 1992 22.5 9.2 4.1 41 45 23
aThe definitions of Plots A, B, C, D, E, and F are the same as those in Table 2. The empty spaces mean that data were not available because of instrument failure.
though the vegetation consumes much soil water. This feature determines how long albedo will return to its pre-rain level after a substantial rain. Therefore, grazing, overgrazing in particular, causes signifi-cant change of grassland vegetation status and hence changes albedo. Our grazing experiment demonstrates that the albedo increases with an increasing grazing intensity. Enclosure enhances the restoration of vege-tation (Zhao et al., 1997), and hence makes the albedo decrease.
From the grazing experiment we find that deserti-fication did not occur at the lightly grazed grassland (Plot B). Desertification appeared partially at the mod-erately grazed plot (Plot C) during summer and of-ten occurred during the winter period, when plants were dormant, rain events few, and strong winds oc-curred often. At the overgrazed plot (Plot D),
vege-tation cover remained lower during all four seasons of the year due to the intensive browsing and tram-pling by sheep, here wind erosion was very severe, and nearly 0.5 ha of experimental grassland had been de-sertified by the end of September 1994. According to Zhu’s four classes of desertification (Zhu et al., 1989), Plot C was moderately desertified, at least in winter and spring, while Plot D was severely desertified, and even very severely desertified in some places. Hence, with respect to vegetation cover and stock carrying ca-pacity of the grassland, albedo of the overgrazed plot (Plot D) has already reached or exceeded a threshold beyond which desertification may occur. The experi-ment demonstrates that this critical value of albedo is around 30% for the experimental grassland.
Fig. 4. Changes in albedo and the net radiation to solar radiation ratio (Rn/Rs) of the lightly grazed plot (Plot B) and the overgrazed plot (Plot D) before and after rain in August 1994. There were 62.0 mm thunder shower in the afternoon of August 6, and 45.9 mm from the late afternoon of August 13 to the early morning of August 14, indicated by R.
more slowly in growing seasons than in non-growing seasons (dormant periods) when few rainfall and frequent heavy winds create favorable conditions leading to desertification. Therefore, at the moder-ately grazed plot desertification did not occur in the growing season, but occurred to some extent in the dormant periods. Additionally, since the grassland is sandy, sustained overgrazing will ultimately turn the grassland into mobile sand dunes (an extreme form of desertification) where albedo is ca. 34–38%. In other words, during the initiation and progression of grass-land desertification, the albedo varies from 30 to 38%.
4.2. Heat fluxes and grazing intensity
With each increment of grazing intensity, plant height and vegetation cover decrease, and albedo in-creases. The increase of albedo of the grassland will cause a decrease in the net radiation that participates in the turbulent exchange of heat and mass within the near surface boundary layer. Ratio of net radiation or net available energy to solar radiation decreases with increase of grazing intensity.
Pattern of the partition of net available energy into sensible heat flux and latent heat flux in grassland is apparently affected by the grazing intensity although it is subject to other environmental factors such as
Fig. 5. Normalized wind profiles in daytime above the surfaces of the measured sites in June (upper panel) and August (lower panel) of 1994. X-axis is mean wind speeds normalized by the wind speed at the highest measurement point. Y-axis is the logarithmic heights of measurement height minus zero plane displacement height (m). Horizontal bars represent±1 s.e. Plots A, B, C, D, and F, represent the ungrazed plot, the lightly grazed plot, the moderately grazed plot, the overgrazed plot, and the mobile sand dune, respectively. Only wind speeds more than 1 m s−1 were included.
Fig. 6. Relationships between mean wind speeds at the highest measurement point and friction velocity in daytime over the grazing experiment plots and the mobile dune. The definitions of Plots A, B, C, D, E, and F are the same as those in Fig. 5. Only wind speeds more than 1 m s−1 were included. The lines of best fit shown in the upper panel are y=0.087x−0.0072, r2=0.85, n=25 for Plot A on 10 June 1994, y=0.074x+0.025, r2=0.95, n=24 for Plot B on 8 June 1994, y=0.044x+0.034, r2=0.68, n=22 for Plot D on 2 June 1994, and y=0.048x−0.016, r2=0.94, n=25 for Plot F on 12 June 1994, respectively. The lines of best fit shown in the lower panel are y=0.103x+0.070, r2=0.92, n=26 for Plot A on 4 August 1994, y=0.083x−0.014, r2=0.95, n=22 for Plot B on 9 August 1994, y=0.061x+0.0024, r2=0.96, n=16 for Plot C on 23 August 1994, y=0.057x+0.0042, r2=0.97, n=24 for Plot D on 11 August 1994, and y=0.053x+0.0029, r2=0.99, n=23 for Plot F on 2 August 1994, respectively.
moisture. Increase of sensible heat flux is attributable to stronger winds or higher surface temperatures, which occur often at the overgrazed plot and the mobile sand dune plot.
Fraction of soil heat flux in net radiation may increase with increasing grazing intensity. Violent diurnal fluctuations of surface soil temperature at the overgrazed plot and the mobile sand dune plot are associated with more gain of heat from the net radia-tion. Rain-fed surface moisture at the overgrazed plot and the mobile sand dune plot may lose more rapidly (mainly by evaporation) due to higher surface soil tem-peratures. On the contrary, at densely vegetated plots, rain-wetted surfaces may lose water slowly (mainly through transpiration) due to mulching of vegetation. Rapid lose of surface moisture may also increase probability of wind-erosion because wind-erosion is closely related with soil moisture (see Hu, 1991).
4.3. Vegetation status, wind regime and initiation of grassland desertification
Under increasingly intense grazing, in addition to marked decrease of grass layer height and coverage, the vegetation and propagatative growth of the palat-able grasses is restricted due to selective grazing by sheep (Nemoto et al., 1992, 1994; Zhao et al., 1997). Field investigation also shows that some perennials such as Pennisetum centrasiaticum and Cleistogenes
squarrosa in the overgrazed plot were replaced by
some annuals such as Setaria viridis and Aristida
adscensionis. When intense grazing and trampling
ex-ceed the ability of resistance and resilience of grasses, then the vegetation becomes degraded. Degradation of vegetation is one of the most pronounced indi-cators of grassland desertification (Grainger, 1992; Bullock et al., 1994). In addition, when entered the third year experiment stage, the overgrazed plot was invaded in some places by Agriophyllum squarrosum, which dominates in the mobile dunes and is also one of indicating species for desertification.
The heavy trampling by sheep not only affects the normal growth of plants but also renders the soil surfaces compact. Hardness values, measured by a hardness meter in our study, were 2.9, 3.5, 5.5, and
8.6 kg m–2 for the ungrazed (Plot A), lightly grazed
wind erosion in the bare places, and further affect the heat and water budgets above the community.
In order to efficiently and reasonably utilize the grassland while simultaneously restricting the inten-sity of usage to less than the capacity of grassland to resist overgrazing and also preventing desertification, therefore, definition of the proper grazing intensity or stock carrying capacity is essential. We propose that this safe or critical stocking rate be about three to four sheep or sheep equivalents per ha for the grassland studied, based on the principles that the grassland can produce sufficient biomass to meet the requirement of grazing sheep, and that the grazing intensity is prop-erly regulated to avoid desertification at the same time (Zhao et al., 1997).
Grazing, especially overgrazing, can affect the wind regime over the grazing experimental plots through al-tering the surface roughness length. As shown in Fig. 6, larger wind speeds occur near the surface of the mobile dune than the grassland, and wind speeds near the surfaces increase with increasing grazing intensity due largely to reduction of canopy height and vegeta-tion cover by sheep that leads to decrease of surface roughness lengths. At bare soil surfaces, e.g., at the dune and at some places of the overgrazed plot, larger wind will play a very important role in initiation of aeolian process.
Both the drag coefficient and the surface rough-ness length can be used to express the effectiverough-ness of the canopy to absorb downward momentum (Thom, 1975). It is clearly shown in our grazing experiment that this effectiveness increases with decrease of graz-ing intensity. As a result of absorption of momentum by vegetation, wind speeds are lower over the surfaces of the grazing plots than over the dune surface. The ex-tent of reduction in wind speed will be dependent upon the grazing intensity. Downward momentum recipient on the surface of grassland will enhance the vertical mixing near the surface while the momentum incident upon the surfaces of the dune or desertified grassland encourage aeolian process. In other word, vegetation layer protect the surfaces against direct wind action that may give rise to wind erosion, while removal of vegetation by grazing may render it possible.
Wind erosion is a process in which wind acting on the surfaces deflates, entrains and abrades sand grains, and is affected by the friction velocity (Bag-nold, 1941; Anderson and Haff, 1988). Among other
forces, lift and shear stress are most important in ae-olian process (Bagnold, 1941; Chepil and Woodruff, 1963). A higher vertical wind-speed gradient near the surface leads to lifting sand grains as a result of the Bernoulli effect, and the shear stress to move the sand grain forward (Pye and Tsoar, 1990; McE-wan and Willetts, 1993). Wind erosion can occur only when wind speeds arrive in or exceed a certain threshold to detach sand grain. Hu’s wind tunnel simulation experiment (1991) demonstrates that this
threshold is ca. 5 m s−1 for the sand in studied area.
Threshold, however, is not the unique factor to trig-ger wind erosion. He also suggested that in order to initiate wind erosion the requirements that vegetation cover be less than a critical value of ca. 60% and soil moisture be less than a critical value of ca. 2% be met.
Ground surfaces became bare and exposed to wind and water due to overgrazing and trampling by sheep, so that they were subjected to wind erosion under strong winds and to water erosion under rainstorms. In the ungrazed, lightly grazed and moderately grazed plots, wind shear cannot act directly on ground sur-faces and hence erosion is avoided due to the oc-currence of vegetation and its effective absorption of downward momentum. In contrast, at the mobile dune and overgrazed plot wind erosion occurs readily be-cause there often exists a 3–5 cm dry sand layer with water moisture less than 2% and lower vegetation cover.
5. Summary
Desertification, as a process of anthropogenic land degradation, occurs usually in the arid and semi-arid zones of the world largely because of over-utilization of natural resources and inappropriate management of environment. As an example, the Horqin Steppe, lo-cated at the northeastern China, has been suffering from desertification over the past two decades primar-ily because of overgrazing practice experienced in this region.
The grazing experiment conducted in Naiman of the Horqin Steppe shows that the ground surface albedo and the surface roughness length are two of most im-portant factors in the mechanisms of desertification. Removal or reduction of vegetation cover caused by grazing will not only increase surface albedo but re-duce surface roughness length as well.
Any change in albedo may bring about significant influences on the regime of heat and water budgets over the grassland. The experiment demonstrates that with increasing of grazing intensity, values of albedo tend to increase and ratios of net radiation or net avail-able radiation tend to decrease although this pattern is subject to such environmental factors as surface soil moisture and growth status of vegetation. In addition, there may exist a critical value of albedo beyond which grassland desertification is likely to happen. This value is about 30% for the studied sandy grassland.
Surface roughness lengths of the grassland are al-tered through diminishing vegetation layer by graz-ing. Vegetation plays an important role in protecting soil surface against erosion by effectively absorbing downward momentum from the ambient air and hence reducing wind speeds near the surface. Wind erosion is closely related to the surface roughness, and thus, it may occur when overgrazing reduces plant height and cover and makes the surface soil exposed to direct ac-tion of winds and rains. The grazing experiment shows that as a result of prolonged overgrazing practice, the overgrazed plot has created favorable conditions to wind erosion and hence leading to desertification.
Increase of albedo and reduction in surface rough-ness length caused by overgrazing, in conjunction with co-occurrence of drought and strong winds in winter and spring, when plants are dormant, however, will aggravate desertification. When entering growing sea-son, whereas, desertification may become less possible
because of protection from vegetation to the surfaces. Therefore, seasonality or ‘phenology’ of desertifica-tion must be taken into consideradesertifica-tion when we assess the degrees of grassland desertification.
Two points must be stressed here. One is that set-ting an appropriate grazing intensity is a wise strategy to manage current grassland without resulting in de-sertification. The experiment suggests that this safe grazing intensity be about three to four sheep or sheep equivalents per ha for the grassland studied. The other is that in order to green dunes it is a good practice to take some measures to increase dune sur-face roughness so that relatively favorable conditions are created for re-establishment of vegetation. Placing some sand-arrestors such as wheat straws and maize stems is a sound measure. Their mulching effect will stabilize the dunes and help restore vegetation on dunes. Growing plants adaptable to dunes may exert the same effect.
Acknowledgements
The authors acknowledge the National Natural Sci-ence Foundation of China (NSFC) for funding this research. They are grateful to the Sino-Japan Joint Study Program on Desertification Mechanisms under the sponsorship of the Chinese Academy of Sciences and the Science and Technology Agency of Japan. The authors also thank Prof. R.S.J. Weisburd, Institute of Biological Sciences of the University of Tsukuba for revision and helpful comments on the paper. Finally, particular thanks are due to the reviewers for their valuable and constructive suggestions and comments.
References
Anderson, R.S., Haff, P.K., 1988. Simulation of eolian saltation. Science 241, 820–823.
Bagnold, R.A., 1941. The physics of blown sand and desert dunes. Methuen, London.
Bullock, J.M., Clear Hill, B., Dale, M.P., Silvertown, J., 1994. An experimental study of the effects of sheep grazing on vegetation change in a species-poor grassland and the role of seedling recruitment into gaps. J. Appl. Ecol. 31, 493–507.
Chamberlain, A.C., 1983. Roughness length of sea, sand and snow. Boundary Layer Meteorol. 25, 405–409.
Charney, J.G., Stone, P.H., Quirk, W.J., 1975. Drought in the Sahara: a biogeophysical feedback mechanism. Science 187, 434–435.
Charney, J.G., Quirk, W.J., Chow, S.H., Kornfield, J., 1977. A comparative study of the effects of albedo change on drought in semi-arid regions. J. Atmos. Sci. 34, 1366–1385.
Chen, W.L., Chen, Y.N., Chen, J., 1992. Numerical experiment on the influence of inhomogeneous underlying surface on the boundary-layer climate in semi-arid region. Acta Geographica Sinica 47 (6), 536–544 (in Chinese with English abstract). Chepil, W.S., Woodruff, N.P., 1963. The physics of wind erosion
and its control. Adv. Agron. 15, 211–302.
Dregne, H.E., 1985. Aridity and land degradation. Environment 27 (8), 16–33.
Dregne, H.E., 1991. Desert expansion: monitoring and assessment. In: Dregne, H.E., (Ed.), Desert Development Part I. Harwood Academic Publishers, New York, pp. 21–32.
Grace, J., 1977. Plant response to wind. Academic Press, London. Grace, J., Ford, E.D., Jarvis, P.G., 1981. Plants and Their Atmospheric Environment. 21st Symposium of the British Ecological Society. Blackwell Scientific Publications, Oxford, London.
Grainger, A., 1992. Characterization and assessment of desertification. In: Chapman, G.P., (Ed.), Desertified Grassland: Their Biology and Management. Academic Press, London, pp.17–33.
Harazono, Y., Shen, J.Y., Liu, X.M., Li, S.G., 1992. Micro-meteorological characteristics of a sand dune in the eastern part of Inner Mongolia, China in autumn. Jap. J. Agric. Meterol. 47, 217–224 (in Japanese with an English abstract). Hu, M.C., 1991. A primary research about the quantitative
classification indexes of desertification-prone land in Korqin Sandy Land. J. Desert Res. 11 (1), 22–29 (in Chinese with English abstract).
Lin, X.C., Yin, S.M., Li, K.R., 1993. A study on the effect of earth surface change on climate. Acta Geographica Sinica 48 (6), 552–562 (in Chinese with English abstract).
Liu, X.M., Zhao, H.L., Zhao, A.F., 1997. Wind-Sandy Environment and Vegetation in the Horqin Sandy Land, China. Science Press, Beijing, China, pp. 1–8 (in Chinese).
Mabbutt, J.A., 1984. A new global assessment of the status and trends of desertification. Environ. Conserv. 11, 100–113. Mabbutt, J.A., 1986. Desertification indicators. Climate Change 9,
113–122.
Manabe, S., Wetherald, R.T., 1986. Reduction in summer soil wetness induced by an increase in atmospheric carbon dioxide. Science 232, 626–628.
McEwan, I.K., Willetts, B.B., 1993. Adaptation of the near-surface wind to the development of sand transport. J. Fluid Mech. 252, 99–115.
Monteith, J.L., Unsworth, M.H., 1990. Principles of Environmental Physics. Arnold, London, pp. 31.
Nemoto, M., Lu, X.Y., Li, S.G., Jiang, M., Liu, X.M., 1992. Influence of livestock grazing on vegetation at sand dunes in semi-arid eastern Inner Mongolia, China. J. Jap. Soc. Grassl. Sci. 38, 44–52 (in Japanese with English abstract).
Nemoto, M., Ohkuro, T., Xu, B., Zhao, H.L., 1994. Grazing intensity effects of sheep on the growth of some plant species grown at the sandy land in semi-arid region — a case study in Inner Mongolia, China. J. Jap. Soc. Grassl. Sci. 40, 239–245 (in Japanese with English abstract).
Nobre, C.A., Sellers, P.J., Shukla, J., 1991. Amazonian defores-tation and regional climate change. J. Climate 4, 957–988. Pye, K., Tsoar, H., 1990. Aeolian Sand and Sand Dunes.
Cambridge University Press, Cambridge.
Schlesinger, W.H., Cunningham, G.L., Huenneke, L.F., Jarrell, W.M., Virginia, R.A., Whitford, W.G., 1990. Biological feedbacks in global desertification. Science 247, 1043–1048. Shukla, J., Mintz, Y., 1982. Influence of land-surface
evapo-transpiration on the Earth’s climate. Science 215, 1498–1501. Shukla, J., Nobre, C., Sellers, P., 1990. Amazon deforestation and
climate change. Science 247, 1322–1325.
Thom, A.S., 1975. Momentum, mass and heat exchange of plant communities. In: Monteith, J.L., (Ed.), Vegetation and Atmosphere. Academic Press, London, pp. 57–110.
UNEP, 1992. World atlas of desertification. Nairobi and Edward Arnold, London, UK., pp. 69.
Wright, I.R., Gash, J.H.C., Da Rocha, H.R., Shuttleworth, W.J., Nobre, C.A., Maitelli, G.T., Zamparoni, C.A.G.P., Carvalho, P.R.A., 1992. Dry season micrometeorology of central Amazonian ranchland. Quarterly Journal of the Royal Meteorological Society, 118, 1083–1099.
Zhao, H.L., 1992. Production, utilization and improvement of sandy grassland in Korqin region, Inner Mongolia. Pratacultural Sci. 9, 38–41 (in Chinese with English abstract).
Zhao, H.L., Nemoto, M., Ohkuro, T., Li, S.G., 1997. Study on desertification mechanisms of grazing grassland in Kerqin sandy land in Inner Mongolia, China. Grassl. China, 3, 15–23 (in Chinese with English abstract).
Zhu, Z.D., Wang, T., 1992. Theory and practice on sandy desertification in China. J. Quaternary Sci. 2, 97–106 (in Chinese with English abstract).