CREATING OF CENTRAL GEOSPATIAL DATABASE OF THE SLOVAK REPUBLIC
AND PROCEDURES OF ITS REVISION
M. Miškolci a, V. Šafář b, R. Šrámková b,*
aTopographic Institute of Colonel Ján Lipský, Ružová 8, Banská Bystrica,Slovak Rapublic - [email protected] bResearch Institute of Geodesy, Topography and Cartography, v.v.i., Zdiby, Ústecká 98, Czech Republic - [email protected]
c
Private person - Authorized surveyor and cartographer - [email protected]
ISPRS – UN-GGIM Forum
KEY WORDS: Produce3D database, DIGEST, Photogrammetric mapping, Field inspection, Geographical analysis,
ABSTRACT:
The article describes the creation of initial three dimensional geodatabase from planning and designing through the determination of technological and manufacturing processes to practical using of Central Geospatial Database (CGD - official name in Slovak language is Centrálna Priestorová Databáza - CPD) and shortly describes procedures of its revision. CGD ensures proper collection, processing, storing, transferring and displaying of digital geospatial information. CGD is used by Ministry of Defense (MoD) for defense and crisis management tasks and by Integrated rescue system. For military personnel CGD is run on MoD intranet, and for other users outside of MoD is transmutated to ZbGIS (Primary Geodatabase of Slovak Republic) and is run on public web site. CGD is a global set of geo-spatial information. CGD is a vector computer model which completely covers entire territory of Slovakia. Seamless CGD is created by digitizing of real world using of photogrammetric stereoscopic methods and measurements of objects properties. Basic vector model of CGD (from photogrammetric processing) is then taken out to the field for inspection and additional gathering of objects properties in the whole area of mapping. Finally real-world objects are spatially modeled as a entities of three-dimensional database. CGD gives us opportunity, to get know the territory complexly in all the three spatial dimensions. Every entity in CGD has recorded the time of collection, which allows the individual to assess the timeliness of information. CGD can be utilized for the purposes of geographical analysis, geo-referencing, cartographic purposes as well as various special-purpose mapping and has the ambition to cover the needs not only the MoD, but to become a reference model for the national geographical infrastructure.
1. INTRODUCTION
1.1 Stimulus for the creation of CGD
The development of the Military Information System about Territory (VISU) started in the Topographic Institute of Slovak Army Forces in 1995. The system was implemented by the Minister of Defense in May 2000. The core of the system was digitized data gained by the digitization of lithography copies of the original topographic maps. In 2001, it was decided that due to the topographic substrates obsolescence, and therefore the own database outdated data, will be performed a new mapping of the territory of the Slovak Republic. The basis for the contents of the new Central Geo-spatial Database (CGD) was the appropriate choice of optimal information sources and data collection methods, which allowed collecting, analyze, use, store and exchange data with coalition partners. CGD concept was derived from the applicable international standards DIGEST (Digital Geographic Exchange Standard - STANAG 7074) and respected standards of ISO 19114 and other binding regulations. It was decided that the main data source will be aerial images (LMS) and the initial filling of the CGD will be done by using of technologies of digital photogrammetry. In 2003 aerial photogrammetry was fully prepared for the data creating of spatial database using digital stereo-photogrammetric devices. Digital evaluation devices already provide high processing facilities and together with well-trained operators of digital stations gave a guarantee of the high productivity in data collection. Aerial photogrammetry thus enabled significantly improve data quality in the following
years, provide users with more information about territory over which it will be possible to solve spatial tasks. In general, the building of CGD brought a reduction of the entropy rate in the determination of the superior components of the Armed Forces of the Slovak Republic and increased the prestige of topographical institute within the country and the coalition.
1.2 Legislation terms for CGD formation
Law of geodesy and cartography 215/1995 was the highest legislation standard for CGD formation. The performance state administration in the geodesy and cartography field is defined in § 4. It determines ministries and work range in geodetic and cartographic field. Section No. 4 directly relates to MoD (Ministry of Defense) and according to point c provides creating and management of GIS for state defense requirement. Opposite of it Geodesy, Cartography and Cadastre Authority (GCCA) is according to this law responsible for creation of GIS fundamental base for civilian purposes.
Development of the military information system about territory started in 1995. It was approved by MoD in October 1996 as part of scientific technical development of Armed Forces of SR. The system was authorized for using by Minister of defense in May 2000. After this decision, the CGD catalog development started. Because creation of GIS is managed by MoD and GCCA the mutual agreement for creating integrated GIS data base was signed in 2001 with conclusion that mutual base will be accomplished by departments themselves and according to their own requirements. This was a reason to process mutual CGD harmonized catalog. This legislatively set up base for GIS The International Archives of the Photogrammetry, Remote Sensing and Spatial Information Sciences, Volume XLI-B4, 2016
creating. The pilot CGD data collection started in 2002 and continued with ordinary collection since 2003. By chief of general staff order, coordinate system WGS84 was launched for using in armed forces of SR in Jun 2006 and via regulation of minister of defense was define general GIS content for necessity of state defense in April 2007.
Topographic Institute (TOPU) tried from the project beginning, because of labor efficiency increasing and decreasing financial ratio, to make an agreement with other geospatial data keepers (state organizations) whose data could be suitable for CGD or as base for it. Unfortunately, hardly one state organization had digital geographic data in required quality. Thus, whole data collection process was under MoD responsibility.
1.3 Determination of the multidimensional database designing process
In the course of 2003 dimensionality of the new contents of CGD was definitely specified, as well as its internal organization within VISU. The description of each element properties (attributes) and its heuristic links to other elements was appointed subsequently. CGD process of designing in its entirety was constantly determined by the following facts:
agreement among the involved partners on particular contents of classes, elements and CGD attributes over the standard dB DIGEST and its enrichment with specific Slovak features
requirements for the position and height accuracy of the CGD elements and their attributes´ metrics in the attribute column „HEIGHT“ and the resulting parameters´ characteristics of the aerial photography that determine these requirements
determining the longest possible period of collection of CGD data from the whole country territory and the elaboration of a related work schedule
setting up the cooperation between the suppliers of aerial photographs, teams of stereo operators and triangulators, supervisors and groups of local surveillance and the compilers of the production blocks
the financial limits set by superiors
discussions about whether the results of CGD will be used during its compilation and by who it will be used.
In 2003, the collecting of data was started according to the new formerly agreed technological flow of data, which had been adjusted on a pilot sample in a new structure with sophisticated attributes and spatial (3D) relationships between particular objects and their classes. For production management of CGD there were used techniques and procedures for project management; and practice of management process showed that regular meetings as well as informal discussions of pilots, engineers, developers, programmers, triangulators, LMS evaluators and supervisors lead to a significant increase in the effect and speed of production start-up and the production of individual units. Relations between various entities involved in the production, their position and authority, were improved as well. Simplified diagram of manufacture is shown in figure 1. End of data collection from the territory of the Slovak Republic was scheduled for late 2009, however, in reality CGD was not fully functional and valid until the end of 2010 - 2011.
1.4 Objectives of CGD
The basic objective of creating CGD was specified by dozens of consultations with prospective CGD users. The aim of CGD is to provide hundreds of users, not only in the Ministry of Defense, with system based on the architecture “client - server”. The design and subsequent implementation of this plan allowed arrangement of a small number of “server” workplaces that have high computing power and are capable of the producing required products and services. On the side of the client a large number of relatively inexpensive workstations can be established, which are capable of communicating with servers and use their services. The detail, positional accuracy and properties of CGD depend on the character of tasks that are with a support of this information solved, as well as of the user´s needs. Target informational minimum has been theoretically defined to suit to a very large area of analyses in all types of tasks carried out by the armed forces and rescue services. The fact that was taken into account in the course of setting all targets was that the relationship between the positional accuracy and financial resources is the relationship of the exponential function and that the availability or traceability of some data is also the limiting factor. In each case, the decisions concerning the objectives of CGD were a compromise solution, which in turn strictly depend on a detailed understanding of user needs. Each attribute and its application in the military practice was discussed in depth in order to create, for allocated financial sources, functional 3D spatial geo-database of objects, properties of these objects and their position in space and time; and provide users with effective tools for its control and data analysis.
Fig. 1 A simplified scheme of the CGD's production
2. FRAMEWORK OF CGD SOLUTIONS
2.1 Used default data model
As mentioned above, the data model has been relatively clearly defined by the contents of the STANAG 7074. However, given the fact that this standard uses as a basic module of expressing the shapes and objects of the topographic contents only two-dimensional level of these elements, it was in the very beginning proceeded to express the mutual spatial conditions and links between elements in 3D. A simple example of the CGD content changes compared with DIGEST is a need to clearly define spatial relationships such as between road passings under a hopper in a quarry. In the case of expression in the standard DIGEST, elements “lie side by side” with its attributes. As for 3D spatial database there must be ensured that the communication is not interrupted while the element of the hopper is not marked as a spatial topology error. Thusly there had to be treated any alternative crossing between elements. The most challenging was to solve all the alternatives of the elements crossing in the features as bridge, communications, water pipes, power lines above and below ground and dozens of other potential real-life 3D objects crossing each other. This preparatory work was dealt with via number of meetings of photogrammetric technologists with final users, via dB processing and last but not least, via hundreds of e-mails. The building of database elements, attributes of these elements and their possible crossing, including the creation of procedures for receiving and acceptance so called exceptions or in other word „situations“ that remain after an automated check of elements topology, was absolutely inevitable step at the beginning of data collection through photogrammetric methods. Compiled catalogue of objects with their accurate definitions and defined technological guidelines for the collection of individual objects and their attributes, together with the correction tables elaborated in subsequent years, were fundamental documents for the initial production of photogrammetric data. Arisen methodical steps, are the only possible procedures for individual territory’s batches processing and for creation of uniformed technological base and description of all feature’s creation, which evaluated by stereoscopic photogrammetric methods. Based on so uniformly specified qualities of outputted work, unified quality of data created by subcontractors involved in primary processing could be ensured.
2.2 Choosing operational platform
Data collection required technical and organization transformation of Topographic Institute. There were two independent departments in TOPU occupied with geospatial data collection and processing. Department of mapping, collected geospatial data by photogrammetric methods and Department of geo- informatic occupied with data processing and cartography production. With project establishment Department of mapping combined with a part of Department of geo-informatic and Department of information collection came into existence. Altogether 24 people (TOPU labor) participated in project, one technology manger, two organization mangers (one of them for project in general, one for TOPU part) and one primary controller. The primary controller could not be from Department of information collection because of reaching maximum objectivity. From the project beginning it was evidently clear, it is not possible to collect data from such huge area with suggested methodology by work group from TOPU during period of 7-9 years. Non-governmental organization
participation was considered and TOPU remained as contracting authority and head of project.
Technology team had been set up before the project started. The team consisted of organization participated in data collection chosen deputies. Team chief was TOPU main technologist. TOPU had organized introductory training for technology team and work methodology before the first area processing. This team was responsible for keeping set up methodology in organizations themselves.
Before area processing itself, TOPU had set up processing areas for current year. Apart from that, TOPU provided source materials, methodology and provided final quality assessment. Because of it, this project changed that time current technology methods, whole Department of information collection was educated for CGD structure, collection technology, checking regulations and ArcGIS Desktop. 10 people were trained from this group (photogrammetry) for new tools and photogrammetry digitalization to GIS software enviroment. This provided base personal know-how for data collection in TOPU scope. Supplier organization trainings were realized by their management and TOPU did not become involved.
The technology questions and problems appeared during area processing, team technology members pushed directly to the main project technologist, when it was „easy and clear“ he sorted out it immediately and replied to team members. When it was more complicated or it had far-reaching consequences he left this question for additional discussion. There was technology team meeting regularly every year after work finishing. The main controller informed members about quality result controls. He suggested solutions to eliminate discovered systematic errors on the basis of these results. The meetings included discussions for solving occurred problems, observations and suggestions for improvement. The meeting result was by main technologist processed to new edited methodology, valid for following time period. After that, the individual technology team members transmitted changes into their organizations.
2.3 Initial work schedule
The work schedule was mainly determined by four factors. The first one concerned with initial data collection for CGD, the second collection technology, the third country geomorphology and the fourth was time period, during area of SR should have been processed. During initial and the first processed area, was this area divided according to map sheet borders. This border streaming map sheets dividing is easy and clearly arranged but borders are very often going through mountains where there are sparse roads and going through mountains during fieldworks from side to side (somewhere 100km), through mountain pass is complicated and lengthy, and mainly because it will be processed during e.g. neighboring map sheet, when it is will not be necessary going through these mountain massifs. In addition map sheet borders are going through crosswise objects which creats one logical part (building, bridge, village and so on). Thus, to minimize data collection operating expenses (mainly fieldwork parts), it was decided, data collection will not stream map sheet borders. But, cost raster model of republic was created and it defined areas that each chosen processed center parts reaches approximately the same difficulty. The raster model took into consideration area morphology and existing road network. This enabled to reach usually entire area from one main valley and vast mountain massifs did not have to be overcome. These areas were called the batches, what was base area process units and agreement subject, too. The batches were further divided in organizations into smaller processed parts – The International Archives of the Photogrammetry, Remote Sensing and Spatial Information Sciences, Volume XLI-B4, 2016
the production batches and these areas were in responsibility of particular worker.Next, an area boundary, if possible, should have not crossed objects of infrastructure (borders should have passed preferentially over the soil cover). As the data collection time period was set to 6- 7 years, and data collection was outpacing cartographic production by a couple of years, the irregular shape of the territories, not copying the map sheets, and not allowing the maximum use of the processed area for cartographic map sheets creation, was not an obstruction
Fig. 2.Zoning territory of Slovakia by processed regions and years of finishing.
Task schedule for each year has been designed to process areas smaller in size and easy in undertaking in first three years of the project. This kind of succession helped to gain experience, or more precisely fine-tune the details of producing technology as well as organizing of work. Subsequently, a noticeable increase of work quantity occurred, and the most complicated areas, having the most developed infrastructure, were processed at last, since an intensive construction was taking place in those territories, and the goal was to gain actual data.
3. CGD PRODUCTION
CGD production was made as a initial output of spatial geo-database. Spatial accuracy of database data set was set to maximum allowed deviation of + -1.5m, what is final accuracy of vector data, already including error made by the digitizing. Aerial photography was carried out followed by aero-triangulation of imaging blocks in time sequence of years and aligning them along geo-morphological terrain lines (mountain ridge). Subsequently, individual batches were mapped and after the initial topological spatial assessment and exceptions definition submitted for the on the spot survey.
3.1 Planning of imaging flights and parameters of images
With regard to current state of suitable aerial images' coverage at the time of CGD project preparation, as well as with regard to planed perspective ending of continuous imaging for Slovakia's orthophoto map creation, it has been decided to use these images preferably. Four entities participated in the collection of photogrammetric data, two of them state-runed and the other two privately-runed entities. Photogrammetric data collection ratio of state-runed entities to private companies counted 20% to 80%. Each entity used mainly its own source materials and therefore the scale of images varied within the range of approx. 1: 20 000 to 1: 26 000, of it roughly 75% were at scale of 1: 26 000 as continuous orthophoto map of Slovakia. Image
capturing flight route was designed in contiguous blocks with east–west direction, with 60% of end lap and 25-30% of side lap overlapping. Territories out of the contiguous blocks were imaged individually, with respect to site layout and to efficiency of processing, with overlaps kept. Imaging was performed using standard aerial- photogrammetric cameras, principally analogue types (RMK TOP 15, RC 20 a RC 30) with a focal length of approx. 150 mm, preferring color film material. On a small scale, digital cameras (UltraCut X, XP) were used. The used cameras were regularly calibrated within interval of two years. Timeliness of images used for the project ranged from year 2002 to 2008, preferring the most recent images of the particular area. Most of them, approx. 26% were taken in 2002, 21% in 2006, 15% in 2005 and approx. 12% in 2007.
3.2 Block adjustment
Analog images were developed by standard development process, followed by scanning process at 14μm pixel size, what represents GSD of 0.45 meter by small scale of image. Photogrammetric scanners (e.g. Photoscan TD1, ZI Imaging and others) were used for this purpose, regularly calibrated. Batches for AET were mainly formed by the blocks of areas already formed by planning process of continuous orthophotomap of SR imaging (approx. 30 blocks for the whole territory of Slovakia). Before imaging itself, signalization, stabilization and surveying of ground control points and control points, used for AET's calculation and control, was carried out. Software applications used for AET's calculation: MATCH-AT Block adjustment, ORIMA and SocetSet – BAE.
The mean standard errors in the calculation of AET for the small scale images reached values of:
RMSExyz control ≤ 0.30 m
RMSExyz max ground residual ≤ 0.60 m
Achieved mean standard errors, with respect to the further processing in the production process, enabled achievement of given spatial accuracy of data in the database.
3.3 Assembling of evaluated batches
3.3.1 Preparation of evaluation Chapter No. 2.3 describes method and reasons for dividing batches based on terrain's characteristics and on road networks. Preparation to photogrammetric evaluation, however, required distribution of a batch to sections, chosen to no cooperation with other evaluators was needed. By gradually growing data content of a batch, rules of mutual linking and measurement of specified feature's attributes by photogrammetric methods either directly using digital photogrammetric workstations or in the following process of editing primary photogrammetric data, were ad hoc determined. The main focus was to ensure all the necessary data were evaluated in deadline and the local on the spot investigation could follow. Because of that, the processing of images taken was ordinarily carried out during winter time. Despite the effort of all participants, this working procedure was not kept for first two years of project duration and the local on the spot investigation was held by unsuitable weather conditions.
3.3.2 Requirements for individual CGD's features and list of them By compiling catalogue of Central geo-spatial database (CGD), the principles of DIGEST standards were accepted at the maximum possible measure. Features are classified according to several aspects, as for example, distribution by geometry recognizing point, lineal, areal and special routes and regions used mainly for geographic information system. The International Archives of the Photogrammetry, Remote Sensing and Spatial Information Sciences, Volume XLI-B4, 2016
Definitions are based on the basic objects' defining by ESRI (Anonymous, 1995). When defining routes, principles were applied, the route is formed of individual lineal parts or of compact lines and by defining regions they are composed of individual areal parts or compact areas. According to this division, initial classes were created. Another aspect of the division was a thematic layer assignment.
CGD's themes:
A - Objects made by man (exclusively) - tangible, visible objects, which could not be creted by nature spontaneously. They get created by human activity as new objects, as not organic part of nature (buildings, communication and so on).
AA Objects used for permanent or temporary residence of humans (buildings, built-up areas, towns).
AB Objects used for transporting people or goods (road network).
AB1 Road transportation objects - designed mainly for providing, usage and operation of wheeled vehicles and pedestrians on.
AB2 Railway transportation objects - designed mainly for providing, usage and operation of rail and cable railway vehicles.
AB3 Water transportation objects - objects designed mainly for providing, usage and operation of shipping. AB4 Air transportation objects - objects designed mainly for providing, usage and operation of air transportation.
AC Objects used for transmission of signals, man's communication and of power, transportation of liquids.
AC1 Objects used for transportation of solid, liquid and gaseous materials.
AC2 Objects used for transmission of electric fields and communication signals.
AD Objects used for production of articles, mining of raw materials and for agricultural production. AE Objects used for rest, sports, recreation and
education of people (studies).
AF Other objects of category A + military objects. B. Objects created by nature, eventually
man-modified. Objects created or which can be created without any human intervention, or are developed by adjustment of parts of such objects by human activities. (For their formation also other impact factors than human activity are required: forest, body of water, terrain).
BA Waters (body of water, streams). BB Vegetation (forests, meadows, pastures). BC Surface (topsoil, rocky surface and so on). BD Relief.
C. Man-made objects, intangible, invisible in nature. To man served objects for subdividing of space into smaller parts, eventually, get created as interpretation of phenomenon in the nature (boundary line, dazzling of slope).
CA Administrative boundaries.
CB Temporary (usually contractual) boundaries. CC Boundaries of natural objects interpreted by
human being (soil types, magnetic anomalies). CD Another boundary.
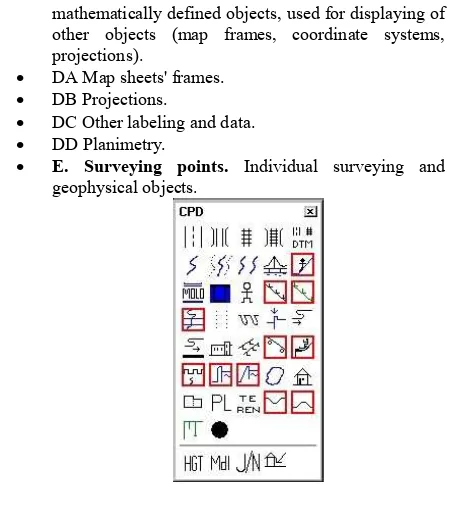
D. Objects used for displaying and presenting of other objects, objects for visualization. Usually
mathematically defined objects, used for displaying of other objects (map frames, coordinate systems, projections).
DA Map sheets' frames. DB Projections.
DC Other labeling and data. DD Planimetry.
E. Surveying points. Individual surveying and geophysical objects.
Fig. 3 Digitalization toolbar
The CGD structure is subdivided into individual features. These were taken completely over from the DIGEST standards and in some cases created new ones as well. Each feature has got a set of attributes. These are also taken from DIGEST, but they were assorted newly to each individual feature. The individual attributes are holders of particular properties. The attribute can be expressed by a domain, by a value (size) or by text. All features of DIGEST were distributed according to this key. At the same time also the content of topographical map TM 1: 25000 was checked, in order to hold to informational minimum. Individual attributes of features were not transferred according to the DIGEST standards, but created newly according few principles:
1. All attributes of a feature that are expressed in the map, must be underpinned by some value of specific attribute.
2. If such value did not exist in DIGEST before, it was created. 3. If such attribute did not exist, it was created a new one. Creating of new features was very strictly limited. Therewith a condition was achieved, the database is not overloaded with new (Slovak) features, but all existing facts are expressed by DIGEST's features and by change of attribute or value. For example, the attribute of combustibility and incombustibility of a building is expressed with the "state of the building" attribute. As regards the feature of a bridge, such attribute as "wooden bridge" did not exist. This attribute was similarly expressed by the new value of attribute, "material composition". Another example is creation of a new attribute. A type of track of "railroad" feature could not be expressed with any of already existing attributes, so a new one was created. Overall, there were created only two new features ("slide for launching of wood and other material" and "light road construction"). There were 29 new attributes created and around 1096 new values of attributes, which were related mainly to height of the feature itself or to its absolute altitude.
3.3.3 Photogrammetric evaluation of CGD's features and their attributes The method of evaluating spatial database is quite complicated and it is not possible to rely only on self-control by this type of stereo-photogrammetric evaluation. Also a thoroughgoing assessment of the content of the evaluation by The International Archives of the Photogrammetry, Remote Sensing and Spatial Information Sciences, Volume XLI-B4, 2016
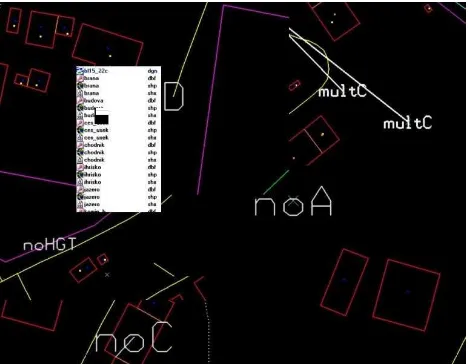
an independent person or more precisely by the person and independent software enabling to find any errors in topology must be carried out. The primary photogrammetric file, with attributes which are the mandatory evaluation items, is tested by a series of assessments. These assessments can be of identification, geometric, attribution and topological kind (which control continuity of correct and real overlap of features and also continuity of point, line and area features). There is an example of assessment scheme designed for self- control at stereo-photogrammetric station in a graphical environment of MicroStation showed in the Figure 4. The Fig. 4 also exemplifies one of the results of the assessment of topology in MicroStation environment, before loading into ESRI Geo-database.
Fig. 4 Results of the graphical assessment in MicroStation environment and partial section of control table displaying graphical part of the database.
After completion of auto-control and execution of all repairs indicated, identical assessment was executed on MicroStation's drawing. Only when software checks' system returned any incorrect value over the entire project drawing (over joined photogrammetric models), it was approached to continuity checks and to jointless drawing's creation over the entire batch. Using this system of successive inspections at level of primary collection of photogrammetric data, high quality of basic input of CGD was achieved. The database could be subsequently submitted for attributes' addition of data from other resources and for carrying out the local on the spot investigations.
3.4 Fieldwork
As indicated above, geometrical interpretation of elements (position, shape) was obtained using photogrammetric methods. Each element contains also a number of properties registered in attributes that however, could not be obtained by photogrammetry, or their determination was very unreliable / inaccurate. For this purpose, field work, on the spot research was conducted.
On the spot research was based on three basic objectives: - to verify the classification of objects into the appropriate feature classes (or fix worng classification),
- to identify and fill in missing attributes and elements, - to add newly created objects still not located on the aerial images.
It follows that only people from the on the spot research were physically present by processing objects.
Within complementing of attributes, on the spot research incorporated data obtained from other institutions as well.
3.4.1 Objects of fieldwork Subjects of on the spotresearch were the elements of the database, where correctness of classification in photogrammetry processing was confirming, or specific (not general) attributes were investigated. Basically all elements, except the soil cover.To the general attributes, those not searched in field belong: precision data, date and author of information, expiration date, phases of the element in production process.
To the specific attributes belong for example:
in the case of a road: operation mode, total width of road, width between shoulders, road surface material composition, type and slope of road, maximum load- carrying capacity, heights limits,
in the case of a building: condition of building, name, use and type of affiliation of building to religion.
In addition, each element has editable text box with for an attribute, any other detailed information to the element can be added.
Furthermore, so called composite elements, which means complex elements, constituted by primary elements (factory consist of a number of buildings, roads, towers and various other objects) were investigated.
3.4.2 Basic principles and methods On the spot research could be divided into the following steps. Preparation and printing, actual fieldwork, and subsequently, filling attributes. On the spot research was limited mainly due to weather conditions (in mountainous areas of Slovakia, winter time lasts for about five months), what made fieldwork carrying out in the shortest possible time necessary. Moreover, the slow research would lead to a significant increase of travel and accommodation expenses.
Therefore, and for a reason of huge amount of attributes investigated, they were not added to the database on the spot, even possible due to technical equipment, only noted down to hard copy maps. Those hard copy maps were printed at different scales, depending on density of the elements. This method is considerably faster and thus vegetative period was used sober. During the winter period and bad weather time, the properties of the elements were rewritten from the field records to attribute tables. To ensure these time-consuming tasks, temporary workers, trained by the individual organizations, were employed.
Preparation and printing: in pursuance of on the spot research, the visual control on ortho-photos (products of aerial photographs, on which data extraction was carried out) took place, focusing on the completeness of the area processed. Of the source data, temporary field maps were made, with appropriate sheet network design, scale and legend, considering expenses saving. The design of map sheet network was proposed to optimally cover processed territory. Map scales of 1: 10000, 1: 5000 and 1: 2000 were used. Emphasis was putting on an appropriate map legend, making orientation and identification of individual objects in the field, as easy as possible. Two different kinds of map labels were created. In the temporary field maps of small scale objects as roads, railways, water areas, bridges and towers were primarily highlighted. In the case of large scale maps, objects as buildings, local roads, fences or cemetery were highlighted. During the preparatory tasks, proprietors of large manufacturing companies, Forest Administrations of Slovakia and other institutions were addressed in a matter of allowing entry into areas. The resulting The International Archives of the Photogrammetry, Remote Sensing and Spatial Information Sciences, Volume XLI-B4, 2016
digital maps were printed at scale of 1: 10000 and 1: 5000 on A2 and A3 format size, and by map scale of 1: 2000 on A4 format size.
Fieldwork: staff members were divided into two groups. The first one was responsible for terrain research and the other one for built-up areas. This way of division also determined equipment used. The terrain search group consisted mostly of two to three people driven a off road vehicle. Since investigating wide, sparsely populated areas with a small number of objects, maps of small scales (1: 10000 to 1: 5000) were used by them, as well as handheld GPS navigation devices with ArcPad software installed in and laser rangefinders with altimeter. The working group investigating built-up areas used mostly 5 to 7- seater road vehicles. Staff either got off the vehicle on the spot of search, or driver dropped working groups off at given locations. This working group was using temporary field maps of the large scales, 1: 1000 to 1:5000. Similarly, handheld GPS navigation devices, laser rangefinders + altimeters as well as measuring wheels were used. To the end of working day, all staff members met together and went through all the map sheets to check the completeness of tasks, subsequently agreed on resolving questionable cases, and determined the working procedure for next days. The number of working groups depended upon the vastness of the observed area and possibilities of the specific organization.
Filling in attributes: in this part of office work, in each production geo-database, the attribute table of all subjects got filled out by investigated properties of subjects, noted down to hard copy maps during fieldwork. Furthermore, new elements surveyed in the field by GPS devices were transferred into the database. Besides that, misinterpreted objects were corrected. That ensured interpretation’s correctness as well as completeness of attributes of all features in the database. The work flow could slightly vary depending on the technical equipment used.
3.4.3 Finalization of area At this stage, final tasks and revisions of data prior to submission were made. Edge matching of attributes on partial databases’ joints was performed, and subsequently the partial production databases were united into principal working territorial units, so called batches (covering around 300 square kilometers). After completing two neighbouring batches, the edge matching was performed as well. At the end, a final labour report was elaborated. Herewith was processing considered to be completed.
3.4.4 Quality assessment Due to the huge amount of objects collected and speed of work, great emphasis was putting on quality assessment. The aim of the quality assessment, inter alia, was detection of systematic errors and consequent methods adjustments to ensure elimination of their further occurrence. These checks were carried out after each major step in the workflow, to ensure fast detection of potential errors and returning the database for revising.
The first quality assessment steps were carried out when photogrammetric tasks were completed (digitization), and consisted of topologic controls and of initial attribute inspections (assessed just few selected attributes filled in by photogrammetric processing). These checks were performed using computer software followed by a visual inspection by a operator, where he examined completeness of digitized area. After fieldwork completing and filling the database by attributes and newly created features, topologic correctness was checked once again followed by all attributes. These assessment steps were performed as by Topographic Institute, so by supplier
organizations and were fully within the competence of the particular organization. Following checks were carried out only by Topographic Institute (order party), realized after processing each individual area:
a) Acceptance test – performed after completion of all tasks. Commission established by Topographic Institute was carrying out the initial quality assessment as well as completeness of outputs checking, followed by report elaboration. During the acceptance test, accuracy of the database structure and area coverage completeness were controlled as well as selected feature classes, where geometric and attribute correctness was inspected. The Commission was allowed to check only compulsory elements but the other features and attributes as desired. The aim was, the most numerous feature classes (buildings, roads, rivers and so on) undergo the process of acceptance together with insurance of suddenness / randomness of the initial assessment.
b) Quality assessment - QA (major assessment). Performed by Topographic Institute, in accordance with ISO 19114 norm. The procedure carried on as follows: a processed territory was divided into square grids of 1x1km, where software application chose attributes were re-measured. Simultaneously, an absolute accuracy of digitization (of vectors) in a given coordinate system was controlled based on selected features. After the fieldwork, a main controller statistically evaluated an error rate, made record of it and suggested to add the produced area to data warehouse, or to return it for revision. Areas processed by Topographic Institute were checked for errors by a working group, not involved in the particular territory.
Conclusions of the quality assessment were presented on technological days, and quality improvement measures were proposed.
4. INTEGRATION, DISTRIBUTION AND USE
Finished areas were sequentially submitted into the data warehouse till completing the whole territory of the Slovak Republic, consequently we approached to integration of partial databases into just one - Integrated CGD. During the process of integration, following problems have to be solved:
a) Unification of coordinate system. In terms of Armed Forces of Slovak Republic (AFSR) changes in regulations occurred during the project, replacing the S42/83 coordinate system to the WGS84/UTM. Areas completed in previous coordinate system were transformed into the new one, followed by edge re-matching.
b) During the project, some modifications to the database structure occurred, conversion from an old to a new version of the database was necessary. This resulted in modest changes in feature classes, but mainly in attributes and their domain values.
c) Features of same attributes, divided as a result of occurring on a border of two processed sub-areas, were merged together in one. Herewith, borders between batches got eliminated. At the same time, features of same attributes and groundlessly separated into several parts, were merged together during this step. Eventually, composite features (compounded), also divided by processing border, were merged together (e.g. D1 motorway was passing through 8 processing batches).
d) Data from other government organizations, not subjects to additional processing, were integrated.
Since in terms of law of geodesy and cartography, for GIS data distribution to other (civil) state administration institutions is Geodesy, Cartography and Cadastre Authority responsible, the CGD was at the end of the project handed in to this authority. The other data necessary for military use were implemented in conditions of Armed Forces of Slovak Republic (AFSR).
The data were afterwards distributed to the individual segments of AFSR, to the department of GIS, and distributed through the web map services on an intranet network to all sections of AFSR.
The data produced in the project were used for certain tasks already in the process of creation, but after the project completion, dramatic increase of their usage occurred. In addition to already mentioned map services, the data are in addition used as the main source for the Military state map series creation at scale of 1: 25 000 and 1: 50 000. Furthermore, the outputs are used in solving almost any special military- geographical tasks TOPU received either throughout the year or during military exercises. Among other issues, TOPU organizes training courses, where individual members of the GIS department of AFSR get trained to work with this data. Last but not least, in a limited extent TOPU provides parts of the data to academic institutions and universities for education purposes of GIS students.
5. UPDATING PROCEDURE OF CGD
One of the biggest concerns by geographic data is up-to-dateness. Simultaneously with dynamic changes of some areas in the country the geo-data need to be kept up to date. Outdated data do not lead to quality products or to proper decisions. Therefore, even before the end of the filling in the CGD, a working group was established occupied with update methodology of CGD, which led to realization of a complete analysis of the quality and content processed in CGD. That resulted in some determining factors for updates:
a) the update must be done faster than the initial data collection
b) during the update, producing quality of each territory has to be unified (initially produced area showed infrastructure (e.g. vertical barrier) and to features identified as faulty or not checked in the field e) acquisition and implementation of especial features
and attributes TOPU has no capabilities and competencies to obtain (e.g. special hydrological data, underground objects and so on), from administrators in charge
f) data are updated 3D too
g) area segmentation must have different borders as by the initial processing.
Based on these conditions, a new database structure and methodology of updating data were developed. As main method of updating, again digital photogrammetry was defined, along with on the spot reconnaissance. In terms of organization, are areas updated in two ways. The planned update is based on medium-term plan, which takes into account age, quality and importance of each area. The unplanned update, taking place in other areas as determined in the plan, depending on importance of the changes that have occurred in this area (e.g. a completion of a new motorway section, development of a factory with extensive additional infrastructure and so on). The update confirmed well known fact about Slovakia, there are large regional differences between territories. There were areas with just minimal changes done while updating, most of the labour was done by the unification of interpretation and processed quality of initial databases. Contrarily, in some smaller areas, major changes occurred in less than 10 years time. Previous experiences showed a fact, most often there are changes at margins of "bigger" towns. Fairly intensive housing construction takes place there, associated with further development of shopping centres, petrol stations, manufacturing facilities, warehouses and so on. In sparsely populated areas, on the other hand, gradual depopulation occurs, leaving behind abandoned houses, dilapidated agricultural farms.
6. STATISTICS
In conclusion, some facts to gain idea of tasks' scale by CGD creating.
Total Area of Slovak republic: 49.000km2 Jointless database over the territory: Yes 3D - 85% of CGD features
Formal number of map sheets: 352 sheets of 1:25 000 Number of features in the database: 171
Total number of attributes for all features: 131 Attributes filling's realization: 90%
Based on experiences in history we can say, the importance and need for spatial information of combat zones have been increasing with development of armies, military equipments and soldiery in general. Forms and methods of acquisition, processing, documentation and information usage were changing in time. The scope, range of products, requirements on accuracy, detail and up-to-dateness of the information about the area were changing in time. The development went of simple terrain reconnaissance, qualitative verbal "travelogues like" characteristics (schematic notes, images), to the current digital form of information about the geographical environment. Creating a database structure design was very complex task, and already from the start on it was clear, it has to be open system, being able to change frequently. These changes, despite all that, could not modify the principles or basic structure of the database. When creating CGD, a crucial decision point was management of created database. Management of data The International Archives of the Photogrammetry, Remote Sensing and Spatial Information Sciences, Volume XLI-B4, 2016
collection process for such extensive information system, was conducted by explicit principles and rules, collectively defined, discussed and approved by all project participants. These techniques were strictly followed. At present time, TOPU's main task is effective and fast update of CGD database.
REFERENCES
Zhilin L., Jun C., Baltsavias E..2008 Advances in Photogrammetry, Remote Sensing and Spatial Information Science: 2008 ISPRS Congress Book, Tailor & Francis Group, London 2008, UK.
Zákon o riadení štátu v krízových situáciách mimo času vojny a vojnového stavu.
Zákon o integrovanom záchrannom systéme č. 129 of 15th of February 2002.
Rozhodnutie ministra obrany SR o používaní Vojenského informačného systému o území v Armáde SR č.p. SEM PO-0631/7 of 28th of May 2001.
Koncepcia komunikačných a informačných systémov v rezorte ministerstva obrany č.p. SEMI-V-326-20/2002-OdKIS a FM, March 2002.
Adamják M.,1998, Vojenský informačný systém o území, In: Zborník referátov Geoinformatika v službách Armády SR str. 9 -19, B. Bystrica 1th of October 1998.
Piroh J.,1999, VISÚ ako tretí register ŠIS, In: Zborník referátov Štátny informačný systém a Armáda SR, str. 169-174, B. Bystrica 30th of September to 1th of October 1999.
STANAG 7074 - DIGEST