ASSESSMENT OF SEA ICE FREEBOARD AND THICKNESS IN MCMURDO SOUND,
ANTARCTICA, DERIVED BY GROUND VALIDATED SATELLITE ALTIMETER DATA
D. Price a, *, W. Rack a, C. Haas b, P. Langhorne c, O. Marsha a
Gateway Antarctica, University of Canterbury, Christchurch, New Zealand – (daniel.price, oliver.marsh).pg.canterbury.ac.nz, ([email protected])
bDepartment of Earth & Atmospheric Sciences, University of Alberta, Canada – ([email protected]) cDepartment of Physics, University of Otago, Dunedin, New Zealand – ([email protected])
Commission VI, WG VIII/10: Cryosphere
KEY WORDS: ICESat, sea ice freeboard, McMurdo Sound, remote sensing, lidar
ABSTRACT:
This investigation employs the use of ICESat to derive freeboard measurements in McMurdo Sound in the western Ross Sea, Antarctica, for the time period 2003-2009. Methods closely follow those previously presented in the literature but are complemented by a good understanding of general sea ice characteristics in the study region from extensive temporal ground investigations but with limited spatial coverage. The aim of remote sensing applications in this area is to expand the good knowledge of sea ice characteristics within these limited areas to the wider McMurdo Sound and western Ross Sea region. The seven year Austral Spring (September, October, and November) investigation is presented for sea ice freeboard alone. An interannual comparison of mean freeboard indicates an increase in multiyear sea ice freeboard from 1.08 m in 2003 to 1.15 m in 2009 with positive and negative variation in between. No significant trend was detected for first year sea ice freeboard. Further, an Envisat imagery investigation complements the freeboard assessment. The multiyear sea ice was observed to increase by 254 % of its original 2003 area, as firstyear sea ice persisted through the 2004 melt season into 2005. This maximum coverage then gradually diminished by 2009 to 20 % above the original 2003 value. The mid study period increase is likely attributed to the passage of iceberg B-15A minimising oceanic pressures and preventing sea ice breakout in the region.
* Corresponding author.
1. INTRODUCTION
Quantification of Antarctic sea ice thickness is yet to be achieved. This is a significant goal as assessment of holistic change to the sea ice cover must account for volume (i.e. extent and thickness information must be available). No complete investigation has been completed to even produce a baseline data set from which change can be assessed. No satellite instrumentation is capable of directly retrieving sea ice thickness measurements as no technology is capable of detecting the ice-ocean interface from such range. Indirect methodologies offer the only feasible way of assessing the Antarctic sea ice cover holistically. The underlying principle of these methodologies is the detection of sea ice freeboard, the ice protruding above the ocean surface and subsequent conversion to thickness. The use of NASA’s Ice, Cloud, and land Elevation Satellite (ICESat) Geoscience Laser Altimeter System (GLAS) for total freeboard retrieval in the Antarctic has been well documented. ICESat offers a great opportunity for assessment of sea ice thickness in the Southern Ocean (Zwally et al. 2008). However, complications with the determination of sea ice freeboard from satellite altimetry methods have inherent errors, sometimes to the degree of the desired measurements. Accurate determination of freeboard is the prerequisite to thickness estimation; any errors in the initial freeboard calculation will be manifested in a later thickness calculation. Due to high precipitation rates in the Southern Ocean, complications are augmented by the common occurrence of negative ice freeboard as a result of snow loading. From laser altimetry methods, this
results in no information being gained on ice freeboard allowing no assessment of sea ice mass balance alone. Zwally et al. 2008 report that interannual changes in estimated thickness are mainly representative of snow thickness changes. Errors introduced to estimate thickness including nominal snow, ice and water density information can be quite significant (Yi et al. 2011). To further assess methodology accuracy other studies (Markus et al. 2011; Worby et al. 2011; Xie et al. 2011) have made use of in situ information to support satellite data.
The Ross Sea is an area of particular interest as it is the only sector in the Antarctic which has experienced a significant increase in sea ice extent during the satellite period (Comiso 2010). In the western Ross Sea, two polynyas are also important areas for sea ice production, the Terra Nova polynya and McMurdo Sound polynya (Comiso et al. 2011). The presence of this polynya in the study area furthers the areas importance with regard to its role holistically in the Ross Sea. The information available on sea ice extent and production is not however complemented by any information on thickness trends.
We assess the feasibility for deriving sea ice freeboard in the McMurdo Sound area in the south-western Ross Sea, where detailed ground information is available and a general idea of sea ice conditions is known (Dempsey et al. 2010). This investigation focuses on assessing sea ice freeboard retrieval from ICESat from 2003 to 2009. The 2009 data set is complemented by field measurements including near-coincident helicopter-borne lidar (HL) measurements and ground measurements for ice thickness, freeboard and snow depth permitting some comparison of freeboard retrieval techniques. International Archives of the Photogrammetry, Remote Sensing and Spatial Information Sciences, Volume XXXIX-B8, 2012
Figure 1. McMurdo Sound in relation to the Antarctic continent.
2. DETERMINATION OF SEA ICE FREEBOARD
The identification of the actual sea surface is the fundamental starting point for any freeboard investigation. The spaceborne retrieval of freeboard is hampered by the complexity of identifying a sea surface reference level over large areas. Multiple techniques can be used to establish tie-points at which additional information indicates that the sea surface is referenced by ICESat . They can be split into two groups, firstly by the use of the available ICESat product alone and secondly the additional use of auxiliary satellite imagery acquired in near-coincidence with the ICESat groundtrack.
In small geographical regions, such as this under investigation, tidal analysis together with a known mean sea level is another alternative.
An overview of ICESat’s operational information is presented in Yi et al. (2011). The following analysis is based on GLA 13 Records, Release 33 of the ICESat/GLAS data Product.
The general equation for generating an ideal sea surface reference level which takes account of environmental variables is given by:
Sea level = hELEV + hT + hIB + hDOT - hG (1)
where hELEV is the satellite measurement of surface height above the WGS-84 ellipsoid and hG is the geoidal height. By assuming that the geoid represents the mean sea level, the actual sea level is given by taking account of the tide level (hT) and by correcting for both the inverse barometric effect (hIB) and the water level change due to dynamic ocean topography (DOT) (hDOT). In general, the sum of hG, hT, hIB, and hDOT is a variable function in space and time and not known at the required accuracy. This can be circumvented by establishing the sea level at tie points along every single satellite track identifying the ice
free sea surface. The steps used in this investigation to generate a sea surface reference level for the relative determination of freeboard height closely follows Zwally et al. (2008), who use open water leads in the sea ice for this purpose. However, some amendments need to be made considering the shape of the geoid and tide measurements due to lack of open water in the southern part of the study area.
The sea ice area was first masked for land and ice shelf by comparison with Envisat Wide Swath Advanced Synthetic Aperture Radar (ASAR) imagery. As the resolution and georeferencing error of the imagery may have led to the inclusion of some ice shelf elevations an additional elevation mask was then applied to the data set allowing no positive deviation above the land fast multiyear (MY) ice at the southern end of the Sound. This area exhibits the maximum elevation of sea ice in the area as the positive geoid influence is at its greatest in the southern segments of the study area. Therefore, any value above the set -52.5 m WGS84 mask can be disregarded. The inclusion of large icebergs is also eradicated with this additional mask. Any tracks with land causing segregation of the track over greater than a 25 km distance were also removed.
Finally, all laser shots which have reflectivity values lower than 0.1 and higher than 0.9 are discarded as low and high reflectivity are indicative of forward scattering waveforms and saturated waveforms, respectively (Yi et al. 2011).
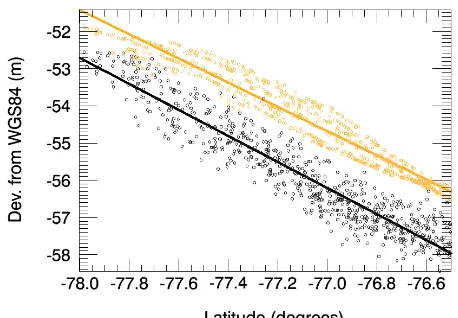
The Earth Gravitational Model 2008 (EGM2008) depicts the general shape of the geoid upon hELEV quite well (Figure 2).
Figure 2. Systematic sampling of every 100th shot in the record of all hELEV values (black) and EGM2008 (orange). The dominant trend in the hELEV is clearly the geoid. The modelled
trend is representative of the observations.
The recorded ICESat surface elevation (hELEV) is the initial elevation retrieval used in this investigation. This surface elevation is referenced to the WGS84 ellipsoid. Values were then adjusted in order to remove any bias on the sea surface reference level related to saturation errors (hSAT) and modelled tides (hT). Due to the small geographical area the influence of the inverse barometer effect (hIB) was neglected. Any remaining bias on the sea surface reference level can then be attributed to the modelled geoid (hEGM08) tides and hDOT. With insufficient information on the latter this is disregarded giving:
h ~ hELEV + hSAT + hT – hEGM08 (2) International Archives of the Photogrammetry, Remote Sensing and Spatial Information Sciences, Volume XXXIX-B8, 2012
h, is our best estimate of the ideal sea surface. The dominant influence upon h is from h EGM08.
Well documented in spaceborne altimetry literature is the fact that this reference level cannot be directly used as a surface from which an absolute measure of sea ice freeboard can be made. Although this holds true in the study region, we use the relative values as a basis to de-trend the elevation bias. The hELEV values are dominated by thin firstyear (FY) ice and open water. The modelled EGM2008 mean deviation from hELEV with inclusion of tidal variation is 1.81 m, over representing mean sea level.
Figure 3. Repeat track of ICESat track 381 across McMurdo Sound. 9 tracks are present in the repeat with 5 covering the full
length of the study area. All five tracks exhibit an unexpected positive deviation in h at the northern end of the profile.
The following steps of the method rely on the fact that the lowest elevation retrieval that can possibly be retrieved by ICESat is the sea surface, and that the sea surface is visible somewhere along the satellite track. The elevation profile h must therefore be sampled for its lowest elevation retrievals.
The sea surface height (SSH) is artificially generated from the lowest 5 % of elevation measurements along each track. The selection of a percentage value for this purpose is case dependent. Zwally et al. (2008) used a 2 % value and reported that an optimised value will be presented as our knowledge of the distribution of leads in the Southern Ocean improves. 5 % has been selected here as the amount of data along-track was less than available in large basin-scale assessments. This permits tracks with minimal elevation retrievals to be kept rather than discarded if only a limited number of points are available. This methodology filters out any tracks which are unable to produce at least 3 lowest elevation retrievals i.e. tracks that have less than 60 individual elevation retrievals. Furthermore, unlike previous methodologies, the site specific requirements resulted in no segmentation of the groundtrack with regard to a running mean and computation of relative elevations. It was known that the southern end of the elevation profiles were ice covered areas, therefore splitting the groundtrack for further improvement on residual geoid errors and the influence of DOT and tide would result in underestimated freeboards. Open water was only expected in the northern and central areas of the study area and therefore each individual track was not segregated but treated as one.
The lowest 5 % elevation retrievals are then averaged, this value (hS) is then subtracted from h giving a freeboard (Fb) value:
Fb = h - hs (3)
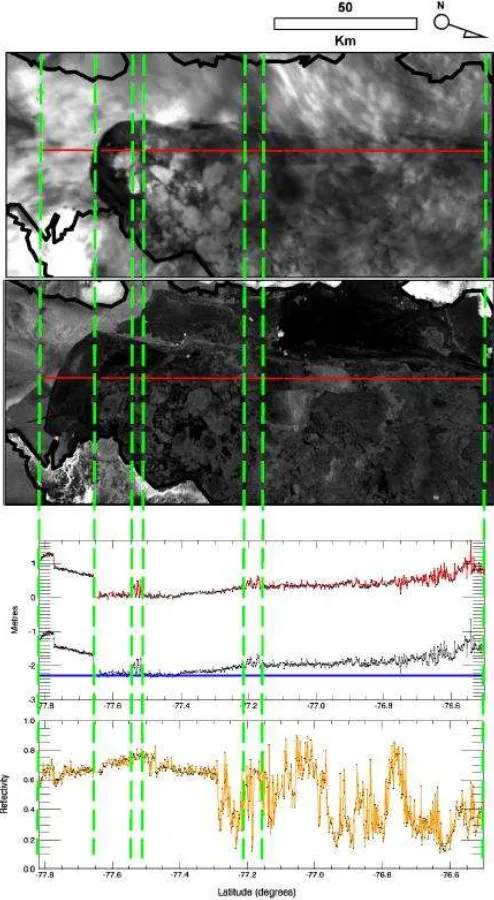
This is shown schematically in Figure 4.
Figure 4. Near coincident ICESat altimetry/reflectivity (T = 16/11/2003 0900), Envisat ASAR (T -17 hours) and MODIS (T +5.5 hours) imagery. Black dots are shot locations. Metres axis,
Fb (red), h (grey) and hs (blue)
3. RESULTS
From 2003-2009 the McMurdo Sound area (Figure 1) hosted two sea ice types. A MY sea ice area persisted in the southern portion of the Sound, fast to the McMurdo Ice shelf in the south, Hutt Peninsula in the east and the Antarctic continental coast in the west. A variable FY sea ice cover existed to the north andcovered the remainder of the study area. The area was assessed during Austral Spring, during the months of September, October and November making seven annual investigations of sea ice freeboard from 2003 through 2009. The study area was assessed holistically (Table 1 and Figure 5), and for MY and FY alone (Figure 6).
Table 1. Freeboard statistics of the study area for each year.
Year Number of shots Mean (1σ)
2003 7644 0.46 (+/- 0.37)
2004 5036 0.47 (+/- 0.39)
2005 5732 0.36 (+/- 0.31)
2006 5352 0.49 (+/- 0.43)
2007 6104 0.54 (+/- 0.44)
2008 1736 0.44 (+/- 0.41)
2009 1608 0.50 (+/- 0.38)
Figure 5. Mean freeboard (Fb) for the whole study area.
Figure 6. Mean freeboard for multiyear (MY) and firstyear (FY) sea ice in McMurdo Sound.
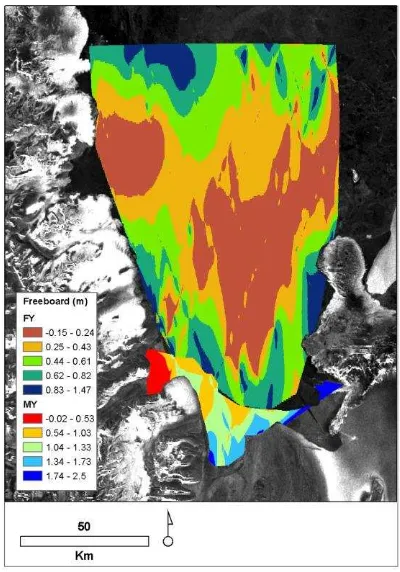
The methodology so far employed involves assessment of the elevation retrievals along track. When assessing smaller geographical regions the data scarcity becomes very apparent. Here, we filled in these gaps using a Natural Neighbour interpolation method to generate freeboard maps of the area. An example for 2003 is shown in Figure 7. The accurate representation of sea ice areas between groundtrack measurements is a crucial step to developing spaceborne assessment of sea ice freeboard.
Figure 7. Natural neighbour interpolation of separated multiyear (MY) and firstyear (FY) sea ice in McMurdo Sound for Sept/Oct/Nov 2003 overlaid upon a mid October 2003 Envisat
ASAR image. Mean freeboard of MY = 1.1 m, FY = 0.4 m.
In addition to the freeboard assessment, the Envisat Advanced Synthetic Aperture Radar (ASAR) instrument was used to investigate changes in MY and FY sea ice extent. ASAR Wide Swath imagery from mid October of each year indicates that the MY sea ice extent experienced a very large increase in area from 2004 to 2005 (Figure 8). A large area of FY sea ice up the western coastline persisted through the 2004 melt season into 2005 increasing the initial area of MY sea ice in 2003 by 254 %. In the following years this MY sea ice area experienced a gradual decline.
Figure 8. Multiyear (MY) and firstyear (FY) sea ice extent for the mid October period in each year for McMurdo Sound.
Extensive HL measurements were carried out in November 2009. By means of differential GPS measurements to remove helicopter altitude variations and ground validated air to surface laser measurements freeboard was obtained. Two field sites from that campaign are within 2km and 100 m of two ICESat tracks 15 and 9, respectively. The field measurements are temporally separated from their respective ICESat tracks by International Archives of the Photogrammetry, Remote Sensing and Spatial Information Sciences, Volume XXXIX-B8, 2012
about one month. Taking the mean of the 10 nearest ICESat shots to the field sites, the methodology performs well. Track 15 (mean value of 0.22 +/-0.1 m) corresponds well to the ground measurement (0.23 m). Track 9 (mean value of 0.47 +/-0.07 m) shows larger deviations to the ground measurement (0.22 m).
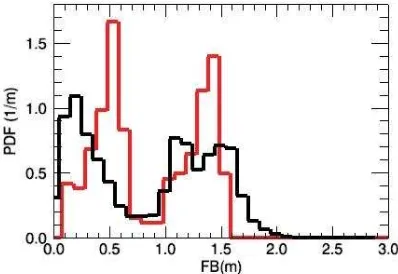
Probability Density Functions (PDFs) from ICESat and the HL flights show good overall agreement. Two peaks in the histogram are seen as FY and MY sea ice. ICESat exaggerates the FB of FY ice when compared to the HL. This is likely attributed to hs being too low in the southern area of the Sound.
Figure 9. Statistics for ICESat (red) and HL (black) freeboards.
4. DISCUSSION
This initial analysis shows the applicability of ICESat derived freeboard information to small scale assessment of areas of particular interest.
The degree of the method’s accuracy is dependent upon successful identification of water as the lowest 5 % elevation retrievals and minimised interference from remaining errors from unaccounted variables. This methodology in small geographical areas becomes a play off between data availability to create statistics and the magnitude of error. A positive trend between ellipsoid and geoid is seen toward the northern end of the profiles in h (Figure 3). The satellite repeat pass data indicates this is likely attributed to residual errors in the modelled geoid. Such deviations will need to be considered in any freeboard determination.
It is known that permanent MY ice was in existence at all times in the southern part of the Sound. During certain years, especially 2005, MY covered all the western areas of the Sound meaning no sea surface was visible along the groundtrack of the satellite. This has resulted in significant underestimation of sea ice freeboard along these groundtracks. Such a situation exemplifies the need for special care when applying the elevation error which results in the sea surface appearing lower (Zwally et al. 2008). Gain corrections have not been applied at the time of writing. Furthermore, reflections from clouds do not permit the use of laser reflectivity alone for ice-water
discrimination. We have shown in one example (Figure 4) that additional methods like imagery need to be used in support of laser reflectivity.
Data availability decreased through the study period with 2009 having only 21 % of data available compared to 2003. Interannual comparison of freeboard is therefore slightly hindered.
The final stage of conversion to thickness is highly influenced by snow depth. This step will be taken when a better knowledge of snow distribution across the Sound is gained. This is a further work in progress. The ground measurements reveal the complexities associated with snow cover. With track 9 the miss match is likely due to the size of the ICESat footprint (70 m) in comparison to the mean snow depth taken (0.03 m) over an area only 20 m in diameter. Snow is observed to be deeper in the east than in the west. The western ICESat groundtracks (like track 15) are more likely recording the actual sea ice freeboard. In the east (e.g. track 9), snow depths across the ICESat footprint may have been larger. Furthermore, intervening snowfall between measurements may be the source of the freeboard difference at cross-over points. This is only speculation and therefore errors in the methodology may also account for the disagreement in measurements.
The extent of MY ice is assumed to be closely related to the passage of the iceberg B-15A across McMurdo Sound (Arrigo et al. 2002) from mid 2002 to mid 2005. The drastic reduction in MY sea ice freeboard recorded by ICESat during 2005 is likely a result of this. The new MY ice with significantly smaller freeboard than the older MY ice to the south introduced a bias towards overall lower mean freeboard values.
The southern areas of the region have also been identified as harbouring sub-ice platelets, a component of the sea ice system occurring near ice shelves (Leonard et al. 2006). Subsequent investigation has revealed that the this sub ice layer is influential on sea ice growth rates (Purdie et al. 2006). It is possible that this interaction between the solid sea ice and the sub-ice platelet layer alters the freeboard. Further investigation is required to quantify this effect. This is especially important in Antarctica, where the outflow of cold ice-shelf water favours the formation of the sub-ice platelet layer.
5. CONCLUSIONS
This preliminary investigation provides the first time series of satellite derived sea-ice freeboard in the western Ross Sea. Using a combination of ICESat elevation data and auxiliary satellite imagery this investigation reveals evidence of steadily increasing freeboard heights of MY sea ice in McMurdo Sound for the period 2003-2009. No significant trends in freeboard were detected for FY sea ice. For localized areas the satellite derived freeboard height shows reasonable agreement with ground measurements. Freeboard and sea ice extent appear to be sensitive to local drivers of oceanic change including iceberg passages. Further work is needed to quantify the role of other drivers such as the sub-ice platelet layer in the region. From here, further methods including the analysis of local tide information to determine ICESat derived freeboard will provide an alternative data set for comparison. Errors associated with freeboard and snow depth estimation from satellite remote sensing platforms mean that in situ information is crucial in the development and validation of retrieval methodologies. International Archives of the Photogrammetry, Remote Sensing and Spatial Information Sciences, Volume XXXIX-B8, 2012
Though the sea ice cover around Antarctica is primarily seasonal, no conclusion can be made from this study that a similar trend as revealed is occurring with regards to sea ice thickness. Imperative is the development of an improved way of assessing the Antarctic sea ice cover with regards to its thickness. The European Space Agency’s CryoSat-2 may offer this development, as the interpretation of its waveform may shed light on snow depth. This is crucial to fully assess the thickness of seasonal Antarctic se ice.
This study is a basis to derive sea ice thickness maps in this specific region which requires information of snow on top of the sea ice.
6. REFERENCES
Arrigo, KR, van Dijken, GL, Ainley, DG, Fahnestock, MA & Markus, T 2002, 'Ecological impact of a large Antarctic iceberg', Geophys. Res. Lett., vol. 29, no. 7, p. 1104.
Comiso, J 2010, Polar Oceans From Space, Springer, New York.
Comiso, JC, Kwok, R, Martin, S & Gordon, AL 2011, 'Variability and trends in sea ice extent and ice producution in the Ross Sea', Journal of Geophysical Research, vol. 116, C04021, 19 PP., 2011.
Dempsey, DE, Langhorne, PJ, Robinson, NJ, Williams, MJM, Haskell, TG & Frew, RD 2010, 'Observation and modeling of platelet ice fabric in McMurdo Sound, Antarctica', J. Geophys. Res., vol. 115, C01007.
Leonard, GH, Purdie, CR, Langhorne, PJ, Haskell, TG, Williams, MJM & Frew, RD 2006, 'Observations of platelet ice growth and oceanographic conditions during the winter of 2003 in McMurdo Sound, Antarctica', J. Geophys. Res., vol. 111, no. C4, pp. 1-14.
Markus, T, Massom, R, Worby, A, Lytle, V, Kurtz, N & Maksym, T 2011, 'Freeboard, snow depth and sea-ice roughness in East Antarctica from in situ and multiple satellite data', Annals of Glaciology, vol. 52.
Purdie, CR, Langhorne, PJ, Leonard, GH & Haskell, TG 2006, 'Growth of first-year landfast Antarctic sea ice determined from winter temperature measurements', Annals of Glaciology, vol. 44, pp. 170-6.
Worby, A, Steer, A, Lieser, JL, Heil, P, Yi, D, Markus, T, Allison, I, Massom, R, Galin, N & Zwally, HJ 2011, 'Regional-scale sea-ice and snow thickness distributions from in situ and satellite measurements over East Antartica during SIPEX 2007', Deep-Sea Research II, vol. 58, pp. 1125-36.
Xie, H, Ackley, SF, Yi, D, Zwally, HJ, Wagner, P, Weissling, B, Lewis, M & Ye, K 2011, 'Sea-ice thickness distribution of the Bellingshausen Sea from surface measurements and ICESat altimetry', Deep-Sea Research II, vol. 58, pp. 1039-51.
Yi, D, Zwally, HJ & Robbins, JW 2011, 'ICESat observations of seasonal and interannual variations of sea-ice freeboard and estimated thickness in the Weddell Sea, Antarctica (2003-2009)', Annals of Glaciology, vol. 52, no. 57, pp. 43-51.
Zwally, HJ, Yi, D, Kwok, R & Zhao, Y 2008, 'ICESat measurements of sea ice freeboard and estimates of sea ice thickness in the Weddell Sea', J. Geophys. Res., vol. 113, no. C2, p. C02S15.
7. ACKNOWLEDMENTS
ICESat data is provided by the National Snow & Ice Data Centre, Boulder, Colorado. Gratitude is given to participants in the 2009 HL field work measurements. The field work was supported by Antarctica New Zealand in event K053 and K063. International Archives of the Photogrammetry, Remote Sensing and Spatial Information Sciences, Volume XXXIX-B8, 2012