PLANT SPECIES MONITORING IN THE CANARY ISLANDS
USING WORLDVIEW-2 IMAGERY
L. Nunez-Casillas a, *, F. Micand a, B. Somers b, P. Brito c, M. Arbelo a
a
Grupo de Observación de la Tierra y la Atmósfera (GOTA), Universidad de la Laguna,
38206 La Laguna, Tenerife, Spain - (lnunez, marbelo)@ull.es
b
Flemish Institute for Technological Research (VITO), Centre for Remote Sensing and Earth Observation Processes
(TAP), Boeretang 200, BE-2400 Mol, Belgium
-
[email protected]
c
Departamento de Biología Vegetal, Universidad de la Laguna 38206 La Laguna, Tenerife, Spain - [email protected]
KEY WORDS: Forestry; Monitoring; Detection; Multispectral
ABSTRACT:
The physical and climatic features of a relatively small volcanic island such as Tenerife (Canary Islands, Spain) cause increased difficulties to vegetation monitoring by means of moderate resolution satellite data. The use of multispectral very high resolution WorldView-2 (WV2) imagery provides promising perspectives for vegetation mapping in such a heterogeneous landscape. In order to assess its potential to estimate the cover fraction of dominant plant species in endemic Macaronesian laurel forests and heathlands, a hierarchical Multiple Endmember Spectral Mixture Analysis (MESMA) was performed within a study area where different patches from mature forest, to degraded forest and pine plantations can be found. First, a selection of pure pixels in the WV2 image for fern, Morella faya Ait., Laurus novocanariensis and the introduced species Pinus radiata were used to build a spectral library for each species. Last species Erica arborea L. was characterized in field by means of an ASD FieldSpec spectroradiometer, due to the rarity of pure pixels in this case, and to the simultaneous presence of two spectral subclasses depending on its flowering onset; WV2-adjusted spectral signatures from field reflectances were estimated by empirical calibration. Preliminary results showed a good separation of degraded from mature native forests and from plantations, although pine cover fraction is, in general, underestimated. The second MESMA cycle was useful to tell between most similar species, like in case of M. faya and L. novocanariensis.
* Corresponding author. This is useful to know for communication with the appropriate person in cases with more than one author.
1. INTRODUCTION
In Tenerife (Canary Islands) native monteverde forests are subtropical ecosystems as part of the Macaronesian region, at present a hotspot of biodiversity. They comprise endemic laurel forests and heathlands, where Morella faya (Ait.) Wilbur usually constitutes the tree cover of Myrico fayae-Ericetum arboreae communities in association with Erica arborea L. and other plant species (del Arco Aguilar, 2010). Both species are present in laurel forest Ixantho-Laurion azoricae, a more complex ecosystem, where several different tree species, like
Laurus novocanariensis (Rivas-Martínez et al., 2002) are abundant. Native and foreign species of pine have historically been introduced in some areas. The environment in the study region is a challenge for detailed monitoring of plant species distribution, due to its very high orographic heterogeneity and vegetation cover density.
The recently launched WorldView-2 (WV-2) satellite, partially conceived for applications in precision agriculture and natural resources monitoring, provides spectral information in 8 spectral bands: the 4 most common spectral regions (red, blue, green, near-IR) and 4 new bands (red edge, coastal, yellow and near-infrared 2) (Updike and Comp, 2010). Splitting the NIR region for more information and adding the narrow Red Edge band beyond the Red band, highly increases the sensitivity of
this sensor compared to other multispectral sensors in vegetation monitoring.
Spectral Mixture Analysis (SMA) (Adams et al., 1993; Roberts et al., 1993; Settle and Drake, 1993) is commonly used for species detection and mapping in heterogeneous ecosystems (Schmidt and Skidmore, 2003; Somers et al., 2009; Youngentob et al., 2011). The high degree of similarity among plant species from the study area would make preferable the use of hyperspectral rather than multispectral data. However, the lack of hyperspectral data, either from air- or space-borne sensors other than 30-m Hyperion data, in a study region with very high spatial heterogeneity, impel us to seek for alternative approaches. Here, the potential of a hierarchical Multiple Endmember Spectral Mixture Analysis (MESMA) (Roberts et al., 1998; Franke et al., 2009), in combination with WV2 imagery is explored, in order to map plant species distribution in this complex ecosystem. MESMA is a modification of simple SMA – where each pixel spectrum is modeled as a sum of weighted “pure spectra” or endmembers corresponding to their different proportions within the pixel (Adams et al., 1993; Roberts et al., 1993; Settle and Drake, 1993) – that allows a per-pixel variation of the number and types of endmembers. Finally, consecutive MESMA cycles will allow us to better discriminate between species with highest degree of similarity.
International Archives of the Photogrammetry, Remote Sensing and Spatial Information Sciences, Volume XXXIX-B8, 2012 XXII ISPRS Congress, 25 August – 01 September 2012, Melbourne, Australia
2. DATA AND METHODS
A WV-2 image from March 21st was used in this study (figure 1). The image was pre-processed and atmospherically corrected. Field reflectance measurements in the study area coincident with the satellite image acquisition, contributed to the validation of the atmospheric correction.
Figure 1. True color combination of WV2 image for the study area, and description of the three main vegetation covers present.
2.1 Spectral libraries
Two sets of spectra were collected for different species.
2.1.1 From pure image pixels: The first field dataset was a compilation of GPS locations where species were identified. The WV2 spectral signatures from the purest pixels were used later as endmembers in MESMA: the species registered were
M. faya (12), L. novocanariensis (6) and Pinus radiata (15), and spectral signatures for herbaceous species and fern (19) in degraded areas were also collected.
2.1.2 From field measurements: The second set was obtained from ASD FieldSpec 3 JR reflectance measurements in stands of M. faya, L. novocanariensis and E. arborea. A total of 69 spectral signatures were collected during a 4-day field campaign, including the day of the WV2 pass (March 14th, 15th, 20th and 21st).
Wavelength (nm)
ASD field signature for
M. faya
WV2 pure pixels signature
for M. faya
Empirical calibration
ASD WV2
427 0.0111 0.0037 -0.0074 478 0.0137 0.0157 0.0019 546 0.0302 0.0299 -0.0003 608 0.0267 0.0296 0.0029 659 0.0214 0.0243 0.0029 724 0.1630 0.1368 -0.0262 831 0.3153 0.2573 -0.0580 908 0.3454 0.2669 -0.0786
Table 1. Empirical calibration parameters resulting from the comparison between M. faya field and WV2 image samples.
! "# $ $ ! "#
% $ &
'
!
%( ) *
! "# $ $ ! "#
% $ &
'
!
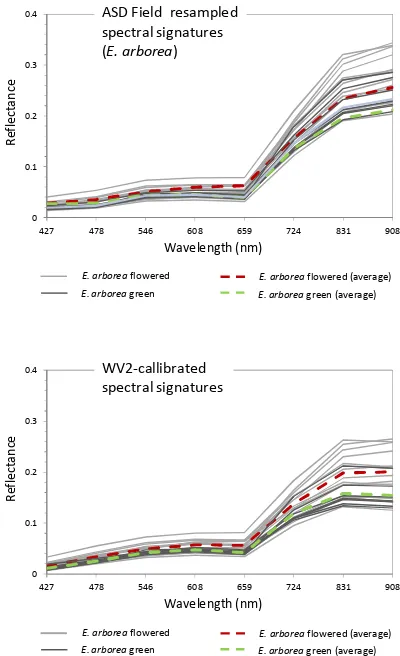
Figure 2. Empirical calibration of field spectra from Erica arborea measurements for endmember extraction in WV2 image. Two patterns noticeable between different phenological stages.
2.1.3 From re-calibrated field measurements: Given its less defined crowns compared to other species, it was difficult to identify pure image pixels for E. arborea, only with ASD measurements available. This was solved empirically by comparing ASD and WV2 spectra in other species where both data sets were available, and then obtaining a conversion coefficient to each band (table 1). These coefficients were added to E. arborea ASD spectra as a calibration method to obtain WV2-adjusted spectra (figure 2).
2.2 Forest mapping
First, a NDVI threshold (Rouse et al., 1973)) was used to mask out all non-vegetation areas in the study area. Only pixels with NDVI 0.5 were included in MESMA. Two unmixing cycles were applied. In the first cycle (mesma1), three endmember libraries were used: M. faya + L. novocanariensis -because of their spectral and ecological similarity they were fused together-, E. arborea and herbaceous/fern.
For the second MESMA (mesma2) cycle only the pixels with a sub-pixel cover fraction estimate above 80% of M. faya + L. novocanariensis were analyzed. This second cycle allowed us to differentiate between the main dominant tree species in the area: M. faya,L. novocanariensis and P. radiata.
International Archives of the Photogrammetry, Remote Sensing and Spatial Information Sciences, Volume XXXIX-B8, 2012 XXII ISPRS Congress, 25 August – 01 September 2012, Melbourne, Australia
3. RESULTS
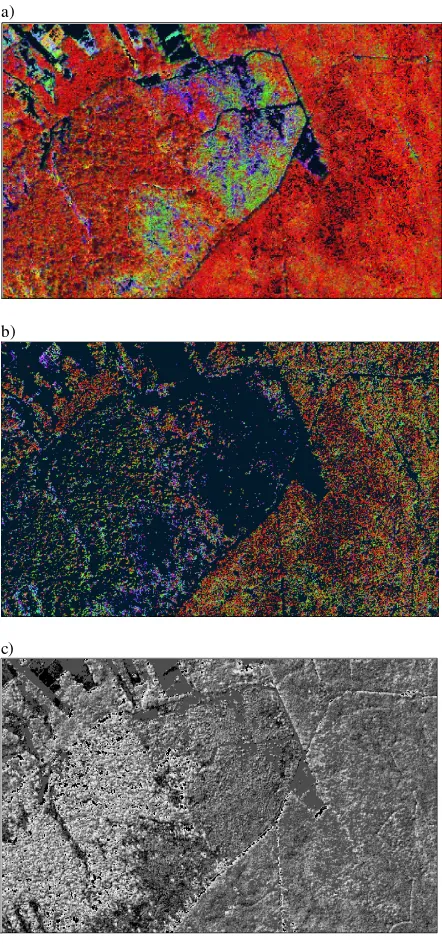
Preliminary results show remarkable distinction between well-conserved and degraded monteverde forest (figure 3a). However, subsequent MESMA cycles were needed to separate very similar species, like M. faya and L. novocanariensis images represent combinations of three endmembers corresponding to species or group of species used in the analysis; each color intensity correlates to the cover fraction of the species. a) mesma1: M. faya + L. novocanariensis (RED),
E. arborea (GREEN) and fern-herbaceous (BLUE). b) mesma2: M. faya (RED), L. novocanariensis (GREEN) and
P.radiata (BLUE). c) Shade fractions estimates, darker cells corresponding to lower proportion of shade.
from the total number of cells where the species were detected, whereas the actual cover area takes into account the species cover fraction in each cell as well. Q2 and Q3 correspond to the 50th and 75th percentile respectively.
Endmember Mature
Table 3. Cover fractions derived from MESMA grouped by the three main vegetation covers in the study area: mature forest, degraded forest and pine plantations.
The table 2 shows the total species distribution area obtained for each species in the entire study area after mesma1 and mesma2. Although E. arborea seems more spread than M. faya
(it is found in a greater number of cells), if we take into purity appears to be particularly high in M. faya with respect to the rest. dominant tree species in plantation areas of the study region is
P. radiata, the presence of P. canariensis (for which no spectral signatures were available) could have contributed to the underestimation of pine cover fraction. E. arborea,
International Archives of the Photogrammetry, Remote Sensing and Spatial Information Sciences, Volume XXXIX-B8, 2012 XXII ISPRS Congress, 25 August – 01 September 2012, Melbourne, Australia
however, was detected in a relatively large area in the study region, even though its cover fraction would be under 0.33 in the 75% of cases. Probably, a particularly high spectral differentiation of E. arborea with respect to other species during its flowering period. The species distribution is shown separately in table 3, according to three main areas in the study region: plantations, mature forest and degraded forest.
4. CONCLUSIONS
A hierarchical MESMA approach applied to WV2 data produced a fairly realistic dataset of species distribution and cover area in the native forests of the study region. A multitemporal approach should be taken into consideration, especially in the presence of species like E. arborea, which remarkably differs from the rest during the flowering period. Future work should focus on spectral libraries enrichment for larger areas of study, and the generation of extensive validation data by means of an accurate method of cover fraction, given the limitations of the existing forest inventories in the area of interest.
5. REFERENCES
Adams, J.B., Smith, M.O. and Gillespie, A.R.1993. Imaging spectrometry: interpretation based on spectral mixture analysis, In Pieters CM, Englert P, editors. Remote geochemical analysis: elemental and mineralogical composition, 7, pp.145-166. Cambridge Univ. Press, New York, U.S.A.
del Arco Aguilar, M. J., González-González, R., Garzón-Machado, V., Pizarro-Hernández, B. 2010. Actual and potential natural vegetation on the Canary Islands and its conservation status. Biodiversity and Conservation, 19, pp. 3089-3140.
Franke, J., Roberts, D.A., Halligan, K. and Menz, G. 2009. Hierarchical Multiple Endmember Spectral Mixture Analysis (MESMA) of hyperspectral imagery for urban environments.
Remote Sensing of Environment, 113(8), pp. 1712–1723.
Rivas-Martínez, S., Diaz, T.E., Fernández-González, F., Izco, J., Loidi, J., Lousã, M.E. and Penas, A. 2002. Vascular plant communities of Spain and Portugal. Addenda to syntaxonomical checklist of 2001, Part II. Itinera Geobotanica, 15, p. 703.
Roberts, D.A., Adams, J.B., and Smith, M.O. 1993. Discriminating Green Vegetation,Non-Photosynthetic Vegetation and Soils in AVIRIS Data. Remote Sensing of Environment, 44, pp. 255-270.
Roberts, D.A., Gardner, M., Church, R., Ustin, S., Scheer, G., Green, R.O. 1998. Mapping Chaparral in the Santa Monica Mountains using Multiple Endmember Spectral Mixture Models. Remote Sensing of Environment, 65, pp. 267-279.
Schmidt K.S. and Skidmore, A.K. 2003. Spectral discrimination of vegetation types in a coastal wetland. Remote Sensing of Environment, 85, pp. 92–108.
Settle, J.J. and Drake, N.A. 1993. Linear mixing and the estimation of ground cover proportions. International Journal of Remote Sensing, 14(6), pp. 1159-1177.
Somers, B., Cools, K., Delalieux, S. Stuckens, J., Van der Zande, D., Verstraeten, W.W. and Coppin, P. 2009. Nonlinear hyperspectral mixture analysis for tree cover estimates in orchards. Remote Sensing of Environment, 113, pp. 1183–1193
Updike, T. and Comp, C. Radiometric Use of WorldView-2 Imagery. 2010. Technical note. Digital Globe Inc., Longmont, Colorado, U.S.A.
Youngentob, K. N., Roberts, D. A., Held, A. A., Dennison, P. E., Jia, X., Lindenmayer, D. B. 2011. Mapping two Eucalyptus subgenera using multiple endmember spectral mixture analysis and continuum-removed imaging spectrometry data. Remote Sensing of Environment, 115 (5), pp. 1115-1128.
6. AKNOWLEDGEMENTS
This work was supported by the Spanish Ministry of Science and Innovation under grant CGL2010-22189-C02/CLI. The contribution of Ben Somers was supported by the Belgian Science Policy Office in the frame of the Stereo II progralle - project VEGEMIX (SR/67/146).
International Archives of the Photogrammetry, Remote Sensing and Spatial Information Sciences, Volume XXXIX-B8, 2012 XXII ISPRS Congress, 25 August – 01 September 2012, Melbourne, Australia