OPERATIONAL APPLICATION OF THE LANDSAT TIMESERIES TO ADDRESS
LARGE AREA LANDCOVER UNDERSTANDING
P. Scarthab, J.Armstonab, N Floodab, R Denhamab, L Colletta, F Watsona, B Trevithicka, J Muirab, N Goodwina, D Tindalla, S Phinnb a
Remote Sensing Centre, Department of Science Information Technology and Innovation, GPO Box 5078, Brisbane QLD 4001 ([email protected])
b
Joint Remote Sensing Research Program. Biophysical Remote Sensing Group, School of Geography, Planning and Environmental Management, The University of Queensland, Brisbane, QLD 4072 ([email protected])
Commission III, WG III/5
KEY WORDS: Landsat, Timeseries, Big data frameworks, Big data processing, Vegetation
ABSTRACT:
State Government agencies in northern and eastern Australia and the University of Queensland, Brisbane, have been collaborating through the Joint Remote Sensing Research Program (JRSRP). This has resulted in a significant acceleration in the development and successful operational application of remote sensing methods for the JRSRP members and the various state and national programs and policies which they support. The JRSRP provides an open and collaborative mechanism and governance structure to successfully bring together a unique combination of expertise in image processing, field data collection, and data integration approaches to deliver accurate, repeatable and robust methods for mapping and monitoring Australia’s unique ecosystems. Remote sensing provides spatially- and temporally-comprehensive information about land cover features at a range of scales and often for minimal cost compared to traditional mapping and monitoring approaches. This makes remote sensing a very useful operational mapping and monitoring tool for land managers, particularly in the vast rangelands of Australia. This paper outlines recent developments in remote sensing and modelling products that are being used operationally by JRSRP members to address large area landcover understanding.
1. INTRODUCTION
The measurement of vegetation horizontal and vertical structure state and change are essential for mapping and reporting purposes in ecology, forestry, hydrology, agriculture and related areas. Data on vegetation structure are also used for state, national and international reporting, but over large areas are difficult and time-consuming to measure with the degree of precision required for monitoring purposes. Remote sensing can provide spatially- and temporally-comprehensive information about land cover features at a range of scales and often for minimal cost compared to traditional mapping and monitoring approaches. This makes remote sensing a very useful operational mapping and monitoring tool for land managers, particularly across much of sparsely populated Australia.
State government agencies on the east coast of Australia and the University of Queensland have been collaborating since 2007 through the Joint Remote Sensing Research Program (JRSRP), which provides an open and collaborative mechanism and governance structure to successfully bring together a unique combination of expertise in image processing, field data collection, and data integration approaches to deliver accurate, repeatable and robust methods for mapping and monitoring Australia’s unique ecosystems. The JRSRP is supported by high performance computing infrastructure in both Queensland and New South Wales state governments, and also by national infrastructure provided by the Terrestrial Ecosystem Research Network (TERN) (http://www.tern.org.au). These systems implement automated processing streams for storing and managing extensive archives of field data, satellite, aerial and ground-based imagery including optical, radar and lidar data.
Mapping and monitoring extent and change in groundcover and woody vegetation is a core requirement of JRSRP partners to meet respective jurisdictions legislative requirements and to service a range of monitoring and reporting initiatives at local, state, national and global scales. Prior to open access of the USGS Landsat archive, JRSRP depended on sparse time-series of Landsat imagery to map wooded extent and Foliage Projective Cover (FPC) and detect land cover change on an annual basis (Armston et al., 2009; Danaher et al., 2010). Coordination of large area field and lidar observational databases and open access to the full Landsat archive has opened up new opportunities for advanced timeseries analysis and more frequent and rapid reporting on landcover change. The objective of this paper is to present an overview of recent developments undertaken by the JRSRP to advance application of the full Landsat archive to address large area landcover understanding.
2. OPERATIONAL SYSTEM COMPONENTS
2.1 High Performance Computing and Data Management
Observation Group (NEOG) and, more recently, from the United States Geological Survey (USGS). Other imagery in the archive includes imagery from SPOT 4 and 5 (extensive coverage in NSW and Queensland), MODIS, IKONOS, Quickbird, airborne and terrestrial lidar, Synthetic Aperture Radar (SAR) datasets including ALOS PALSAR, and aerial photography.
High Performance Computing (HPC) infrastructure consists of an SGI ICE Linux cluster with a 5PB robotic tape mass data storage facility. Data processing is undertaken using programs developed in-house in a range of programming languages including python (https://www.python.org/) and based on open source tools such as GDAL (http://www.gdal.org/), PostGRES/PostGIS (http://www.postgresql.org/) and the R statistical package (http://www.r-project.org/).
2.2 Preprocessing Landsat Timeseries
After the initial automated ingest of the Landsat L1T data, it is corrected to estimates of surface reflectance to account for atmospheric, reflectance, topographic and satellite sensor effects (Flood et al., 2013). In addition, undesirable elements such as cloud, cloud shadow and inundation are classified and masked from imagery (Goodwin et al., 2013; Zhu and Woodcock, 2012; Danaher and Collett, 2006). This ensures comparisons over space and time are consistent and repeatable and any changes detected are representative of true change and not due to artefacts or spurious measurements in the imagery. Full processing history is embedded in every file and all stages of the processing are stored on the mass storage facility to comply with government recordkeeping requirements.
2.3 Field Measurement Program
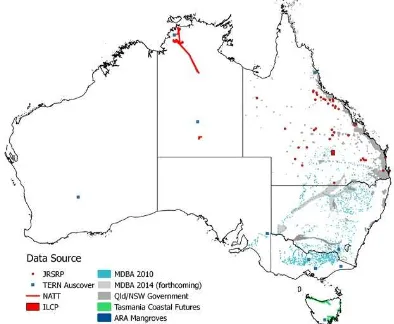
The JRSRP undertakes a range of field data collection activities for calibration and validation of satellite imagery and for other monitoring purposes. Land cover sampling follows Muir et al. (2011) and supports the Ground Cover Monitoring for Australia project and TERN’s Auscover facility in addition to JRSRP partner’s requirements. To date, in excess of 1500 sites have now been captured across Australia in a range of landscapes (Figure 1).
Other field sampling activities include the use and development of airborne and ground-based sensor technologies such as terrestrial laser scanning (TLS) and airborne lidar scanning (ALS; Figure 2) for calibration and validation of mapping and monitoring products. The resulting products have great potential for monitoring and informing erosion estimates and for quantifying landscape and vegetation attributes for production, biodiversity and land accounting (Armston et al, 2013).
TLS allow 3D reconstruction of canopy area, volume and above-ground biomass estimation. Development of TLS for large area estimation of above-ground biomass is being undertaken by the JRSRP in collaboration with the Terrestrial Laser Scanning International Interest Group (TLSIIG) (http://tlsiig.bu.edu).
Figure 1. Location of field calibration and validation sites which are used by the JRSRP to develop land cover products.
Many of these sites were collected by the Ground Cover Monitoring Project for Australia in partnership with state
agencies and TERN’s Auscover facility.
Figure 2. Location of airborne laser scanning (ALS) datasets acquired over Australia by TERN Auscover and collated by the
Queensland, New South Wales, Northern Territory and Tasmanian State Governments.
2.4 Estimation of Fractional Cover
Fractional cover is a product with three values representing the fraction of bare ground, green vegetation, and non-green vegetation. The vegetation fraction components represent the vertically-projected fraction of vegetation per unit area.
Scarth et al. (2010) used the fractional cover measurement sites (Muir et al., 2011) and Landsat surface reflectance data from across Australia to estimate endmembers for each cover fraction. These are used in a constrained spectral unmixing model to estimate fractional cover for each pixel in a Landsat image. The resulting product, termed fractional cover, is being produced and used operationally for a range of applications.
function between Landsat-7 ETM+ and Landsat-8 OLI are sufficient to warrant an empirical calibration of Landsat-8 OLI imagery prior to unmixing (Flood, 2014).
2.5 Seasonal Processing System
A seasonal data processing system has been developed based multidimensional median (medoid) composites of surface reflectance and fractional cover (Flood, 2013). Seasons are defined by the 3-month ‘calendar’ season. This method of compositing has the benefit of reducing the frequency of spurious measurements (e.g. unclassified cloud) and results in a regular temporal sequence, which is well-suited to time-series analysis applications. The seasonal composting also allows seamless mosaics to be built at national scales.
The seasonal processing system is based around the principle that all seasonal products should be perpetually kept up to date with respect to their inputs. New input data will always trigger a re-calculation of a given product, and the identification of new input files is driven solely by file modification timestamps. The system is generally run once a week and the default behaviour is to attempt to update any product, from any season, as defined in the system configuration file. This ensures that all products are kept up to date when new images become available in the Landsat time-series, or when a new WRS-2 path-row is added to the configuration file.
The general model is that when the system is run, it reads the configuration file, scans the file store and the PostGRES database, and works out what processing jobs need to be run to bring each product up to date. The full set of jobs is divided up into groups, the required inputs for a group are brought online then batch queue jobs are submitted to process them. While one group of jobs is running, the inputs for the next set are being brought online. When the batch jobs finish, the next group is submitted. Each product given in the configuration file is processed completely up-to-date before the next product is begun, which allows dependencies between seasonal products to be enforced.
The resulting data products are automatically pushed to the TERN/Auscover open data portals for immediate use by stakeholders and the public. These seasonal products are also used to build statistical summaries over the entire Landsat timeseries to assess long term change at national scales.
3. MAPPING AND MONITORING PRODUCTS
3.1 Persistent Green Vegetation Trends
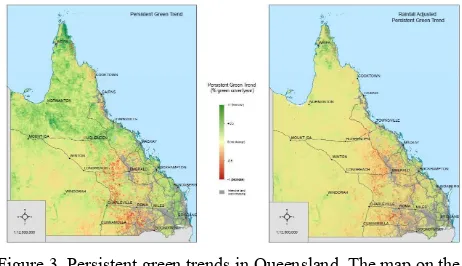
Persistent green vegetation fraction is modelled as the slowly varying minimum green fraction that is assumed to correspond to evergreen trees and shrubs. JRSRP researchers have been analysing trends in the seasonal persistent green vegetation fraction timeseries to monitor subtle, longer term changes in woody vegetation. Ongoing research is testing correspondence between trends in persistent green vegetation to factors such as climate variability, land management, altered fire regimes, increased atmospheric CO2 or woody weed encroachment (Figure 3).
Figure 3. Persistent green trends in Queensland. The map on the left shows the trend in persistent green vegetation over the Landsat time-series (~28 years). Green areas show a slight increase in persistent green vegetation, red areas slight decreases in persistent green vegetation. The map on the right shows the persistent green trend adjusted for rainfall. This map
suggests that rainfall accounts for a large proportion of the increases seen in persistent green vegetation. The decreases are still evident and indicative of land cover changes and vegetation
clearing associated with development in the 1990’s.
3.2 Ground Cover and Pasture Biomass
Ground cover consists of the non-woody, understorey vegetation, primarily grasses and forbs. The vegetation fraction from the fractional cover timeseries is equivalent to ground cover in the absence of tree and shrub cover. An approach has recently been developed to estimate groundcover in the presence of trees or shrubs, in order to improve understanding of seasonal and spatial dynamics of ground cover, particularly in savanna woodlands. The approach uses field measurements of fractional cover to empirically estimate overstorey non-green vegetation fraction. These estimates are used together with the seasonal persistent green vegetation fraction to model the ground cover fraction (Figure 4).
Figure 4. Ground cover mapping example for a property in northern Queensland during the late dry season (RGB = bare,
green and non-green fractions). The left image shows the fractional cover product, and the right image shows the ground
cover fraction product. The ground cover product reveals that there is a significant amount of non-green vegetation on the
ground surface beneath the tree and shrub overstorey.
3.3 Burnt area
The JRSRP has developed a method for automated detection and mapping of fire scars. The method, described in detail in Goodwin and Collett (2014) uses the dense time-series of Landsat, multi-date change detection and thermal data to discriminate fire scars in the landscape from the nearly 30 year archive of imagery. These data complement existing fire scar mapping systems based on MODIS and NOAA-AVHRR by providing higher resolution data where fire scars are able to be detected, and a greater historical perspective on burning regimes in the rangelands. To date, data has been produced state-wide for Queensland (Figure 5) and trials are currently underway in other states to evaluate the method for different environments across the country.
Figure 5. Example of Landsat fire scar mapping in Queensland. This example shows all fire scars mapped for the year 2001.
3.4 Woody Vegetation Structure and Biomass
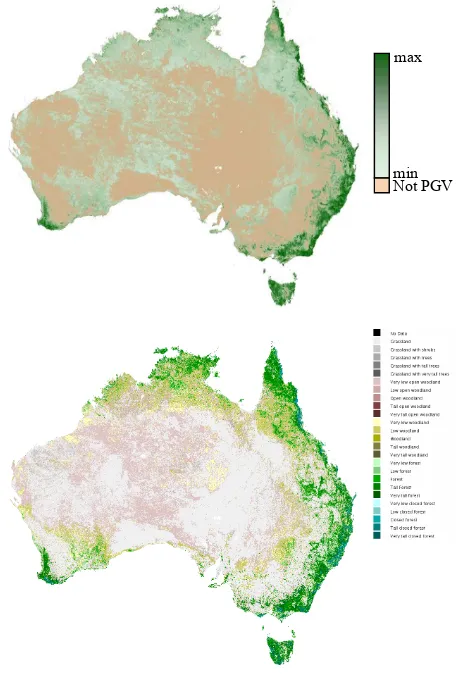
The JRSRP is also significantly enhancing its capability and contributions to research and development of active imaging systems such as radar and lidar for rangeland monitoring. Through a collaborative arrangement with the Japanese Aerospace Exploration Agency’s Kyoto and Carbon Initiative and TERN Auscover, the JRSRP have developed products which integrate field measurements, radar backscatter
coefficients from ALOS PALSAR data, airborne and space-borne lidar and Landsat-based persistent green products (Johansen et al., 2012) which improve vegetation structural formation (Figure 6) and above-ground woody biomass estimates for Australia.
Figure 6. Vegetation persistent green vegetation cover (top) and structural formation (bottom) maps for Australia. The structural formation map was generated from integration of the Landsat persistent green vegetation cover, ALOS PALSAR, and ICESat
GLAS satellite datasets.
4. CONCLUSIONS
The automated operational processing of a massive image archive into standard products has freed up researchers to concentrate on developing higher level products and models to advance whole of ecosystem understanding and reporting across large spatial extents. In addition, the linking of the higher level products into national open data streams has opened up these data to other researchers, non-governmental organisations and commercial application developers. By building on open data and using open source tools, the framework is scalable, extensible, economical, transparent and readily adaptable to address current and future landscape scale problems.
REFERENCES
Armston, J., Denham, R., Danaher, T., Scarth, P. and Moffiet, T., 2009. Prediction and validation of foliage projective cover Not PGV max
from Landsat-5 TM and Landsat-7 ETM+ imagery for Queensland, Australia. Journal of Applied Remote Sensing, 3(1), 033540. doi:10.1117/1.321603
Armston, J., Disney, M., Lewis, P., Scarth, P., Phinn, S., Bunting, P., Lucas, R., and Goodwin, N., 2013. Direct retrieval of canopy gap probability using airborne waveform lidar.
Remote Sensing of Environment. 134: 24-38.
http://dx.doi.org/10.1016/j.rse.2013.02.021
Bastin, G., Denham, R., Scarth, P., Sparrow, A., and Chewings, V., Schmidt, M., 2014. Remotely Sensed Analysis of Vegetation Cover Change across Queensland’s Rangelands 1988-2005. The Rangeland Journal 36: 191–204, doi: 10.1071/RJ13127
Bastin, G., Scarth, P., Chewings, V., Sparrow, A., Denham, R., Schmidt, M., O’Reagain, P., Shepherd, R. and Abbott, B., 2012. Separating grazing and rainfall effects at regional scale using remote sensing imagery: A dynamic reference-cover method. Remote Sensing of Environment 121: 443–457. doi: 10.1016/j.rse.2012.02.021
Bunting, P., Armston, J., Clewley, D., Lucas, R., 2013. Sorted Pulse Data (SPD) Library. Part II: A processing framework for LiDAR data from pulsed laser systems in terrestrial environments. Computers & Geosciences, http://dx.doi.org/10.1016/j.cageo.2013.01.010
Danaher, T., Scarth, P., Armston, J., Collett, L., Kitchen, J., and Gillingham, S., 2010. Remote Sensing of Tree–Grass Systems:
the Eastern Australian Woodlands. In Hill, M. J. and N. P.
Hanan, Eds. Ecosystem Function in Savannas: measurement and modeling at landscape to global scales. Boca Raton, CRC Press.
Danaher, T.J., Collett, L. 2006. ‘Development, optimisation, and multi-temporal application of a simple Landsat based Water Index’, in Proceedings of the 13th Australasian Remote Sensing and Photogrammetry Conference, November 2006, Canberra, Australia.
Flood, N., Danaher, T., Gill, T., and Gillingham, S., 2013. An Operational Scheme for Deriving Standardised Surface Reflectance from Landsat TM/ETM+ and SPOT HRG Imagery for Eastern Australia, Remote Sensing, 5(1): 83-109.
Flood, N., 2013. Seasonal Composite Landsat TM/ETM+ Images Using the Medoid (a Multi-Dimensional Median),
Remote Sensing. 5: 6481-6500.
Flood, N., 2014. Continuity of Reflectance Data between Landsat-7 ETM+ and Landsat-8 OLI, for Both Top-of-Atmosphere and Surface Reflectance: A Study in the Australian Landscape. Remote Sensing, 6: 7952-7970. doi:10.3390/rs6097952.
Goodwin., N. R. and Collett, Lisa. J., 2014. Development of an automated method for mapping fire history captured in Landsat TM and ETM+ time series across Queensland, Australia,
Remote Sensing of Environment. 148: 206-221.
Goodwin, N. R., Collett, L. J., Denham, R. J., Flood, N., and Tindall, D., 2013. Cloud and cloud shadow screening across Queensland, Australia: An automated method for Landsat TM/ETM+ time series. Remote Sensing of Environment. 134: 50–65, doi:10.1016/j.rse.2013.02.019
Johansen, K., Gill, T., Trevithick, R., Armston, J., Scarth, P., Flood, N. and Phinn, S. Landsat based Persistent Green-Vegetation Fraction for Australia. 16th Australasian Remote Sensing and Photogrammetry Conference. Melbourne, Australia, 2012.
Karfs, R.A., Abbot, B.N., Scarth, P.F. and Wallace, J.F., 2009. Land condition monitoring information for reef catchments: a new era. The Rangeland Journal, 31: 69-86.
Ludwig, J.A., Bastin G.N., Wallace J.F. & McVicar T.R., 2007. Assessing landscape health by scaling with remote sensing: when is it not enough? Landscape Ecology. 22: 163-169.
Muir, J., Schmidt, M., Tindall, D., Trevithick, R., Scarth, P., and Stewart, J.B., 2011. Field measurement of fractional ground cover: a technical handbook supporting ground cover monitoring for Australia, prepared by Queensland Department of Science, IT, Innovation and the Arts for the Australian Bureau of Agricultural and Resource Economics and Sciences, November.
Scarth, P., Roeder, A., and Schmidt, M., 2010. ‘Tracking grazing pressure and climate interaction - the role of Landsat fractional cover in time series analysis’, in Proceedings of the 15th Australasian Remote Sensing and Photogrammetry Conference, Alice Springs, Australia, 13-17 September 2010.
Zhu, Z. and Woodcock, C.E., 2012. Object-based cloud and cloud shadow detection in Landsat imagery. Remote Sensing of