SYNERGETICS FRAMEWORK FOR HYPERSPECTRAL IMAGE CLASSIFICATION
Rupert Müller, Daniele Cerra, Peter Reinartz
German Aerospace Center (DLR) Earth Observation Center (EOC)
82234 Wessling, Germany
{rupert.mueller, daniele.cerra, peter.reinartz}@dlr.de
KEY WORDS: Synergetics, hyperspectral image, image classification
ABSTRACT:
In this paper a new classification technique for hyperspectral data based on synergetics theory is presented. Synergetics – originally introduced by the physicist H. Haken – is an interdisciplinary theory to find general rules for pattern formation through self-organization and has been successfully applied in fields ranging from biology to ecology, chemistry, cosmology, and thermodynamics up to sociology. Although this theory describes general rules for pattern formation it was linked also to pattern recognition. Pattern recognition algorithms based on synergetics theory have been applied to images in the spatial domain with limited success in the past, given their dependence on the rotation, shifting, and scaling of the images. These drawbacks can be discarded if such methods are applied to data acquired by a hyperspectral sensor in the spectral domain, as each single spectrum, related to an image element in the hyperspectral scene, can be analysed independently. The classification scheme based on synergetics introduces also methods for spatial regularization to get rid of “salt and pepper” classification results and for iterative parameter tuning to optimize class weights. The paper reports an experiment on a benchmark data set frequently used for method comparisons. This data set consists of a hyperspectral scene acquired by the Airborne Visible Infrared Imaging Spectrometer AVIRIS sensor of the Jet Propulsion Laboratory acquired over the Salinas Valley in CA, USA, with 15 vegetation classes. The results are compared to state-of-the-art methodologies like Support Vector Machines (SVM), Spectral Information Divergence (SID), Neural Networks, Logistic Regression, Factor Graphs or Spectral Angle Mapper (SAM). The outcomes are promising and often outperform state-of-the-art classification methodologies.
1. INTRODUCTION
Hyperspectral image data cubes consist of hundreds of contiguous bands with high spectral resolution (e.g. < 10 nm) but normally coupled with low spatial resolution. The very rich spectral information of each image pixel allows distinguishing between spectrally close ground materials and hence to classify images with high accuracy, which is not possible using multispectral data. However the high dimensionality of the data signatures introduces several problems known as the curse of dimensionality (Scott 2008). In this paper a novel classification scheme for hyperspectral data in low dimensioned sub-spaces based on the principles of synergetics theory is presented. Synergetics (from Greek “Working together”) was originally introduced by the physicist H. Haken and is an interdisciplinary theory to find general rules for pattern formation through self-organization and has been successfully applied in fields ranging from biology to ecology, chemistry, cosmology, thermodynamics up to sociology (Haken 2007). In Laser theory fundamental research was carried out to describe the transition of completely disordered states to a state ordered in a macroscopic scale (Haken 1976). Essential in synergetics theory is the order parameter concept meaning that complex systems can be dominated by only few parameters. Although this theory describes general rules for pattern formation it was linked also to pattern recognition (Haken 1991). Pattern recognition algorithms based on synergetics theory have been applied to images in the spatial domain with limited success in the past, given their dependence on the rotation, shifting, and scaling of the images (Fuchs et al. 1988, Haken 1988a, Haken
1988b, Hogg et al. 1998, Kawano at al. 2006, Boebel et al. 1994, Maeda et al. 1999, Zhao et al. 2003). These drawbacks can be discarded if such methods are applied to data acquired by a hyperspectral sensor in the spectral domain, as each single spectrum, related to an image element in the hyperspectral scene, can be analysed independently.
The classification scheme based on synergetics systems can be described as follows (Cerra et al. 2012). In a first step the spectrum of each pixel is projected onto a space spanned by a set of user-defined prototype vectors, which belong to some classes of interest, and then attracted by a final state associated to a prototype. The spectrum can thus be classified, establishing a first attempt at performing a pixel-wise image classification using notions derived from synergetics. As typical synergetics-based systems have the drawback of a rigid training step, we introduce a new procedure which allows the selection of a training area for each class of interest, used to weight the prototype vectors through attention parameters and to produce a more accurate classification map through plurality vote of independent classifications. As each classification is in principle obtained on the basis of a single training sample per class, the proposed technique could be particularly effective in tasks where only a small training data set is available.
The paper reports an experiment on a frequently used benchmark data set. A hyperspectral scene acquired by the Airborne Visible Infrared Imaging Spectrometer AVIRIS sensor of the Jet Propulsion Laboratory acquired over the Salinas Valley in California, USA, with 15 vegetation classes. The results are compared to state-of-the-art methods.
2. CLASSIFICATION BASED ON PRINCIPLES OF SYNERGETICS THEORY
In the following the classification scheme for hyperspectral data based on the principles of synergetics theory is described. Originally synergetics theory is formulated using covariant and contravariant components of vectors to handle non-orthogonal spaces. The correspondence between such dual vector space operations and least squares (LS) methods in synergetics theory has been shown in (Cerra et al. 2012). Therefore the more common LS methods are used to describe the theoretical background.
In a first step of a typical synergetics based system the user selects some prototype patterns, each of which corresponds to a
class of interest. Letv'k∈RN, k =1,...,M be prototype vectors formed by N-dimensional real valued components of spectral signatures extracted from the hyperspectral image, which are assumed to be linearly independent and normalized to unit length by the column vectors of the prototypes. This set of prototype
vectors spans the subspace of classes Ωc ⊂RNwith the condition to be complied withM <N. An arbitrary spectral feature vector q=qˆ +r∈RN can be decomposed by a vector
q
ˆ , living in the subspace Ωc, and a vector r orthogonal to the subspace Ωc. This decomposition is equivalent to the minimization of the scalar productrTr. The vector qˆ is then
given by qˆ =Pq with the symmetric and idempotent orthogonal projection operator P=A
( )
ATA−1AT and the residual vector r=(I −P)q with I the unit matrix which is orthogonal to the subspace (it is remarked that each Hilbert space can be uniquely decomposed by orthogonal sub-spaces). The vector qˆ can be expressed as linear combination of the prototype vectors bywhere – in the parlance of synergetics – the expansion
coefficients qk are called order parameters. The order parameter space is a basic concept in synergetics as these parameters dominate complex systems in collapsing the degree of freedom (dimensionality reduction). It is again remarked that
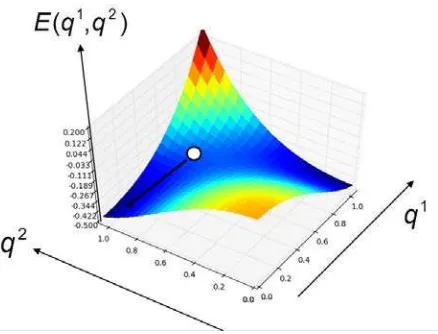
the least squares solution for qk corresponds to the orthogonal projection onto the subspace spanned by the prototype vectors. In synergetics theory an energy function (or loss function) is established with local energy minima for each of the prototype vectors (a prototype generates two symmetric minima but we consider here only the positive values).
positive values, also called attention parameters, which serve as weighting factors for classes. Equation (3) establishes a landscape of energy with local energy minima for each of the prototypes (see figure 1). The first term E1generates minima
along the prototype vectors, the second term E2discriminates
the prototypes, and the third termE3 envelops the energy system (saturation term).
The basic equation of synergetics for pattern recognition as formulated in (Haken 1991) describes the time evolution of a feature vectorq(t). A coupled differential equation (similar to the gradient descent method) defines a dynamic system by describing the time evolution of the order parameters. Loosely speaking, the feature vector q(t) is moving in the landscape of
Therefore, a classification process takes place as the initial pattern is pulled into one of the possible final states, each of which is linked to a prototype vector. The input is then assigned to the class of interest represented by the chosen prototype.
Figure 1 Energy function (equation 3) for two prototypes q1 and q2
in the order parameter space. An arbitrary vector (white circle) projected onto the subspace of the prototypes is attracted towards a stable final state according to equation (4).
Based on the observations that the order parameter with the highest value at t=0 is related to the prototype that will be chosen by the system as winning final state, the highest initial order parameter given by
{
q k M}
k k
k
, , 1 ; max
arg =
= (5)
defines the classification result (Haken 1991, Boebel et al. 1994, Zhao et al. 2003). This approximation also speeds up the classification procedure as the solution of the complex coupled differential equation (4) for each pixel is discarded. The nonlinear terms in equation (3) in combination with the settings of the B and C values should be investigated in the future.
Figure 2 Classification scheme. After selection of N training samples per class from the hyperspectral image N order parameter spaces are created and are used to project the hyperspectral image on this subspace. Each of this subspace projected image is independently classified after spatial regularisation. An iterative attention parameter tuning is performed and the final classification result is derived by majority voting.
According to (Cerra et al. 2012) a flexible classification scheme is established with the following steps (figure 2)
• For each class N training samples are selected from the hyperspectral image and a set of N order parameter spaces are produced (e.g first sample class 1, first sample class 2,..., second sample class 1, second sample class2,…). This is a more or less random selection of parameter spaces for individual samples in each class without repetition. It is noted that other random sets can be chosen.
• In order to get rid of “salt and pepper” classification results the spectral vector under investigation is displaced towards the neighbouring spectral pixels (e.g. 3x3 window) if the Euclidian distance is below some threshold. This adaptive spatial regularization is performed in the order parameter space.
• For the N subspaces N independent classifications applying Equation (5) are performed and assigned to a winning class according to plurality vote.
• The attention parameters for each of the prototypes are iteratively modified in order to attach individual weights to the prototypes. A relatively high attention parameter value
increases the attraction potential of a prototype whereas negative values switch off the prototype.
3. EXPERIMENT
For the experiment we analysed the benchmark dataset from the AVIRIS sensor acquired by the Jet Propulsion Laboratory over the Salinas Valley in California, USA. The spatial dimension of the full scene is 512 × 217 samples with 192 spectral bands ranging from 0.4 µm to 2.5 μm. The water absorption bands as well as noisy bands are removed for the data evaluation according to (Plaza et al. 2005). The sensor has a spectral resolution of 10 nm and a spatial ground resolution of 3.7 m.
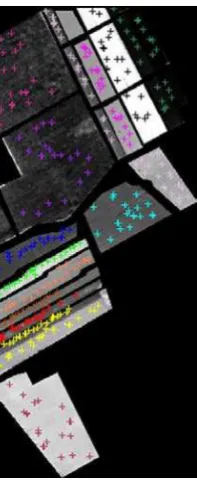
The data are given in at-sensor radiance values and include vegetables, bare soils, and vineyard fields. An example band of the scene and the available ground truth are shown in Fig. 2. Fig. 3 shows the twenty training samples per class, which have been chosen for the classification. The same number of independent classifications has been carried out, with the final result derived from a majority voting as explained in the previous section. Results of the independent classifications have
been improved by an additional step of attention parameters tuning, carried out with three different settings, all of them for 16 iterations. In the first setting, with a similar approach to the one contained in (Wang et al. 1993), we used the full ground truth as a reference and used it to tune the parameters as described in the above section. As this approach is not realistic in practical applications, where the classes of the test set are usually unknown, in a second setting, we selected a separate training set, consisting of 100 samples per class. Finally, in the third setting, we selected no additional training area, but
Figure 3 Test site Salinas (AVIRIS example band; left) and ground truth (15 classes; middle and right)
used for every classification one sample per class to build the prototype vector space and the other 19 to tune the λ parameters.
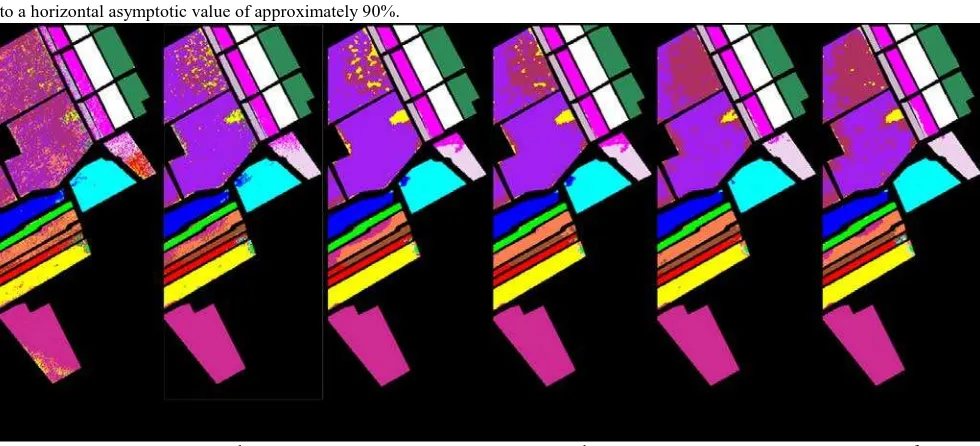
This introduces a negligible computational overhead, as the λ parameters tuning is achieved in linear time for the iterations. Fig. 6 shows the classification results for the overall scene. Fig. 6a presents the results for a classification carried out on the basis of a single training sample per class, with confusion and salt-and-pepper noise being evident in many classes. Results improve considerably in Fig. 6b, after a majority vote of 20 independent classifications. The improvement in overall accuracy (OA) achieved through majority vote agrees with the expected one of around 15% for a comparable number of independent classifications and accuracy of a single classifier (Kuncheva 2004). Salt-and-pepper noise in the classification is removed in Fig. 6c after a preliminary step of adaptive spatial filtering. Results benefit further from an automatic tuning of the attention parameters, with this improvement being more obvious when the full ground truth is taken as a reference ( see Fig. 6d and 6e).
Especially we have confusion between vineyards and grapes, different fallow or broccoli fields, and lettuces of different age. The improvements obtained through the automatic tuning of the attention parameters for the case of the full ground truth adopted are reported in Fig. 5. As the algorithm tries to find the best parameters for all classes, the classes of interest containing a large number of pixels are not given priority and may be penalized yielding a worse OA. On the other hand, the plot of the values for the average accuracy (AA) exhibits an increase up to a horizontal asymptotic value of approximately 90%.
Figure 5 Improvements of overall (OA) and average (AA)
accuracy by automatic attention parameter (λ) tuning
This suggests that the proposed training procedure, although empiric, converges to some local optimum. The selection of an extra training area is inconvenient, as it increases the size of the training set (Fig. 6d), or is not at all realistic for practical applications where no ground truth is available (Fig. 6e). Therefore, the final results in Fig. 8(f) represent the best compromise between accuracy and size of the training set, as an accuracy comparable to the classification in Fig. 6e is achieved without the need of an additional training area for the λ parameters. This is justified by the fact that the majority vote benefits from having as input more accurate classifications, achieved through separate λ parameters tuning steps.
a b c d e f
Figure 6 Classification results with different settings. (a) one training sample per class; (b) majority voting for 20 independent classifications using 20 samples per class; (c) same as (b), but with spatial regularization; (d) same as (c) but after attention parameter tuning using 100 validation samples for each class; (e ) same as (c) but after attention parameter tuning using the whole ground truth data; (f) best compromise between size of training samples per class (20 samples) and accuracy using 20 independent classifications combined by majority voting using one sample per class with the other 19 samples to tune the attention parameter
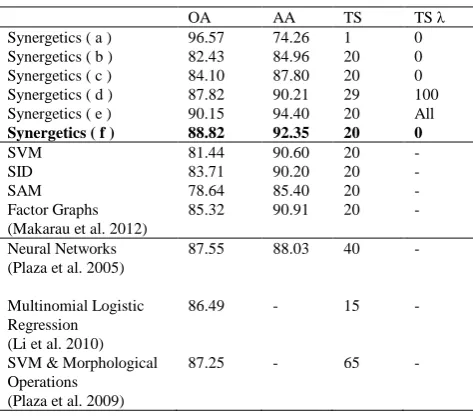
Table I
Classification results obtained by synergetics with different settings (see figure 6), other methods using the same training samples as for synergetics, other methods from previous works (see references).
Overall Accuracy (OA), Average Accuracy (AA), Number of training samples (TS), Additional Training samples to tune the
attention parameter (TS λ)
OA AA TS TS λ (Makarau et al. 2012)
85.32 90.91 20 -
Table I reports the classification accuracy on the data set. To mitigate the influence of the training samples, we produced four maps as in Fig. 6f. This resulted in an average OA of 88.12%, with a standard deviation in the results of σ = 0.7. In order to have a fair comparison to other techniques, we performed a classification with the same training data set using well-known distance measures and classification techniques widely used in hyperspectral data analysis. As distance measures, the spectral angle mapper SAM (Kruse et al. 1993) and the spectral information divergence SID (Du et al. 2004) have been applied in two different ways to produce a classification map: majority vote of 20 separate classifications and a single classification using the full training set, merging afterward the classes of interest, following the criterion of minimizing the overall errors. The two techniques gave similar results, and only the best results are shown, in which SID shows better discrimination power than SAM. We also performed a classification with support vector machine SVM (Joachims 1999), which operates in implicit parameter hyperspaces by finding a manifold which divides the data of interest in two groups in the hyperspace, according to some criteria. In spite of being a general classification methodology, SVM have been often applied to hyperspectral data, due to their natural connection to multidimensional data (Demir 2010). We used a Gaussian radial basis function kernel defined as K(u, v) = exp(−γ|u − v|2), which is found to yield the best results for the classification of a different AVIRIS scene (Indian Pines) in (Melangi et al. 2004). We found empirically the best parameters after several tests and set γ to 0.01 and assigned a large penalty to errors C = 100. We assess the statistical significance of the difference in classification accuracy against SVM by McNemar’s test (Foody 2004), which shows the two classifiers to be very different, with a probability for the differences in the results to be caused by random variations of some kind below 1%. Finally, we include results obtained through factor graphs (Makarau et al. 2012) also on the base of the same training samples, after applying a median filter to the parameter space. The main difference in the results between the proposed approach and its competitors is the
better discrimination between the classes grapes and vineyard untrained, which drastically improves after
the λ-parameter tuning.
We also compared results obtained on the same data set in recent works in literature (Plaza et al. 2009, Plaza et al. 2005, Li et al. 2010). As the first two make extensive use of morphological profiles, for sake of comparison, we took into account results obtained on the original spectral information, achieved with neural networks (Lee et al. 1993) in the former and with SVM classifiers in the latter. In both cases, a sequence of nine opening and closing morphological operations has been subsequently applied to regularize and improve classification results, in a step which could be comparable to the spatial regularization described in Section III-B. In the case of (Li 2010), we take into account the results obtained with multinomial logistic regression after the collection of both labeled (L) and unlabeled (U) samples, with U = 2L, before the integration of additional information through a segmentation step. Results summarized in Tables II and III show the proposed approach to be competitive both in terms of classification accuracy and number of training samples needed, with results reported in Synergetics (f) outperforming the competitors.
4. CONCLUSION AND OUTLOOK
We proposed a novel classification algorithm based on the principles of synergetics theory. Operations are performed in low dimensional order parameter spaces defined by the classes of interest. The classification scheme includes a flexible training step to improve class weighting as well as spatial regularization. The proposed classification approach combines different well known (hyperspectral) techniques.
• The normalization of the prototype vectors lowers different illumination influences as only the direction of the prototype vectors in the feature space significantly influences the results. This is similar to the well-known Spectral Angle Mapper (SAM).
• Orthogonal subspace projection leads to an optimal (in the sense of least squares minimization) representation of the feature vector living in the subspace spanned by the prototype vectors.
• Similar to spectral unmixing techniques the projected feature vector is expanded in the sub-space of the prototype vectors. The abundance values are related to the composition of the feature vector by the prototype vectors. The highest abundance value defines the classification result.
In this paper we used an approximation of the synergetics method using only the linear term. The non-linear terms, representing the interactions and competitions between the selected prototypes, should be investigated in further experiments.
5. REFERENCES
Boebel, F. G. and T.Wagner, T., 1994. “Theoretical foundations of synergetic image processing,” in Proc. Appl. Synergetics Synergetics Eng. Conf., 1994, pp. 46–52.
Cerra, D., Müller, R., Reinartz, P., 2012. „A Classification Algorithm for Hyperspectral Images Based on Synergetics Theory”, Geoscience and Remote Sensing, IEEE Transactions on , vol.PP, no.99, pp.1-12, 0 (online available)
Demir, B. and Erturk, S., 2010. “Empirical mode decomposition of hyperspectral images for support vector machine classification,” IEEE Trans. Geosci. Remote Sens., vol. 48, no. 11, pp. 4071–4084, Nov. 2010.
Du, H., Chang, C., Ren, H., Chang, C., Jensen, J. and D’Amico, F., 2004.“New hyperspectral discrimination measure for spectral characterization,” Opt. Eng., vol. 43, no. 8, pp. 1777– 1786, Aug. 2004.
Fuchs, A., Haken, H., 1988. Pattern Recognition and Associative memory as Dynamical Processes in a Synergetic System, Biological Cybernetics, 60, 17-22
Foody, G., 2004. “Thematic map comparison: Evaluating the statistical significance of differences in classification accuracy,” Photogramm. Eng. Remote Sens., vol. 70, no. 5, pp. 627–633, May 2004.
Haken, H. (1976), Laser and Synergetics. Phys. Bl., 32: 583– 590. doi: 10.1002/phbl.19760321213
Haken, H., 1988a. Neural and Synergetic Computers, Springer Verlag Berlin Heidelberg New York, ISBN 3-540-50339-0
Haken, H., 1988b. Nonequilibrium Phase Transitions in Pattern Recognition and Associative Memory, Zeitschrift Physikalische Blätter, Condensed Matter 70, 121-123
Haken, H., 1991. Synergetics Computers and Cognition. New York: Springer-Verlag, 1991, Springer Series Synergetics
Haken, H., 2007. Synergetics. Scholarpedia [Online]. 2(1), p. 1400. http://www.scholarpedia.org/article/Synergetics (8 April 2013)
Hogg, T., Talhami, T. and Rees, D., 1998. “An improved synergetic algorithm for image classification,” Pattern Recognit., vol. 31, no. 12, pp. 1893–1903, Dec. 1998.
Joachims, T., 1999. Making Large Scale SVM Learning Practical. Dortmund, Germany: Univ. Dortmund Press, 1999.
Kawano, H., Imamura, S., Maeda, H. and N. Ikoma, 2006. “3D rough reconstruction of buildings from streetscape by synergetic stereo matching,” in Proc. IEEE Int. Conf. SMC, Oct. 2006, vol. 3, pp. 1992–1999.
Kruse, F. A., Lefkoff, A. B., Boardman, J. B. Heidebrecht, K. B., Shapiro, A. T., Barloon, P. J. and Goetz, A. F. H., 1993. “The spectral image processing system (SIPS)—interactive visualization and analysis of imaging spectrometer data,” Remote Sens. Environ., vol. 44, no. 2/3, pp. 145–163, May/Jun. 1993.
Kuncheva, L. I., 2004. Combining Pattern Classifiers: Methods and Algorithms. Hoboken, NJ: Wiley-Interscience, 2004.
Lee, C. and Landgrebe, D. A., 1993. “Feature extraction based on decision boundaries,”IEEE Trans. Pattern Anal. Mach. Intell., vol. 15, no. 4, pp. 388–400, Apr. 1993.
Li, J., Bioucas-Dias, J., and Plaza, A., 2010. “Semisupervised hyperspectral image segmentation using multinomial logistic regression with active learning,” IEEE Trans. Geosci. Remote Sens., vol. 48, no. 11, pp. 4085–4098, Nov. 2010.
Maeda, H., Okada, S. and Irie, T., 1999. “A new method for stereo matching problem in computer vision using synergetics,” in Proc. IEEE Int. Conf. SMC, 1999, vol. 3, pp. 503–508.
Makarau, A., Müller, R., Palubinskas, G., and Reinartz, P., 2012. “Hyperspectral data classification using factor graphs,” International Archives of the Photogrammetry, Remote Sensing and Spatial Information Sciences, Volume XXXIX-B7, 2012 XXII ISPRS Congress, 25 August – 01 September 2012, Melbourne, Australia
Melgani, F. and Bruzzone, L., 2004. “Classification of hyperspectral remote sensing images with support vector machines,” IEEE Trans. Geosci. Remote Sens., vol. 42, no. 8, pp. 1778–1790, Aug. 2004.
Plaza, A., Martinez, J., Plaza, J., and Perez, R., 2005. “Dimensionality reduction and classification of hyperspectral image data using sequences of extended morphological transformations,” IEEE Trans. Geosci. Remote Sens., vol. 43, no. 3, pp. 466–479, Mar. 2005.
Plaza, J., Plaza, A. J., and Barra, C., 2009. Multi-channel morphological profiles for classification of hyperspectral images using support vector machines. Sensors [Online]. 9(1), pp. 196–218. Available: http://www.mdpi.com/1424-8220/9/1/196/
Scott D. W., 2008. The Curse of Dimensionality and Dimension Reduction. New York: Wiley, pp. 195–217
Wang, F. Y., Lever, P. J. A. and Pu, B., 1993. “A robotic vision system for object identification and manipulation using synergetic pattern recognition,” Robot. Comput. Integr. Manuf., vol. 10, no. 6, pp. 445–459, Dec. 1993.
Zhao, T., Tang, L., Ip, H., and Qi, F., 2003. “On relevance feedback and similarity measure for image retrieval with synergetic neural nets,” Neurocomputing, no. 51, pp. 105–124, Apr. 2003.