SEPERATION OF IKONOS
SENSOR’S
ELECTRONIC NOISE FROM ATMOSPHERIC
INDUCED EFFECTS
M. R. Mobashery a, M. Dastfard b
a Professor at department of Remote Sensing Engineering, Industrial University of Khajeh Nasir, [email protected] b
Graduate student of Telecommunication Engineering at Khavaran Institute, [email protected]
KEY WORDS: Atmosphere correction, remote sensing, IKONOS, CCD, Noise, sensor
ABSTRACT:
The quality of satellite images has always been of particular importance in remote sensing. Signals received from satellite sensors include some signals other than those of target signal that may be classified totally as the atmospheric effect and the sensor induced noise. Separating non-target signals and attempting in removing them from images is essential. One method for measuring and removing non-target signals is that of atmospheric correction by Dark Object Subtraction (DOS). This method is based on the sensor’s output for the targets that should have almost zero reflectance in a given band. Next, the obtained value will be deducted from the remaining pixels values; regardless of the type of the sensors. Each Charge-Coupled Device (CCD) has its own noise behavior; therefore, the amount deducted values from each pixel can be different for each CCD unit and type. Among the various noises of the CCD and their related electronic circuits, dark current noise, non-uniform pixels noise and read noise were selected to be studied in this paper. The data were obtained from multispectral sensor images of IKONOS. This sensor can provide images in two forms of Panchromatic (PAN) and Multispectral (MS). The results of this study showed that the amount of dark object pixels and the total amount of CCD noises in each band are different. Separation of the noises introduced in this paper from the amount of dark object pixel values can result in an upgraded method for image atmosphere corrections.
1. INTRODUCTION
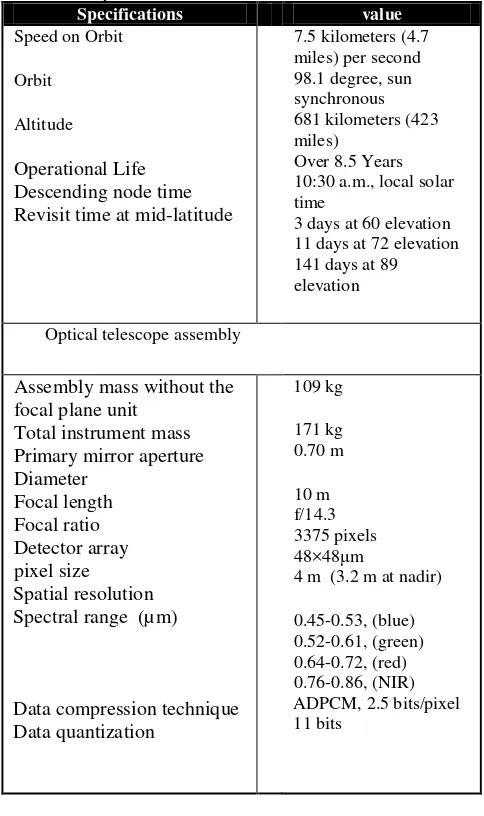
The world's first commercial satellite was launched on September 24, 1999 with the name of IKONOS. The satellite specifications are shown in Table 1. IKONOS collects images at an elevation angle of greater than 15 degrees and the azimuth unrestricted. Because the orbit is sun synchronous, all imagery is collected at approximately 10:30 a.m. local solar time (Dial, 2003). The speed of the satellite is 7 km/s. This means that 1-meter pixel ground is exposed to approximately 0.14 ms CCD. This time is too short because creating sufficient charge on the CCD array requires a minimum time of 0.7 ms. To resolve this problem, using the Time Delay Integration (TDI) technique is necessary (Baltsavias, 2001).
Kodak Company made a complex camera named Kodak TM 1000 (Delaney, 1999) for IKONOS satellite that was able to provide images at an altitude of 680 km above the Earth (in LEO orbit) (Gebreslasie, 2009). The first and most important characteristic of this optical telescope is that it has five mirrors, three of which focus the image onto the focal plane, while the other two mirrors bounce the formatted image sideways across the telescope's interior before coming to precise focus on the digital imaging sensors. Therefore, the length of the telescope reduces from 10 m to 2 m. The IKONOS camera specifications are shown in Table 1.
Identifying target signals has always been considered as one of the most important issues in the field of satellite image processing. Signals received from satellite sensors; often include some signals other than target signals, the group of which are defined as non-target signals. This includes sky radiance and path radiance (Tian, 2011). To this we can add the sensors electronic noise.
One method for measuring and removing non-target signals is that of atmosphere correction though the use of dark objects. The amount of energy emitted (radiance or reflectance) from
some earth targets in certain wavelengths, is close to zero (Pagnutti, 2003). In this case, the energy received by the sensor comes from non-target signals along with the noise of imaging system used. In this work, the dark pixels are identified and deducted from the surrounding pixels. By this way, the non-target and the sensor noise which mostly includes CCD noises are removed from the image. Due to the relatively low voltage the CCD output has, its noises affect the final image and most importantly on the signal to noise ratio (Howell, 2006). Separating the non-target signals from the sensor electronic noise is necessary. The noise of each CCD has a unique value. Therefore, by changing the sensor, the CCD characteristics and the noise value changes. Nevertheless, some CCD noises affect the image much more than the others. They are investigated in this study. Noises like dark current noise, non-uniform pixel and read noise are examples of these noises which are discussed here.
Images analyzed in this study were collected by the IKONOS sensor. This sensor can provide images in two forms of Panchromatic (PAN) and Multispectral (MS). IKONOS is a high-resolution satellite that provides Panchromatic images with a resolution of 1 meter and MS images with a resolution of 4 meter.
In this study, first a dark object in each image band is identified. The value of pixels in each band is then calculated. Next, the specified noises for each band are calculated separately. Each of these noises has different effects on image pixel values. Separating these noises from the dark object ones; makes it possible to predict electronic noise via changing the sensor, and to obtain a constant value for the sensor noise values.
Table 1 Specifications of IKONOS satellite and MS imaging system
Specifications value
Speed on Orbit
Orbit
Altitude
Operational Life Descending node time Revisit time at mid-latitude
7.5 kilometers (4.7 miles) per second 98.1 degree, sun synchronous 681 kilometers (423 miles)
Over 8.5 Years 10:30 a.m., local solar time
3 days at 60 elevation 11 days at 72 elevation 141 days at 89 elevation
Optical telescope assembly
Assembly mass without the focal plane unit
Total instrument mass Primary mirror aperture Diameter
Focal length Focal ratio Detector array pixel size
Spatial resolution Spectral range (µm)
Data compression technique Data quantization
109 kg
171 kg 0.70 m
10 m f/14.3 3375 pixels 48×48μm
4 m (3.2 m at nadir)
0.45-0.53, (blue) 0.52-0.61, (green) 0.64-0.72, (red) 0.76-0.86, (NIR) ADPCM, 2.5 bits/pixel 11 bits
2. DARK OBJECT
Among the common atmospheric correction methods, Dark Object Subtraction (DOS) is a simple and yet useful one to eliminate the effect of the atmosphere from images, especially when limited ground information is available (Gebreslasie, 2009). To obtain the dark object, IKONOS should seek zero reflectance surface covers. In order to achieve zero reflectance pixels in the green and blue bands, tree shades, and in the red
and infrared bands, water body can provide the dark object. Also, to avoid the effects of MTFC, the MTFC-off images should be selected (Pagnutti, 2003).
The smallest value in each band of the image with a cover of forests and water bodies represents the DN value of dark object (Soudani, 2006), (Mahiny, 2007). It is often preferred this approach to radiative transfer model for eliminating the effect of atmosphere. That is because in the radiative transfer model, measuring the water vapor in the air along with the aerosols as well as describing atmospheric conditions along with collecting earth data is difficult. Nonetheless, from a practical standpoint, the smallest amount of DN may also contain errors. That is because selection of the dark object value is based on a visual examination from the histogram values. Another error in dark object values as used for atmosphere correction –which is discussed in this article - is the sensor noise. Despite these errors, dark object subtraction technique has always been a good correction for the atmospheric effect on remote sensing data (Soudani, 2006).
The IKONOS image used in this work is an MS one from Quds town near Tehran. One of the main reasons for having chosen this region is that the image has both forests and water bodies. In Figure 1, these scenes are shown in two bands of near infrared and green. Taking a look at the images, one can realize that, for example, the body of water in the infrared band and shade of dense trees in the green band seem dark. The smallest amount of image pixels in each band is calculated with ENVI software and shown in Table 2. The small value of infrared compared to other bands represents a low path radiation and the high transmittance of atmosphere through the band (Richter, 2006).
3. CCD NOISE MEASUREMENT
The imaging system CCD can usually be demonstrated by three sub-systems. First, the CCD arrays convert photons within each pixel into electrons and voltage. Second, the electronic part of the camera performs a non-linear compression of the voltage values. Finally, the third sub-system is the analog to digital converter that generates digital image. During the process of converting radiation to digital image, various electronic noises enter into the system. In this paper, we investigate three noises, i.e. dark current noise, non-uniform pixel noise and Read noise, the first two of which are from CCD array noises and the last one is from CCD read circuit noises.
Image obtained from the dark object ( ) includes electronic sensor noise in addition to atmosphere effect ( ). The three noises can be modeled as a theoretical relation as follows:
Figure 1. Separating image into green and infrared bands: the right image represents a body of water in the near infrared band and the left one shows trees in the red band.
Where =non-uniform pixel noise =the dark current noise =read noise
is non-uniform pixel noise known as fixed pattern noise
that appears as a constant factor in the image pixels (Tisin, 2001), (Liu, 2008), (Wang, 2010). Another noise that is added cumulatively, is the dark current noise shown as in the relationship. is read noise related to CCD circuit read out. That is added as constants to the image pixels (Wang, 2010).
3.1 Dark current noise
This noise is the result of electrons generated by high temperature at the CCD and has always been one of the main challenges of CCD noise (Howell, 2006), (Liu, 2008). A theoretical equation for calculating the dark current noise is shown below (kodak, 2005), (Howell, 2006)
√
Where = area of each pixel (cm2)
= CCD dark current at 300 degrees Kelvin = energy gap of silicon
K= Boltzmann constant T=Kelvin temperature =CCD integration time CVF= CCD conversion factor
Here, can be obtained from the following equation:
To identify and eliminate dark current noise, the dark frame method is usually offered. In this method, in order to have a dark frame, conditions should be provided that prevent light from reaching the CCD. Dark frames should be prepared at the
same temperature and time as the original image, because the dark current value is changes linearly with time and also the CCD temperature affects the amount of this noise (Berry, 2005). The DN value of each pixel of dark frame (which can be positive or negative) shows the dark current noise (Lévesque, 2007), (Parimucha, 2005).
One of the stages of IKONOS relative radiometric calibration is the measurement of dark current noise using dark frames. This process is measured by camera with closed door during satellite flight and is shown in all bands and for each detector by curve (Taylor, 2007). As a theoretical approach, using dark noise mean in all detectors in each band can result in a dark current value for IKONOS CCD, the results of which are shown in Table 2.
3.2 Non-uniform pixel noise
This type of noise is generated as a result of pixel-to-pixel variations in the CCD response to non-uniformity of detectors in a uniform light (Howell, 2006), (Berry, 2005). To remove and measure this noise, flat-field techniques is one of the most and efficient method proposed. For preparing flat-field frames, different methods should be used to create a uniform light. In order to provide the best possible image from the flat field, doors of many telescopes are painted with special dyes that help reflect all wavelengths of light in the most uniform possible form. For example, in GeoEye-1 sensor calibration, this technique is used to prepare flat-field frame (Mulawa, 2010). . Another way to provide lighting to prepare flat-field frame, is to use the twilight sky to capture the image. But there are two major concerns in this regard. First, in this approach a uniform exposure to all pixels of CCD is difficult in practice. Second, the quantum efficiency across various CCD pixels is dependent on wavelength and thus a detailed distribution of wavelengths in the flat-field frame is needed. Nonetheless, zenith 13 ° East Aurora Sky is a nice area. (Howell, 2006).
For relative radiometric calibration and measurement of non-uniform noise of the CCD pixel based on IKONOS satellite, side-slither imaging techniques of a homogeneous earth target (desert, snow and ice) is the method used for this sensor. This method uses a 90-degree rotation of the focal plane to place focal arrays coordinated with and parallel to the orbital path rather than perpendicular to it. This will force all detectors to see the earth surface like a single detector. Therefore, more uniform statistical information is collected from the target compared to regular push broom collection (Chrien, 2006).This procedure can be seen in Figure 2. As a value for non-uniform pixel noise, the average curve obtained for each wavelength (Taylor, 2005) is calculated and shown in Table 2.
Fig 2. Side-slither imaging process and the image on the detector
3.3 Read noise
Another source of noise that is inherent in all CCDs is read noise which is considered as an important CCD noise particularly for low-intensity images. In principle, this type of noise can be classified as time noise, because the random produces a statistical distribution of possible responses with the focus on the mean value (Gaussian distribution), although the statistical distribution of this value is not necessarily Gaussian .Thus, even in a hypothetical case, if a pixel is reading out the same pixel twice, each time with identical charge, the answers can be slightly different. Second, the output electronic circuits produce fake electrons that will create unwanted random fluctuations in the output. These two effects are combined and create uncertainty in the final value of the pixel output. The average value of the uncertainty is called read noise that is controlled by the electronic properties of the amplifier range output and output electronic (Howell, 2006).
Before computing the read noise some information about the parameters with significant impact on the noise must be available. Three factors affect the results, i.e. CCD gain, flat-field image and bias frames. Zero image or bias frame enables us to measure zero noise level from one CCD.
To avoid negative values in the output image, electronic of temperature (Berry, 2005). (Parimucha, 2005). Flat-field frames are described in the non-uniform noise pixels.
Now let’s see how bias and flat field frames can determine the gain rate and read noise. First, a mean value of the pixels of a flat field and bias is calculated and are respectively named and . In the next step, the standard deviation of the measured images (shown as and ) will be calculated. The standard deviation can be obtained from the following equation:
√ ∑
Where N=number pixels μ =mean pixels =noise in each pixel
After we obtain standard deviation of bias image and flat-field, the following equation is used to calculate the gain:
design, pixel output synchronizers and different semiconductor designs can be used to increase the electronic output efficiency. Different methods of producing integrated circuits help to improve the read noise function.
4. DISCUSSION AND CONCLUSIONS
The main objective of this paper is to differentiate and measure IKONOS sensor electronic noises from atmospheric corrected images. Though, measuring all satellite electronic noises is hard or impossible, in this study, it is tried to assess some important CCD noises on their circuits that may have far greater impacts than any other noise on the images from satellites. As can be seen in Table 2, the DN values of dark object and noises investigated in 4 bands of IKONOS MS images are shown as a percentage of the amount of dark object. Noise removal
Although, dark object technique is one way to remove the atmospheric effects and other sensor noisesas well asseparating electronic noise and atmospheric effects, however it is wise tochange CCD and the related circuits to simultaneously estimate the effect of each noise on the received image.
REFERENCES
Baltsavias, E., Pateraki, M., Zhang, L., 2001. Radiometric And Geometric Evaluation Of IKONOS Geo Images And Their use for 3D Building Modelling, Joint ISPRS Workshop “High
Resolution Mapping from Space”, Hannover, Germany,
Berry, R.., Bumell, J., 2005. Handbook of Astronomical Image Processing Computer, 2005
Chrien, T., Schiller, S., Silny, J., 2006. On-Orbit Calibration and Focus of Responsive Space Remote Sensing Payloads, 4th Responsive Space Conference, Los Angeles, CA
Delaney, T., 1999. Satellite Imagery in Land Development Applications, EOM, pp. 47-48
Dial, G., Bowen, H., 2003. IKONOS satellite, imagery, and products, Remote Sensing of Environment, 88(1), pp. 23-36
Gebreslasie, M.B., Ahmed, F.B., Aardt, J.V., 2009. Image-based reflectance conversion of ASTER and IKONOS imagery as precursor to structural assessment of plantation forests in KwaZulu-Natal, South Africa, Southern Forests, 71(4), pp. 259-265
Howell, S.B., 2006. Handbook of CCD Astronomy, 2nd Edition, National Optical Astronomy Observatory and WIYN Observatory, Cambridge University
Kodak, 2005. CCD Image Noise Sources, URL: http://www. Kodak.com/go/Imager,2005.Revision 2.1
Lévesque, M. Lelièvre,” Evaluation of the accuracy of the dark frame subtraction method in CCD image Processing”, Defence R&D Canada – Valcartier,2007
Liu, C.,Szeliski, R., Kang, S.B., Zitnick, C.L., Freeman, W.T., 2008. Automatic Estimation and Removal of Noise from a Single Image, IEEE Transactions on Pattern Analysis and Machine Intelligence, 30(2), pp. 299-314
Mahiny, A.S., Turner, B.J., 2007. A Comparison of Four Common Atmospheric Correction Methods, Photogrammetric Engineering & Remote Sensing, 73(4), pp. 361-368
Marquez, M.j., 2012. A Bayesian approach to the inference of parametric configuration of the signal-to-noise ratio in an adaptive refinement of the measurements, arXive Astrophysics, 1208(1),
Mulawa, D., Kohm, K., podger, N., Mattox, p., 2010. On-Orbit Geolocation Accuracy and Image Quality Performance of the GeoEye-1High Resolution Imaging Satellite, ASPRS conference, San Diego, CA
Pagnutti, M., Rayan, R., Kelly M., Holekamp, K., 2003. Radiometric characterization of IKONOS multispectral imagery, Remote Sensing of Environment, 88, PP.53-68
Parimucha, S., Vanco, M., 2005, Photometry of the variable stars using CCD detectors, Contributions of the Astronomical Observatory Skalnaté Pleso, 35(1), pp.35-44
Richter, R.., Schlapfer, D., Muller, A., 2006. An automatic atmospheric correction algorithm for visible/NIR imagery,
International Journal of Remote Sensing, 27(10), pp. 2077-2085
Soudani, K., 2006. Comparative analysis of IKONOS, SPOT, and ETM+ data for leaf area index estimation in temperate coniferous and deciduous forest stands, Remote Sensing of Environment,102 , pp. 161-175
Taylor, M., 2005. IKONOS Radiometric Calibration And Performance after 5 Years on Orbit, CALCON Technical Conference, Logan, UT
Taylor, M., Dial, G., 2007. IKONOS Performance and Technical Update, URL:http://www.GeoEye.com
Tian, J., 2011. SNR Simulation with TDI set for Lake water Color Monitoring oriented satellite RS system Geoinformatics,
19th International Conference on IEEE, PP.1-5
Tisin, Y., Ramesh, V., Kanade, 2001. Statistical Calibration of CCD Imaging Process, IEEE 2001 International Conference on Computer Vision
Wang, J., Wang, Y., Li, C., 2010. Noise model hyperspectral imaging system and influence and radiation sensitivity, Journal of remote sensing, 14(4), pp.459-463