IMF POLICY PAPER
REVIEW OF THE FUND'S INCOME POSITION FOR FY 2014
AND FY 2015
–
2016
IMF staff regularly produces papers proposing new IMF policies, exploring options for reform, or reviewing existing IMF policies and operations. The following document(s) have been released and are included in this package:
The Staff Report on Review of the Fund’s Income Position for FY 2014 and FY2015–2016 was prepared by IMF staff and completed on April 7, 2014 for the Executive Board's consideration on April 28, 2014.
A Press Release summarizing the views of the Executive Board as expressed during its April 28, 2014 consideration of the staff report.
The policy of publication of staff reports and other documents allows for the deletion of market-sensitive information.
Electronic copies of IMF Policy Papers are available to the public from http://www.imf.org/external/pp/ppindex.aspx
International Monetary Fund
Washington, D.C.
REVIEW OF THE FUND’S INCOME POSITION FOR FY 2014
AND FY 2015–2016
EXECUTIVE SUMMARY
FY 2014 net income, including surcharges, is projected at SDR 2.7 billion. Lending income remains high, while investment income continues to be constrained by the historically low global interest rates.
The updated net income projections for FY 2014 include the effects of applying an amended international accounting standard (IAS 19), which governs the accounting treatment for employee benefits. The amended standard will be applied by the Fund for the financial statements starting in FY 2014 and will result in (i) a one-time retroactive adjustment of the Fund’s reserves of SDR 1.4 billion for unrecognized actuarial losses through FY 2013; and (ii) based on the latest estimates, IAS 19 gains of SDR 0.98 billion in FY 2014 that will to a large extent reverse the losses through FY 2013. The paper proposes to charge the special reserve with the one-time retroactive IAS 19 adjustment (effective May 1, 2013) and to place net income for FY 2014 to the special and general reserves, in line with the practice in recent years. Precautionary balances are now projected to reach SDR 12.8 billion at the end of FY 2014.
The paper proposes to retain currencies available for transfer to the investment account in the GRA. In light of the upcoming review of the investment mandate for the
of the Fund’s non-lending activities. This margin would be unchanged from the FY 2013-2014 period.
Approved By
Andrew Tweedie
Prepared by the Finance Department in consultation with the Legal Department and the Office of Budget and Planning
CONTENTS
INTRODUCTION _________________________________________________________________________________ 5
REVIEW OF THE FY 2014 INCOME POSITION __________________________________________________ 5
DISPOSITION DECISIONS ______________________________________________________________________ 11
FY 2015–2016 INCOME OUTLOOK ____________________________________________________________ 13
REVIEW OF SPECIAL CHARGES ________________________________________________________________ 26
BOXES
1. IAS 19 Accounting for Employee Benefits ______________________________________________________ 9
2. The Fund’s Reserves ___________________________________________________________________________ 12 3. The Rule for Setting the Margin for the Basic Rate of Charge _________________________________ 16
FIGURES
1. Impact of the IAS 19 Amendments on the Fund’s Reserves ____________________________________ 8 2. Summary of Disposition Decisions ____________________________________________________________ 14 3. Projected Reserve Accumulation ______________________________________________________________ 17 4. EMBIG Spreads: Total Composite and Bottom Quartile _______________________________________ 20 5. Advanced Country and EMBI Spreads at Time of Fund Arrangement _________________________ 33 6. Euro Area & EMBI Spreads ____________________________________________________________________ 34 7. Current Levels of SDR-Weighted Yields and Market-Implied Forward Rates __________________ 36
TABLES
ANNEXES
I. Decisions in Effect Related to the FY 2014 Income Position ____________________________________ 31 II. Comparator Measure for Market Cross-Check ________________________________________________ 32 III. Investment Account (IA) Performance Scenarios, _____________________________________________ 35 IV. Assumptions Underlying the Income Projections _____________________________________________ 39 V. Projected Income and Expenses—FY 2014 ____________________________________________________ 40 VI. Cumulative Burden Sharing Adjustments at end–January 2014_______________________________ 42
INTRODUCTION
1
1. This paper reviews the Fund’s income position for FY 2014 and FY 2015–2016.2 The paper updates projections provided in April 2013, and proposes decisions for the current year. In addition, the paper includes a proposed decision for setting the margin for the rate of charge under Rule I-6 (4) for the two financial years FY 2015–2016. The rule was adopted by the Executive Board in December 2011, and was first applied in April 2012 when the margin for the rate of charge was set for the FY 2013–2014 period.3
2. The paper is structured as follows: The first section reviews the FY 2014 income position and the main changes from the previous projections; the second section makes proposals on the disposition of FY 2014 net income and placement to reserves; the third section discusses the margin on the rate of charge for FY 2015–2016, provides the income projections for that period, and
projected burden sharing adjustments; and the last section reviews special charges.
REVIEW OF THE FY 2014 INCOME POSITION
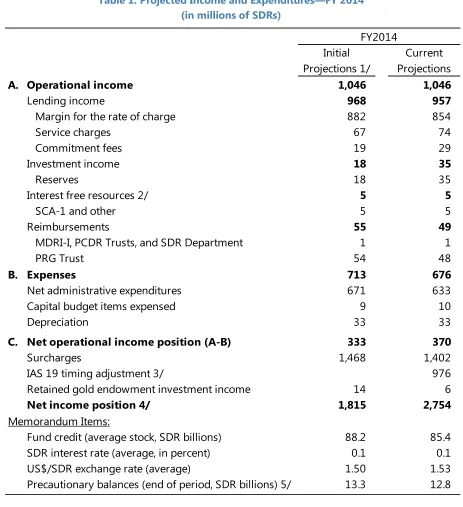
3. FY 2014 net income is now projected at SDR 2.7 billion compared with an initial estimate of SDR 1.8 billion (see Table 1).4 Key factors affecting the updated projections are as follows:
Lending income: Operational lending income (margin, service charges, and commitment fees) is estimated at SDR 957 million, about SDR 11 million or 1 percent lower than the earlier estimate. Surcharge income is now projected at SDR 1.4 billion, some SDR 66 million or 4 percent below the initial estimate. Each of these variables is discussed further below:
Margin income has been revised downwards by SDR 28 million reflecting a small decline in projected average credit outstanding for FY 2014. The updated projections point to average credit outstanding of SDR 85.4 billion compared with SDR 88.2 billion projected at the beginning of the year. The revised projections reflect the delay of scheduled disbursements under existing arrangements, partially offset by drawings under new commitments approved since April 2013.
Service charges have increased from the previous estimate by SDR 7 million largely due to drawings under the new arrangements.
Commitment fees are higher by SDR 10 million as a result of the expiration of a precautionary Stand-By Arrangement.5
1
Prepared by a team led by J. Mburu comprising: A. Attie, S. Bassett, R. Bhullar, S. Davidovic, M. Hoare, H. Imamura, L. Kohler, D. Nana, A. Perez, and T. Thilenius under the guidance of D. Andrews (all FIN).
2
A companion paper provides an update on The Consolidated Medium-Term Income and Expenditure Framework. 3
Surcharge income is lower than the earlier estimate reflecting lower projected average credit outstanding.
Investment income: Investment income for FY 2014 is now estimated at SDR 41 million, compared with initial projection of SDR 32 million:
The Fixed-Income Subaccount: In the 10 months through end-February 2014, the subaccount returned SDR 30 million. The expected returns from this subaccount for the year amount to SDR 35 million, but the returns have been subject to increased market volatility reflecting investors changing expectations of the pace of withdrawal of accommodative monetary policies, and the portfolio remains subject to downside risks in a rising interest rate environment.
The Endowment Subaccount: The portfolio is largely invested in short-term fixed deposits pending the phased investment into its strategic asset allocation. The funding, which is expected to be in equal tranches over a three-year period, began in March 2014. The portfolio is expected to return about SDR 6 million or 10 basis points in line with the SDR interest rate.
Temporary Windfall Profits Subaccount: This subaccount returned income of SDR 0.5 million or 3 basis points. The account was terminated in October 2013, following the second partial distribution of the general reserve to the membership for the benefit of the Poverty
Reduction and Growth Trust.6
Reimbursements to the General Resources Account (GRA): The GRA is reimbursed annually for the expenses of conducting the business of the SDR Department, of administering the PRG Trust, and of administering SDA resources in the MDRI-I and the PCDR Trusts.7 The GRA will be reimbursed for the expenses of conducting the business of the SDR Department in FY 2014 through an
assessment on participants in the SDR Department (proposed Decision 1).8 These expenses are estimated at SDR 1.373 million. Expenses of conducting the business of the MDRI-I and PCDR Trusts are estimated at SDR 0.01 million and SDR 0.012 million, respectively (proposed Decisions 2 and 3). The estimated PRGT expenses for FY 2014 to be reimbursed to the GRA are SDR 48.14 million
5
Commitment fee income is only recognized at the expiration or cancellation of an arrangement. The fees from the two-year Flexible Credit Line (FCL), Precautionary and Liquidity Line (PLL), and the precautionary Stand-By
Arrangements are included in income at their projected expiration date. 6
See Proposal to Distribute Remaining Windfall Gold Sales Profits and Strategy to Make the Poverty Reduction and Growth Trust Sustainable(- 9/17/2012) .
7
Reimbursement to the GRA from the MDRI-I and the PCDR Trusts is for expenses not already attributable to other accounts or trusts administered by the Fund, or to the GRA.
8
(proposed Decision 4).9 The total reimbursements of SDR 49 million are broadly in line with earlier estimates.
Expenses: Net expenses are estimated to be about SDR 37 million lower than previously projected. This is largely attributed to lower-than-projected spending in the net administrative budget of about SDR 25 million and movements in the U.S. dollar/SDR exchange rate of about SDR 13 million. 10
IAS 19: The FY 2014 income outturn has also been affected by the accounting treatment for employee benefits (IAS 19) discussed further below.
Accounting for Employee Benefits (IAS 19)
4. Under International Financial Reporting Standards (IFRS), the Fund is required to implement the amended IAS 19 in FY 2014. 11 Since FY 2000 the financial statements of the Fund have been prepared on the basis of International Financial Reporting Standards (IFRS) and the accounting for employee benefits, including pension and post-employment benefits, is governed by the provisions of IAS 19. As allowed by IAS 19, for financial years through FY 2013, the actuarial gains and losses arising from changes in the actuarial assumptions relating to these obligations have been deferred instead of being taken into income in the relevant financial year. An amendment to IAS 19, which is effective for the financial statements starting in FY 2014, eliminates the option to defer gains/losses (see Box 1).
5. The implementation of the amended standard will require a retroactive one-time adjustment to the Fund’s reserves due to cumulative actuarial losses not previously recognized
in the Fund’s income statements. These unrecognized losses amounted to SDR 1.4 billion through FY 2013 and are mainly attributable to the steady but significant decline in the discount rate used to value the Fund’s defined benefit obligation from FY 2009 to FY 2013.12
While these unrecognized losses, which do not represent actual cash outflows, are relatively significant, they could be reversed in subsequent financial years as interest rates normalize, including in FY 2014. At end-February 2014, the discount rate had risen by about 60 basis points from a historic low of 4.05 percent in FY 2013.13 This development, coupled with strong asset performance during the current financial year, suggests that
9
Starting in FY 2013, the practice of reimbursing the GRA for the expenses of conducting the business of the PRG Trust was resumed. The reimbursement is an important element of the Fund’s new income model endorsed in 2008. See Review of the Fund’s Income Position for FY 2013 and FY 2014 (4/30/13).
10
The projected outturn is approximately US$40 million lower than budgeted (4/1/14) and the updated US$/SDR exchange rate is about 1.53 compared with the earlier projection of 1.50.
11
The amended IAS 19 is effective for reporting periods beginning on or after January 1, 2013. Starting with FY 2014, the financial statements will need to reflect the amended IAS 19 so as to be fully compliant with IFRS.
12
IAS 19 requires that the discount rate be based on high-quality corporate bonds. The Fund uses the Citigroup Pension Discount Curve to obtain the discount rate.
the previously unrecognized losses through FY 2013 could be largely reversed by the estimated recognized gains of about SDR 0.98 billion in FY 2014 (see Table 1).14
6. Staff proposes that the retroactive one-time adjustment under the amended IAS 19 be charged against the special reserve. As required by IFRS, for financial reporting purposes, the one-time adjustment will be charged against reserves at the beginning of FY 2014 rather than being recognized in the current financial year. Staff proposes to charge the adjustment against the special reserve since net operating income, which from FY 2000 has included IAS 19 adjustments, has been placed to the special reserve. The retrospective adjustment will bring the Fund’s special reserve to the level that would have resulted if actuarial gains and losses had not been deferred through end-FY 2013. A Board decision (Decision 5) is included in the draft decisions to charge this one-time adjustment to the Fund’s special reserve effective May 1, 2013.
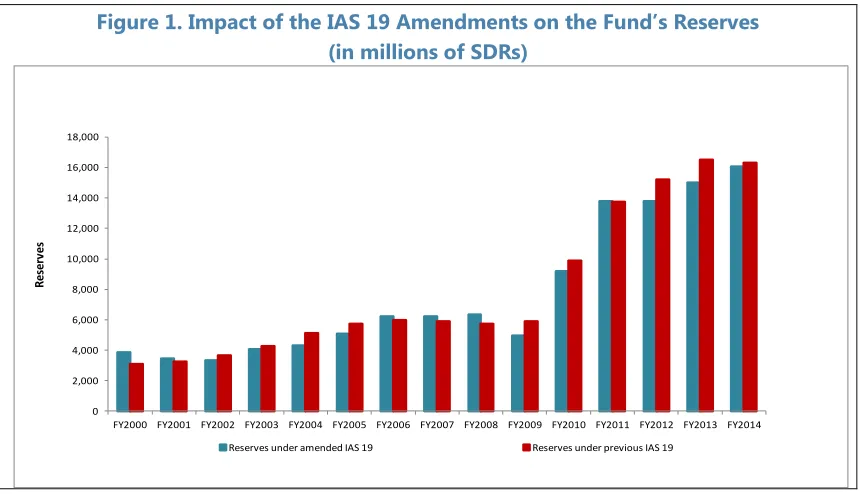
7. The elimination of the option to defer recognition of actuarial gains and losses under the amended IAS 19 will introduce an additional source of volatility in the Fund’s income. However, over time these gains and losses tend to offset as a reflection of the market cycles and the outflow of resources required to fund the pension plans will be factored in to the actuarial
[image:9.612.92.522.394.641.2]valuations. Figure 1 is a presentation of the effects of the amended IAS 19 had the actuarial gains and losses been recognized instead of being deferred since the adoption of the standard in FY 2000. The figure highlights that, based on the Actuary’s projections as of mid-March; the Fund’s reserves at end-April 2014 would be slightly lower following the implementation of the amended IAS 19.
Figure 1. Impact of the IAS 19 Amendments on the Fund’s Reserves (in millions of SDRs)
14
The final FY 2014 IAS 19 timing difference will be determined following the close of the financial year when the discount rate and the actual return on the plan assets are finalized.
0 2,000 4,000 6,000 8,000 10,000 12,000 14,000 16,000 18,000
FY2000 FY2001 FY2002 FY2003 FY2004 FY2005 FY2006 FY2007 FY2008 FY2009 FY2010 FY2011 FY2012 FY2013 FY2014
R
e
se
r
v
e
s
Box 1. IAS 19 Accounting for Employee Benefits
Background
Since the adoption of International Financial Reporting Standards (IFRS) in FY 2000, the Fund has followed IAS 19 in accounting for employee benefits. The objective of IAS 19 is to ensure that the liability associated with services provided by employees in exchange for benefits to be paid in the future and the related annual expense is properly recognized by the employer in its financial statements. IAS 19 prescribes the accounting by employers for (i) short-term employee benefits (e.g., salaries and wages); and (ii) post-employment benefits (e.g., pension, post-retirement health benefits, and
termination grants). The employer recognizes an expense for short-term employee benefits as soon as an employee has rendered services. Cash outflows associated with long-term benefits are subject to a high degree of uncertainty and are actuarially determined.
Accounting for post-employment and long-term benefits
To meet the benefit obligations associated with post-employment and long-term benefits, the Fund has funded a defined benefit plan (Staff Retirement Plan) and a separate Retired Staff Benefits Investment Account. The Fund reports on the balance sheet a net asset or liability equal to the difference between the fair value of plan assets and the net present value of the defined benefit obligation. The change in
the net asset (or liability), after taking into account the employer’s contributions to the plans, determines
the IAS 19 expense for the year.To determine the present value of the defined benefit obligation, the Fund discounts projected future cash outflows by applying demographic assumptions (e.g., mortality and employee turnover), and financial assumptions (e.g., the discount rate and future medical costs). Changes in underlying assumptions from year to year give rise to actuarial gains or losses (e.g., a reduction in the discount rate, and all else being equal, would result in a higher defined benefit
obligation and an actuarial loss). These actuarial gains or losses can either be (i) recognized immediately in the year incurred; or (ii) amortized above a certain threshold over the remaining working lives of
employees with the remaining balance carried on the balance sheet (the “corridor method”). The “corridor method” was chosen in FY 2000, principally to minimize the impact of changes in actuarial assumptions on income.
IAS 19 amendment
Under IFRS, the Fund is required to implement an amended IAS 19, with effect from the FY 2014 financial statements, which eliminates “the corridor method.” As a result, gains and losses arising from changes in actuarial assumptions will have to be recognized in the current year. The implementation of the amended IAS 19 requires retrospective application such that the unrealized actuarial losses would be charged against the reserves effective May 1, 2013 (start of the financial year). This one-time
adjustment would, in effect, bring the Fund’s reserves to the same level as if the Fund had never chosen
the corridor method. Going forward, the effect of actuarial gains and losses would be reflected in the annual IAS 19 adjustment, including for FY 2014, and any volatility in the actuarial assumptions will
translate immediately into volatility in the Fund’s income and reserves.
Accounting vs. funding basis
The actuarial methods under IAS 19 to measure the IAS 19 expense in the Fund’s financial statements are different from the actuarial method used to determine the Fund’s annual contribution for the
pension plans (i.e., the funding requirement). Therefore, the accounting for employee benefits differs
between the Fund’s financial statements (accrual basis) and the administrative budget (cash basis for employer’s contributions). The resulting timing differences can be substantial but should net to zero
over the life of the pension and benefit plans, as the IAS 19 adjustments must equal the employer’s
Table 1. Projected Income and Expenditures—FY 2014 (in millions of SDRs)
Source: Finance Department and Office of Budget and Planning
1/ Review of the Fund’s Income Position for FY 2013 and FY 2014 (4/30/13). The initial projections are based on the purely hypothetical scenario presented in April 2013 in which the thresholds for surcharges and commitment fees were assumed to be halved following the effectiveness of the 14th General Review of Quotas. This hypothetical scenario is broadly equivalent to a scenario as in the current projections in which there are no changes in quotas or thresholds.
2/ Interest free resources reduce the Fund’s costs and therefore provide implicit returns. Since the Fund invests its reserves in the IA to earn a higher return, the interest free resources retained in the GRA are mainly attributable to the SCA-1, unremunerated reserve tranche positions not represented by gold holdings, and GRA income for the year not transferred to the IA. These resources reduce members’ reserve tranche positions and the Fund’s remuneration expense resulting in implicit income for the Fund. 3/ IAS 19 is the accounting standard that prescribes the accounting treatment of pensions and employee benefit expenses, and involves actuarial valuations. See Box 1 for further discussion of IAS 19.
4/ Net income on the basis presented in the Fund’s IFRS annual financial statements.
5/ Precautionary balances have been revised to reflect the effects of the adoption of the revised IAS 19 in FY 2014 (see Box 1). Initial
Projections 1/
Current Projections
A. Operational income 1,046 1,046
Lending income 968 957
Margin for the rate of charge 882 854
Service charges 67 74
Commitment fees 19 29
Investment income 18 35
Reserves 18 35
Interest free resources 2/ 5 5
SCA-1 and other 5 5
Reimbursements 55 49
MDRI-I, PCDR Trusts, and SDR Department 1 1
PRG Trust 54 48
B. Expenses 713 676
Net administrative expenditures 671 633
Capital budget items expensed 9 10
Depreciation 33 33
C. Net operational income position (A-B) 333 370
Surcharges 1,468 1,402
IAS 19 timing adjustment 3/ 976
Retained gold endowment investment income 14 6
Net income position 4/ 1,815 2,754
Fund credit (average stock, SDR billions) 88.2 85.4
SDR interest rate (average, in percent) 0.1 0.1
US$/SDR exchange rate (average) 1.50 1.53
Precautionary balances (end of period, SDR billions) 5/ 13.3 12.8 Memorandum Items:
DISPOSITION DECISIONS
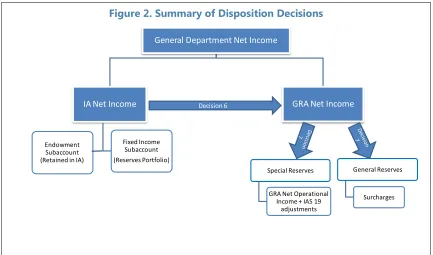
8. Projected net income includes net operational income of about SDR 370 million, surcharge income of SDR 1.4 billion, and IAS 19 timing difference of SDR 976 million (Table 1).15 As in previous years, the Executive Board needs to consider the use of IA investment income, which impacts the determination of GRA net operational income in FY 2014 and the disposition of total net income. These elements are discussed below, and presented in Figure 2, beginning with the disposition of IA investment income.
9. The use of IA income is guided by the Fund’s Articles. Under the Articles, investment income from the IA may be invested, held in the IA, or used for meeting the expenses of conducting the business of the Fund.16 Further, Article XII, Section 6(f)(ii), permits the transfer of GRA currencies to the IA when the Fund’s reserves are above the cumulative amount of previous transfers of currencies from the GRA to the IA.
10. Staff proposes that income in the subaccounts of the IA be used as follows:
Fixed-income Subaccount (reserves portfolio): Consistent with past practice, staff proposes that the estimated FY 2014 income of SDR 35 million be transferred to the GRA to be used towards meeting the expenses of the Fund (proposed Decision 6). By so doing the IA income will contribute to the GRA net operational income, which will be placed in the Fund’s reserves as indicated in Table 1.
Endowment Subaccount: Staff proposes that the projected income of SDR 6 million be retained in the IA. According to the Rules and Regulations for the Investment Account, no income from the Endowment Subaccount may be used for meeting the expenses of the Fund pending the completion of the phasing period, which has now started in March 2014.17 No Board decision is required for the reinvestment of earnings.
11. Assuming the above use of IA income, staff proposes that the FY 2014 GRA net operational income be placed in the special reserve and that the surcharge income be placed to the general reserve. The disposition of the annual income is guided by the Fund’s Articles as well as the Fund’s long standing practices (see Box 2). Consistent with these past practices, staff proposes that the FY 2014 GRA net operational income and the projected IAS 19 timing difference be placed to the special reserve for a total amount of SDR 1.3 billion.18 Staff further proposes that net income equivalent to the FY 2014 surcharges income estimated at SDR 1.4 billion be placed to
15
The IAS 19 timing difference is discussed in paragraph 5 and represents the gains anticipated in FY 2014 as a result of implementing the amended IAS 19.
16
Article XII, Section 6 (f)(iv). The Board could also, by a 70 percent majority of the total voting power, decide to reduce the principal invested in the IA (Article XII, Section 6 (f)(vi)).
17
See the Rules and Regulations for the Investment Account (12/28/12). 18
the general reserve (see proposed Decisions 7). Following the transfer of the FY 2014 net income to reserves, the total precautionary balances at the end of FY 2014 are projected at SDR 12.8 billion.19 The balances would comprise SDR 4.0 billion in the special reserve, SDR 7.6 billion in the general reserve, and the SCA-1 balance of SDR 1.2 billion.
Box 2. The Fund’s Reserves
Article XII, Section 6(a) permits the Fund’s net income to be distributed to members or placed to the general or special reserve.
Special Reserve. The special reserve was established in 1957. The Board also agreed in 1957 that any administrative losses would first be charged against the special reserve. The special reserve is therefore the first line of defense against income losses.Under the Fund’s Articles, no distributions can be made from the special reserve. Since the 1970s, the Fund’s practice has been to place GRA annual net income to the special reserve, while surcharge income in the period FY 1998‒2006 and in FY 2011–2013 was placed to the general reserve (see below).
General Reserve. The general reserve is available for absorbing capital or meeting administrative losses, as well as for making distributions. Distributions of the general reserve are to be made to all members in proportion to their quota, and require an Executive Board decision adopted by a 70 percent majority of the total voting power. Net income equivalent to surcharge income in the period FY 1998–2006 and in
FY 2011-2013 was placed to the general reserve. For the period FY 2007–2010, surcharge income was not placed to the General Reserve and instead was used towards meeting the expenses of conducting the business of the Fund.1/
_____________
1/ The practice of placing surcharges to the general reserves was resumed in FY 2011 when the Fund returned to a sufficiently positive net income position.
12. The placement of FY 2014 net income to reserves provides scope for further transfer of currencies to the Fixed-Income Subaccount. Article XII, section 6(f)(ii) provides that the transfer of currencies from the GRA to the IA shall not exceed the total amount of the general and special reserve. Following the retroactive adjustment for the amended IAS 19 of SDR 1.4 billion effective May 1, 2013 and the placement of the FY 2014 net income of SDR 2.7 billion to reserves, the projected level of the general and special reserves at the end of the financial year will be
SDR 16 billion.20 Correspondingly, the cumulative net transfer of currencies since FY 2006 (when the
19
Precautionary balances comprise of the special and general reserves, as well as SCA-1 balances, except for amounts in the special and general reserves attributed to the limited gold sales concluded in December 2010 of SDR 4.4 billion. For further discussion on the Fund’s precautionary balances see Review of the Adequacy of the Fund’s Precautionary Balances (, 01/15/14).
20
IA was established) would amount to SDR 14.7 billion.21 This would allow an additional transfer of currencies from the GRA to the IA of about SDR 1.3 billion, being the maximum transfer of currencies permitted under the Articles.
13. Staff proposes to retain the currencies available for transfer in the GRA pending the review of the investment strategy for the Fixed-Income Subaccount. The Board’s work program for FY 2015 includes a comprehensive review of the investment mandate of the Fixed-Income Subaccount (an informal session for discussion is scheduled for May 2014). In light of this pending review, staff proposes to hold the transfer of currencies from the GRA to the IA as an interim measure providing the Fund with time to review the strategic asset allocation for this subaccount. While this would be a departure from the recent past practice, the Board has in the past adopted transitional measures for the IA. For example, the gold-Endowment Subaccount holds gold profits in short-term deposits pending their investment according to the strategic asset allocation of that portfolio. The option to retain the currencies in the GRA does not require a Board decision.
FY 2015
–
2016 INCOME OUTLOOK
14. The income outlook for FY 2015‒2016 is positive reflecting the high credit environment. Projected income for FY 2015 and FY 2016 is estimated at SDR 2.4 billion and SDR 2.1 billion, respectively. The income projections remain sensitive to a number of factors including: the level of global interest rates; the timing of purchases and repurchases under existing arrangements; possible new arrangements; the U.S. dollar/SDR exchange rate and the annual pension expense as determined under the amended IAS 19.22 The projections are also sensitive to future Board discussions on the level and structure of surcharges, including consideration of whether and how the thresholds should be adjusted following the implementation of the
14th General Review of Quotas, and on the investment strategy for the Fixed-Income Subaccount scheduled in FY 2015.
21
Currencies relating to the reduction in investments and transferred back to the GRA for purposes of the partial distribution of the general reserve for the benefit of the PRG Trust in the amount of SDR 2.45 billion have been excluded.
22
Fixed Income Subaccount
(Reserves Portfolio)
General Department Net Income
IA Net Income Decision 6 GRA Net Income
General Reserves
Surcharges Special Reserves
GRA Net Operational Income + IAS 19
adjustments Endowment
[image:15.612.90.523.70.325.2]Subaccount (Retained in IA)
Figure 2. Summary of Disposition Decisions
15. The Board needs to set the margin for the rate of charge. Based on the amended Rule I-6(4), which came into effect on May 1, 2012, the Executive Board needs to set the margin for the next two financial years FY 2015–2016. Under the rule, the margin should be set to cover the Fund’s intermediation costs and help build up reserves. The rule also provides for a cross-check of the alignment of the margin to long-term credit market conditions (see Box 3). The rule also permits that notwithstanding the above, in exceptional circumstances, the margin may be set at a level other than that which is adequate to cover estimated intermediation expenses of the Fund and to
generate an amount of net income for placement to reserves (“exceptional circumstances clause“).
16. At the time of the first implementation of the amended Rule I-6(4), the Executive Board set the margin under the exceptional circumstances clause. The amended Rule I-6(4) was designed to move away from the reliance on lending income for the financing of the Fund’s
non-lending activities i.e., non-lending income was expected to cover non-lending activities of the Fund while lending income should only cover intermediation costs and contribute to a build-up of reserves. However, investment income, the main source of the Fund’s non-lending income, is
expected to continue to be constrained by the historically low global interest rates, which determine the returns from the Fixed-Income Subaccount. While over the longer term the gold-funded
endowment is expected to make a significant contribution to Fund income, in line with the three-year funding plan endorsed by the Executive Board, payouts from the endowment will not start until FY 2018. As a result in the near to medium term, lending income will continue to cover a significant portion of the Fund’s non-lending operating costs hence the need to apply the
17. As the factors justifying the use of the exceptional circumstances clause have not changed appreciably, the margin for FY 2015–2016 will continue to be set under the
exceptional circumstances clause. 23 Although non-lending income is projected to rise moderately, during the next two years, it will, as in the last two years, only cover about one-tenth of the Fund’s non-lending activities. As such, the important implication of the use of the exceptional
circumstances clause is that the contribution of the margin to reserve accumulation is significantly less than it would be if non-lending activities were covered by non-lending income.
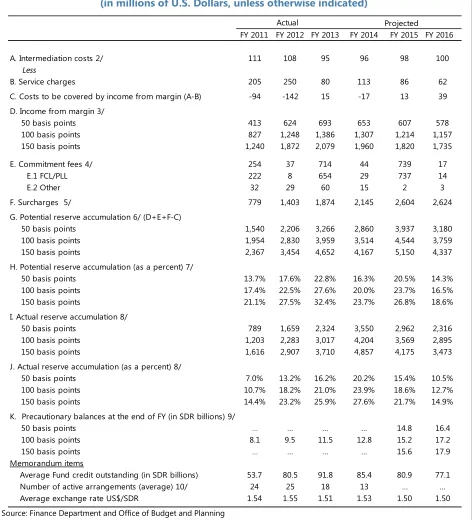
18. Application of the rule to set the margin for FY 2015–2016 is discussed below and summarized in Table 2. The coverage of intermediation costs by margin income is considered first, before assessing the contribution of margin income to reserve accumulation. The discussion
concludes with a cross-check to ensure that the margin on the rate of charge is not too high or too low in relation to long-term market conditions.
Coverage of intermediation costs
19. Intermediation costs are estimated at US$98 million and US$100 million in FY 2015 and FY 2016 respectively (Table 2). Fund-wide intermediation costs related to generally available facilities (GAF) are derived in consultation with departments using the Fund’s Analytic Costing and Estimation System (ACES). They cover direct personnel, travel and other administrative expenses, as well as indirect support and governance costs. In addition, capital and depreciation expenses (which are not part of the ACES methodology) are allocated separately to derive total intermediation costs. 20. Income associated with the current high lending levels is expected to remain well in excess of intermediation costs in FY 2015–2016.24 The income from service charges at
US$86 million and US$62 million (Table 2, row B) is projected to cover about 90 percent and 60 percent of the intermediation costs in FY 2015 and FY 2016, respectively. An unchanged margin of 100 basis points would provide further income of about US$1.2 billion (SDR 800 million) in each of the next two financial years.
Reserve accumulation
21. The pace of reserve accumulation is projected to be strong in FY 2015 and FY 2016. The high level of Fund credit is contributing to the accumulation of reserves and net income is projected to be SDR 2.4 billion and SDR 2.1 billion in FY 2015 and FY 2016, respectively. This level of reserve accumulation provides significant contributions toward the indicative medium-term target of SDR 20 billion reaffirmed at the recent review of the adequacy of precautionary balances.25
23
The margin for the basic rate of charge for the period FY 2013 and FY 2014 was adopted under the exceptional circumstances clause(see Review of the Fund’s Income Position for FY 2012 and FY 2013–2014(04/12/12). 24
Box 3. The Rule for Setting the Margin for the Basic Rate of Charge
Effective May 1, 2012, Rule I-6(4) reads as follows:
"(4) The rate of charge on holdings (i) acquired as a result of a purchase under a policy that has been the subject of an exclusion under Article XXX(c), or (ii) that exceed the amount of the member's quota after excluding any balances referred to in (i), shall be determined in accordance with (a) and (b) below.
(a) The rate of charge shall be determined as the SDR interest rate under Rule T-1 plus a margin expressed in basis points. The margin shall be set at a level that is adequate (i) to cover the estimated intermediation expense of the Fund for the period under; (b) below, taking into account income from service charges; and (ii) to generate an amount of net income for placement to reserves. The appropriate amount for reserve contribution shall be assessed taking into account, in particular, the current level of precautionary balances, any floor or target for precautionary balances, and the expected contribution from surcharges and commitment fees to precautionary balances; provided, however, that the margin shall not be set at a level at which the basic rate of charge would result in the cost of Fund credit becoming too high or too low in relation to long-term credit market conditions as measured by appropriate benchmarks. Notwithstanding the above, in exceptional circumstances, the margin may be set at a level other than that which is adequate to cover estimated intermediation expenses of the Fund and to generate an amount of net income for placement to reserves.
(b) The margin shall be set for a period of two financial years. A comprehensive review of the Fund's income position shall be held before the end of the first year of each such two-year period and the margin may be adjusted in the context of such a review, but only if this is warranted in view of
fundamental changes in the underlying factors relevant for the establishment of the margin at the start of the two-year period."
___________________________
22. In addition to the margin and service charges on disbursements, commitment fees for non-drawing arrangements and surcharges contribute to the Fund’s income.
The expected commitment fees are about US$739 million (SDR 492 million) in FY 2015 and US$17 million (SDR 12 million) in FY 2016. Commitment fee income is only recognized at the expiration or cancellation of arrangements and is therefore volatile. The projected commitment fee income for FY 2015 includes the two-year commitment fees earned on two FCL arrangements, which are scheduled to expire in that year. These fees are projected on the basis of current quotas and commitment fee thresholds. The impact on projected commitment fee income from the ongoing Board review of commitment fee thresholds following the effectiveness of the 14th General Review of Quotas is expected to be marginal.
8 10 12 14 16 18 20 22 24 26 28 30 8 10 12 14 16 18 20 22 24 26 28 30
FY14 FY15 FY16 FY17 FY18 FY19 FY20
SDR 20 billion indicative target
Lower margin scenario
SDR 10 billion floor April 2014 projections (Projected
on the basis of current quotas and thresholds for surcharges)
Higher margin scenario
23. Table 2 simulates reserve accumulation at three different levels of the margin (50, 100, and 150 basis points) based on current surcharge policy and existing quotas. Lending income associated with a 100 basis points margin for the basic rate of charge, service charges, commitment fees and surcharges yields potential reserve accumulation of US$4.5 billion and US$3.8 billion in FY 2015 and FY 2016, respectively (Table 2, row G). However, because lending income continues to cover a proportion of non-lending costs, actual reserve accumulation is lower by about
US$1.8 billion over this two year period with projected net income of US$3.6 billion (SDR 2.4 billion) and US$2.9 billion (SDR 1.9 billion) in FY 2015 and FY 2016, respectively (Table 2, row I and Table 4). With an unchanged margin, the indicative medium-term precautionary balances target of
[image:18.612.68.547.293.575.2]SDR 20 billion would be reached in FY 2018. Lowering or increasing the margin to 50 or 150 basis points would yield about SDR 0.8 billion less or more income in both FY 2015 and FY 2016. Figure 3 illustrates the impact on reserve accumulation and suggests that lowering or increasing the margin by 50 basis points would delay by nine months or advance by six months the time needed to reach the indicative target for precautionary balances of SDR 20 billion.
Figure 3. Projected Reserve Accumulation (in billions of SDRs)
Alignment of fund borrowing costs with market conditions
market borrowing rates (see Annex II).26 The market cross check provides a useful guide but is not mechanistic, requiring judgment, particularly on the global financial context and future
developments. As in the past, two adjustments are made to the metric measuring long-term market conditions:
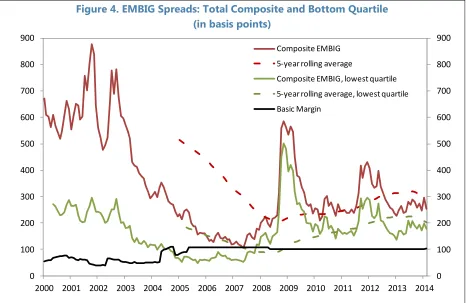
Risk premium adjustment—an adjustment to take account of the lower credit risks the Fund faces as a cooperative public policy institution. The Fund’s preferred creditor status and its lending policies are key factors in reducing these risks. To reflect this, the measure compares the margin to market borrowing spreads applying for the more creditworthy emerging markets, approximated by the lowest quartile of EMBI spreads; and
Term premium adjustment—an adjustment is made to account for the difference between the SDR interest rate (based on a floating rate composed of three-month instruments) and the comparator EMBI measure (based on five-year fixed-rate instruments).
Table 2. Income from the Margin and Reserve Accumulation1 (in millions of U.S. Dollars, unless otherwise indicated)
Source: Finance Department and Office of Budget and Planning
1/ For analytical purposes, surcharges and commitments fees are considered for reserve accumulation only. 2/ Costs related to the Fund’s “generally available facilities.”
3/ Derived by applying the margin against average Fund credit outstanding at the average US$/SDR rate. 4/ Includes commitment fees for expired or cancelled arrangements in FY 2011–2013.
5/ Surcharges are projected on the basis of current quotas and surcharge thresholds.
6/ Potential reserve accumulation assumes other sources of income sufficient to cover non-intermediation costs. 7/ Potential reserve accumulation as a percent of precautionary balances at the beginning of the financial year.
8/ Additions to reserves based on net income for the year (excluding gold profits and the retained gold endowment investment income). See Table 4 for FY 2014–2016 estimates.
9/ Precautionary balances include the Fund’s reserves and SCA-1 balance less gold sale profits in FY 2010–2011.
FY 2011 FY 2012 FY 2013 FY 2014 FY 2016
A. Intermediation costs 2/ 111 108 95 96 98 100
Less
B. Service charges 205 250 80 113 86 62
C. Costs to be covered by income from margin (A-B) -94 -142 15 -17 13 39
D. Income from margin 3/
50 basis points 413 624 693 653 607 578
100 basis points 827 1,248 1,386 1,307 1,214 1,157
150 basis points 1,240 1,872 2,079 1,960 1,820 1,735
E. Commitment fees 4/ 254 37 714 44 739 17
E.1 FCL/PLL 222 8 654 29 737 14
E.2 Other 32 29 60 15 2 3
F. Surcharges 5/ 779 1,403 1,874 2,145 2,604 2,624
G. Potential reserve accumulation 6/ (D+E+F-C)
50 basis points 1,540 2,206 3,266 2,860 3,937 3,180
100 basis points 1,954 2,830 3,959 3,514 4,544 3,759
150 basis points 2,367 3,454 4,652 4,167 5,150 4,337
H. Potential reserve accumulation (as a percent) 7/
50 basis points 13.7% 17.6% 22.8% 16.3% 20.5% 14.3%
100 basis points 17.4% 22.5% 27.6% 20.0% 23.7% 16.5%
150 basis points 21.1% 27.5% 32.4% 23.7% 26.8% 18.6%
I. Actual reserve accumulation 8/
50 basis points 789 1,659 2,324 3,550 2,962 2,316
100 basis points 1,203 2,283 3,017 4,204 3,569 2,895
150 basis points 1,616 2,907 3,710 4,857 4,175 3,473
J. Actual reserve accumulation (as a percent) 8/
50 basis points 7.0% 13.2% 16.2% 20.2% 15.4% 10.5%
100 basis points 10.7% 18.2% 21.0% 23.9% 18.6% 12.7%
150 basis points 14.4% 23.2% 25.9% 27.6% 21.7% 14.9%
K. Precautionary balances at the end of FY (in SDR billions) 9/
50 basis points … … … … 14.8 16.4
100 basis points 8.1 9.5 11.5 12.8 15.2 17.2
150 basis points … … … … 15.6 17.9
Memorandum items
Average Fund credit outstanding (in SDR billions) 53.7 80.5 91.8 85.4 80.9 77.1
Number of active arrangements (average) 10/ 24 25 18 13 … …
Average exchange rate US$/SDR 1.54 1.55 1.51 1.53 1.50 1.50
Actual Projected
25. The adjusted market comparator suggests that the cost of Fund credit at the current margin of 100 basis points is somewhat below long-term credit market costs (Table 3).
[image:21.612.74.540.264.567.2]Emerging market spreads eased somewhat from their most recent peaks in 2012, but are on a slight upward trend (see Figure 4). In the most recent five-year period ending in February 2014, the lowest quartile of the EMBI adjusted for the term premium was about 68 basis points higher than the current margin. This differential is only modestly wider than the spread of about 50 basis points seen over the previous decade and thus does not suggest that the cost of Fund credit is too low relative to long-term market conditions. Two other factors also support this conclusion. Most Fund borrowers are supported by high access programs, which are subject to surcharges that raise the overall cost of their borrowing from the Fund.27 In addition it should be noted that the basic rate of charge is also unusually low at present given the historically low SDR rate, and some reversal of this cyclical development is to be expected.
Figure 4. EMBIG Spreads: Total Composite and Bottom Quartile (in basis points)
27
For example, based on projected income from surcharges and projected credit outstanding, average surcharge rates are estimated to add about 200 basis points to the cost of Fund credit in FY 2015 and FY 2016, respectively. At end-March 2014, about 90 percent of total credit outstanding was subject to surcharges. In addition, service charges are levied at 50 basis points on each disbursement.
0 100 200 300 400 500 600 700 800 900
0 100 200 300 400 500 600 700 800 900
2000 2001 2002 2003 2004 2005 2006 2007 2008 2009 2010 2011 2012 2013 2014 Composite EMBIG
5-year rolling average
Composite EMBIG, lowest quartile
5-year rolling average, lowest quartile
26. Based on the foregoing analysis, including the cross-check on alignment with
long-term market conditions, staff proposes that the margin for the rate of charge be set at 100 basis points for FY 2015‒2016 (proposed Decision No. 8). At this level, the margin will cover intermediation costs, generate a substantial contribution to reserves, and is not significantly out of line with long-term market conditions. As mentioned earlier, since the margin is also expected to cover part of the Fund’s non-intermediation costs in the next two financial years, the proposed decision is based on the exceptional circumstances clause of the Rule I-6(4).
[image:22.612.70.524.107.367.2]27. Key factors that affect the FY 2015‒2016 income outlook are discussed below and presented in Table 4. A sensitivity analysis on the income effects of changes in some of the assumptions is also presented in Table 5.
Table 3. Long-Term Credit Market and Comparator Spreads (in basis points)
2001 - 2005 2006 - 2010 Mar 2009 - Feb 2014
Composite EMBI 401 219 271
Countries in the lowest quartile 130 155 189
1.8 13 21
Composite EMBI 399 206 250
Countries in the lowest quartile 128 142 168
Memorandum item
Past users of Fund resources 4/ 283 225 283
Margin on the basic rate of charge 5/ 69 104 100
Source: Bloomberg, JP Morgan and Fund staff calculations.
1/ SDR-equivalent rates are calculated using the currency weights in the SDR basket.
5/ Margin reduced to 100 bps from 108 bps in May 2008. Between 1989 and 2005, the rate of charge was determined by a coefficient to the SDR interest rate that was adjusted with the Fund's total administrative expenses and the volume of Fund credit outstanding. Since May 2005, the margin has been defined in absolute basis points over the SDR interest rate.
(Median spread, in SDR-equivalent basis points) 1/
2/ Table reports linear combination of spreads in EMBIG-U.S. dollar and EMBIG-Euro composites. Series were combined using the weights of the U.S. dollar and Euro in the SDR basket (normalized to 100). During the sample period, the combined EMBIG indices contained spreads for a total of 40 countries.
3/ Difference in yields between a five-year fixed-rate SDR bond and the five-year average 3-month SDR interest rate as implied in futures market contracts, adjusted for the higher risk premium of instruments in future markets.
4/ Median level of the SDR weighted U.S. dollar and euro EMBIG spreads for the members with Fund arrangements between 1996 and 2011, excluding advanced countries.
Country risk--EMBI-based measures 2/
Term premium 3/
Lending income. The projected increase in operational lending income of about 40 percent in FY 2015 reflects commitment fee income at the expiration of two large FCL arrangements. Lending income also continues to reflect the elevated levels of Fund credit projected at about SDR 80 billion in each of the two years.
IA investment income
Fixed-Income Subaccount: Projected earnings from the Fixed-Income Subaccount continue to reflect low global interest rates and the expectation that yields in global fixed-income markets are on an upward trend from their historically low levels.The Fixed-Income Subaccount is projected to make a modest loss of SDR 41 million in FY 2015 and a slight gain of SDR 30 million in FY 2016. Pending the upcoming Board review of this subaccount, the projection is based on the forward SDR interest rate and the current approved
investment strategy.28 Given the projected rise in the global interest rates, as implied by forward markets, and the current investment mandate, in FY 2015 the subaccount is
projected to lose about 40 basis points, underperforming the SDR interest rate by about 60 basis points. This outcome reflects the current low yield environment with coupon income providing little cushion to possible capital losses from yield increases. Income projections over the medium term are also conservative. The revised medium-term projections assume a broadening of the investment mandate starting in FY 2016 translating into a gradual rise in returns from this subaccount. The broadening of the investment mandate is assumed to result in a premium of 100 basis points over the SDR interest rate by FY 2019. The realism of these projections will need to be revisited in light of future Board discussions on the
investment strategy for this portfolio, which is included in the FY 2015 work program. Annex III, provides further discussion on the sensitivity of the returns in this portfolio to changes in global interest rates.
Endowment Subaccount: The projected income for the gold endowment is expected to be about SDR 44 million and SDR 125 million for FY 2015 and FY 2016, respectively reflecting the three-year funding approach for the endowment. This income is assumed to be retained in the endowment in accordance with the Rules and Regulations of the IA and is therefore
28
not included as part of the Fund’s operating income. Transfers to the Endowment Subaccount are expected to be spread evenly over three years and the first payout is expected in FY 2018.
Interest-free resources and reimbursements. Income from interest-free resources is expected to remain subdued owing to the low interest rate environment which is expected to prevail in coming years. Projected reimbursements are based on the FY 2014 estimates.
Expenditures. Net administrative and capital expenditures are consistent with those set in the medium-term budget paper.29
Surcharges. Surcharges are projected to remain high at about SDR 1.7 billion annually, as a result of the high credit lending environment. As of end-March about 90 percent of the Fund’s credit outstanding is subject to surcharges. These surcharges are projected on the basis of current quotas and current thresholds.
FY2014 FY2016
A. Operational income 1/ 1,046 1,382 940
Lending income 957 1,358 824
Margin for the rate of charge 854 809 771
Service charges 74 57 41
Commitment fees 29 492 12
Investment income 35 -41 30
Reserves 35 -41 30
Interest free resources 2/ 5 14 34
SCA-1 and other 5 14 34
Reimbursements 49 51 52
MDRI-I, PCDR Trusts, and SDR Department 1 1 1
PRG Trust 48 50 51
B. Expenses 676 739 759
Net administrative expenditures 633 685 703
Capital budget items expensed 10 16 15
Depreciation 33 38 41
C. Net operational income position (A-B) 370 643 181
Surcharges 3/ 1,402 1,736 1,749
IAS 19 timing adjustment 4/ 976
Retained gold endowment investment income 5/ 6 44 125
Net income position 6/ 2,754 2,423 2,055
Fund credit (average stock, SDR billions) 85.4 80.9 77.1
SDR interest rate (average, in percent) 0.1 0.2 0.6
US$/SDR exchange rate (average) 1.53 1.50 1.50
Precautionary balances (end of period, SDR billions) 12.8 15.2 17.2 FY2015
[image:25.612.79.535.92.566.2]Memorandum Items:
Table 4. Projected Income Sources and Uses—FY 2014–2016 (in millions of SDRs)
Source: Finance Department and Office of Budget and Planning 1/ Surcharges are excluded from operational income.
2/ Interest free resources reduce the Fund’s costs and therefore provide implicit returns. Since the Fund invests its reserves in the IA to earn a higher return, the interest free resources retained in the GRA are mainly attributable to the SCA-1, unremunerated reserve tranche positions not represented by gold holdings, and GRA income for the year not transferred to the IA. These resources reduce members’ reserve tranche positions and the Fund’s remuneration expense resulting in implicit income for the Fund. 3/ Surcharges are projected on the basis of current quotas and surcharge thresholds. .
4/ The IAS 19 timing adjustment is actuarially determined and is finalized shortly after the end of the financial year. 5/ The projections reflect the phase in of investments to the endowment with the gold profits being invested in short-term deposits during the interim period.
Table 5. Sensitivity Analysis-Effect of Changes in Selected Assumptions in FY 2015–2016 (in millions of SDRs)
1/ Implicit returns on GRA interest-free resources.
2/ Assumes May 1 transaction with full drawing of SDR 10 billion, access of 1,000 percent of quota and no change in current quotas. Includes service charges, margin on the basic rate of charge and level based surcharges (commitment fees are excluded).
28. Burden sharing adjustments are expected to remain low in FY 2015 (see Table 6 below). Given current levels of overdue obligations, sharply higher lending and the prevailing low interest rate environment, burden sharing adjustments remain at very low levels. The Board amended the decision on burden sharing in FY 2010 to take account of the low burden sharing adjustments and allow for a “carry-forward” of excess amounts generated from a minimum adjustment of one basis point to the rate of charge and the rate of remuneration.30 If the amounts brought forward are sufficient to offset deferred charges in subsequent quarter(s), no adjustments are necessary for such quarters. This was the case for the third quarter of FY 2014. Going forward, burden sharing adjustments are expected to remain low, with adjustments projected for the second and fourth quarter of FY 2015.
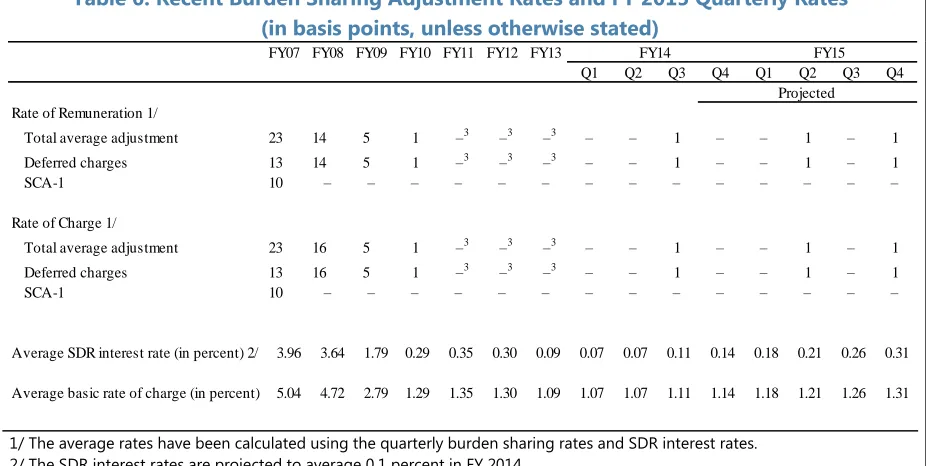
Table 6. Recent Burden Sharing Adjustment Rates and FY 2015 Quarterly Rates (in basis points, unless otherwise stated)
1/ The average rates have been calculated using the quarterly burden sharing rates and SDR interest rates. 2/ The SDR interest rates are projected to average 0.1 percent in FY 2014.
3/ Less than 0.5 basis points.
30 See The Fund’s Income Position for FY 2010—Midyear Review (12/8/2009), paragraphs 8–10.
SDR interest rate by 50 basis points
Implicit returns 1/ 32
Credit tranche purchases (non-FCL) by SDR 10 billion 2/ 290
U.S. dollar exchange vis-à-vis SDR by five percent 33
Investment income margin by 50 basis points 74 Change in:
FY07 FY08 FY09 FY10 FY11 FY12 FY13
Q1 Q2 Q3 Q4 Q1 Q2 Q3 Q4
Rate of Remuneration 1/
Total average adjustment 23 14 5 1 –3 –3 –3 – – 1 – – 1 – 1 Deferred charges 13 14 5 1 –3 –3 –3 – – 1 – – 1 – 1 SCA-1 10 – – – – – – – – – – – – – –
Rate of Charge 1/
Total average adjustment 23 16 5 1 –3 –3 –3 – – 1 – – 1 – 1 Deferred charges 13 16 5 1 –3 –3 –3 – – 1 – – 1 – 1 SCA-1 10 – – – – – – – – – – – – – –
Average SDR interest rate (in percent) 2/ 3.96 3.64 1.79 0.29 0.35 0.30 0.09 0.07 0.07 0.11 0.14 0.18 0.21 0.26 0.31
Average basic rate of charge (in percent) 5.04 4.72 2.79 1.29 1.35 1.30 1.09 1.07 1.07 1.11 1.14 1.18 1.21 1.26 1.31 FY15
[image:26.612.76.539.437.670.2]REVIEW OF SPECIAL CHARGES
29. The decision on special charges on overdue financial obligations in the GRA and the Trust Fund calls for an annual review. Under the current system, special charges are to be levied on repurchases and charges that are in arrears for more than 10 days. However, special charges on GRA obligations that are overdue for six months or more were eliminated effective May 1, 1992.31 No special charges have arisen during FY 2014 and no new considerations have arisen during the financial year. No changes are proposed to the current system (proposed Decision 9).
31
Special charges were established to provide members with an incentive to settle their financial obligations to the Fund in a timely manner. It was also recognized that these charges may complicate the efforts of a member in
PROPOSED DECISIONS
Decisions Pertaining to FY 2014
Decision 1 provides for the assessment on SDR Department participants for the reimbursement of the General Department for the expenses of conducting the business of the SDR Department in FY 2014.
Decision 2 provides for the reimbursement to the General Resources Account for the cost of administering SDA resources in the MDRI-I Trust in FY 2014.
Decision 3 provides for the reimbursement to the General Resources Account for the cost of administering SDA resources in the PCDR Trust in FY 2014.
Decision 4 provides for the reimbursement to the General Resources Account for the cost of administering the PRGT in FY 2014.
Decision 5 charges the unrecognized net losses through April 30, 2013 from the implementation of the amended International Accounting Standard 19-Employee Benefits, retroactively against the Fund’s Special Reserve effective May 1, 2013.
Decision 6 provides for the transfer of income from the Fixed-Income Subaccount of the
Investment Account to the General Resources Account for use in meeting FY 2014 administrative expenses.
Decision 7 provides for the placement of FY 2014 net income to the Fund’s Special Reserve and General Reserve.
Decision Pertaining to FY 2015–2016
Decision 8 sets the rate of charge on the use of Fund resources for FY 2015–2016 at 100 basis points over the SDR interest rate.
Decision 9 reviews the system of special charges.
1.
Assessment under Article XX, Section 4 for FY 2014
Pursuant to Article XVI, Section 2 and Article XX, Section 4 of the Articles of Agreement and Rule T-2 of the Fund's Rules and Regulations, it is decided that:
(i) The General Department shall be reimbursed for the expenses of conducting the business
of the SDR Department for the period of May 1, 2013 through April 30, 2014; and
(ii) An assessment shall be levied on all participants in the SDR Department. The special
drawing right holdings accounts of participants shall be debited on April 30, 2014 with an
amount equal to 0.000672840 percent of their net cumulative allocations of special drawing
rights. The total assessment shall be paid into the General Department.
2.
MDRI-I Trust Reimbursement for FY 2014
In accordance with paragraph 6 of Decision No. 13588-(05/99) MDRI, adopted November 23,
2005, effective January 5, 2006, the General Resources Account shall be reimbursed the
equivalent of SDR 0.01 million by the MDRI-I Trust in respect of the expenses of administering
SDA resources in the MDRI-I Trust during FY 2014.
3.
PCDR Trust Reimbursement for FY 2014
In accordance with paragraph 3 of Decision No. 14649-(10/64) PCDR, adopted June 25, 2010, the
General Resources Account shall be reimbursed the equivalent of SDR 0.012 million by the PCDR
REVIEW OF THE FUND’S INCOME POSITION FOR FY 2014 AND FY 2015–2016
4.
PRG Trust Reimbursement for FY 2014
In accordance with paragraph 3 of Decision No. 8760-(87/176), adopted on December 18, 1987,
an amount equivalent to SDR 48.14 million, representing the cost of administering the Poverty
Reduction and Growth Trust (PRGT) for FY 2014, shall be transferred from the Reserve Account
of the PRGT (through the Special Disbursement Account) to the General Resources Account.
5.
Implementation of the amended IAS 19
The unrecognized loss of SDR 1.4 billion through April 30, 2013, resulting from the change in
accounting for employee benefits under International Accounting Standard 19 shall be charged
against the Fund’s Special Reserve effective May 1, 2013.
6.
Transfer of Investment Income for FY 2014 to General Resources Account
The income of the Fixed Income Subaccount of the Investment Account for FY 2014 shall be
transferred to the General Resources Account for use in meeting the expenses of conducting
the business of the Fund during FY 2014.
7.
Placement of FY 2014 net income of the General Resources Account to
the Special Reserve and the General Reserve
The net income of the General Resources Account for FY 2014 shall be placed to the Fund’s
Special Reserve and General Reserve as follows: Net income not attributable to surcharge
income shall be placed to the Fund’s Special Reserve, and net income attributable to surcharge
8.
The Rate of Charge on the Use of Fund Resources for FY 2015 and FY
2016
Pursuant to Rule I-6(4)(a), last sentence of the Fund’s Rules and regulations, the rate of charge
for FY 2015 and FY 2016 shall be 100 basis points over the SDR interest rate under Rule T-1 of
the Fund’s Rules and Regulations.
9.
Review of the System of Special Charges
The Fund has reviewed Decision No. 8165-(85/189) G/TR, adopted December 30, 1985, effective
REVIEW OF THE FUND’S INCOME POSITION FOR FY 2014 AND FY 2015–2016
Annex I. Decisions in Effect Related to the
FY 2014 Income Position
1Decisions in Effect
The Executive Board has taken the following decisions affecting the Fund’s income position for FY 2014:
Rate of Charge
The margin for calculating the basic rate of charge in FY 2013 was set at 100 basis points for a period of two years (FY 2013-14). This decision was adopted under the exceptional circumstances clause of Rule I-6(4), which, in exceptional circumstances, allows the margin for calculating the basic rate of charge to be set at a level other than that which is adequate to cover the estimated intermediation expenses of the Fund and to generate an amount of net income for placement to reserves.
Burden Sharing for Deferred Charges
Income losses resulting from unpaid charges are shared equally between debtor and creditor members under the burden sharing mechanism largely pursuant to a decision taken in 2000. Unless amended by the Board, this mechanism will continue for as long as overdue obligations to the Fund persist.
___________________________
Annex II. Comparator Measure for Market Cross-Check
In the 2011 discussion on A New Rule for Setting the Margin, the Board requested that staff keep the comparator measure under review. Staff’s recommendation on the measure to use to align the margin with long-term credit market conditions is based on:
Ready availability of regular market quotes;
Isolation of the risk component of the interest differentials (i.e., excluding exchange rate differences and liquidity constraints); and
Market costs faced by members that are currently or likely to borrow from the Fund.
In view of the cooperative and public good nature of the Fund, and its mandate of assisting its members and safeguarding financing stability, the Fund provides members with funds at costs below market costs for those generally applying to borrowing members. In its assessments, staff has employed an EMBIG-based measure, adjusted to reflect the cooperative nature and risk characteristics of the Fund (25th percentile), as the comparator for the costs of member borrowing.32 As of March 2014, advanced countries comprised about 79 percent of IMF credit outstanding, which is set to increase further based on current disbursing arrangements. In light of this, staff has further investigated whether there is a suitable comparator, which captures advanced countries and which could improve on the EMBIG-based comparator.One possible candidate that staff explored is Citibank’s Emerging Markets U.S. dollar Government Bond Index (EMUSDGBI). Like the EMBIG, it satisfies the three criteria above, but also includes some advanced countries (such as Iceland, Italy and Spain). However, the weight for advanced countries’ bonds is very small, a critical drawback for cross check purposes in terms of adding value to the current EMBIG approach. In addition, the index has recently been restructured and advanced country bonds are no longer included. Hence the EMUSDGBI is not seen as a better alternative cross check measure to the benchmark EMBIG.
Staff also explored the possibility of directly measuring spreads of U.S. dollar-based
sovereign bonds issued by advanced countries, which could be used to compare with the
EMBIG. There is, however, very limited issuance of U.S. dollar-denominated bonds by advanced
market countries outside of the United States. Countries, which have issued U.S. dollar-denominated sovereign bonds and are not included in the Emerging Market Bond Index Global (EMBIG)include Australia, Canada, Iceland, Israel, Italy, Korea, New Zealand, and Spain. Of these, however, five-year yields could be estimated only for countries that had two different outstanding bonds with
reasonably distant residual maturities—only Canada, Iceland, Italy, and Korea. Furthermore, Icelandic
32
REVIEW OF THE FUND’S INCOME POSITION FOR FY 2014 AND FY 2015–2016
bonds have had very limited secondary market trading volume recently, and hence pricing is questionable. This option will continue to be monitored but results are not presented as they are not representative of the Fund membership nor traditional borrowers, and the spreads are estimated for five years based on two or more residual maturity data points.
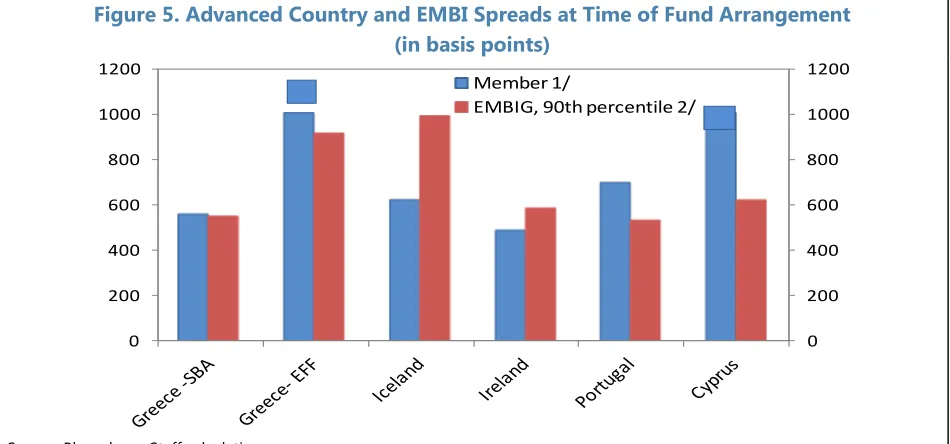
[image:34.612.70.545.332.554.2]In the absence of an alternative measure, staff continues to view the EMBIG-based measure as the most appropriate metric of long-term market conditions. While it does not include a direct measure of market conditions for borrowing advanced countries, it continues to provide a reasonable proxy. To illustrate this, staff updated the euro-denominated figures showing advanced country spreads that were included in the 2012 paper. Figure 5 demonstrates that advanced borrowing countries’ euro-denominated spreads preceding a Fund arrangement were generally consistent with or exceeded even the 90th percentile (highest credit spreads) of the EMBIG during the same period.33 Further, focusing on spreads of euro area members at the 75th percentile, given the current weight of euro area borrowers in the Fund’s credit, these have fallen sharply recently, but this measure of long-run market conditions remains above the long-run EMBIG-based metric used to calibrate the margin (Figure 6).34
Figure 5. Advanced Country and EMBI Spreads at Time of Fund Arrangement (in basis points)
Source: Bloomberg, Staff calculations.
1/ Five year government bonds versus euro area 5 year benchmark; three-month average preceding program.
2/ Three-month average spread preceding program adoption; rebased for SDR euro and US dollar weights. Average is calculated over the spreads that correspond to the 90th percentile of the sample.
33
These measures compared the most risky average emerging market and euro spreads. The latter attempts to proxy for credit risks in euro-denominated space.
34
The 75th percentile of euro spreads is employed for now to reflect the more risky euro area members. This is currently consistent with the concept of using a metric that reflects potential Fund borrowers, a primary consideration when adopting the EMBI measure originally.
0 200 400 600 800 1000 1200
0 200 400 600 800 1000 1200
Member 1/
Figure 6. Euro Area & EMBI Spreads (in basis points, 3-year centered moving average)
Source: Bloomberg, Staff calculations.
1/ Five year government bonds versus euro area five year benchmark. Excludes Cyprus, Estonia, Luxembourg, Malta Slovakia, and Slovenia due to lack of consistent five-year bond data.
2/ SDR-equivalent rates are calculated using the currency weights in the SDR basket.
0 100 200 300 400 500
0 100 200 300 400 500
Euro Area Spreads - 75th Percentile 1/
Annex III. Investment Account (IA) Performance Scenarios
35,36Fixed-income subaccount (FI)
Government bond yields in the markets of the SDR basket rose in FY 2014 from their historically lowest yield levels but remain exceptionally low, particularly within the 1–3 year index range. With the start of the tapering of quantitative easing measures by the Federal Reserve Board in December 2013, and improving growth expectations in the U.S. and the U.K., and SDR rates are expected to rise gradually over the coming years. The less buoyant environment in the euro-area and in Japan is limiting these expectations in SDR terms, however.
As of mid-March 2014, investors anticipate a gradual increase in bond yields: one-year forward yields for SDR-weighted 1–3 year bonds are about 47 basis points higher than current levels (Figure 7). This magnitude of rate increase is higher than what was expected a year ago (increase of 19 bps).37
As noted in the past, with yields still close to zero, and offering limited