www.elsevier.com / locate / livprodsci
Fat deposition and distribution measured by computer
tomography in three genetic groups of pigs
*
K. Kolstad
˚
Department of Animal Science, Agricultural University of Norway, P.O. Box 5025, N-1432 As, Norway Received 1 October 1999; received in revised form 23 February 2000; accepted 14 March 2000
Abstract
Amounts and proportions of subcutaneous, inter / intra muscular and internal fat depots were quantified by computer tomography (CT) at 10, 25, 50, 85 and 105 kg live weight in each of 141 animals of the three genetic groups: Norwegian Landrace, Duroc and a crossbreed between Norwegian Landrace and a line selected for high backfat and slow growth (LLP). Selection for reduced fat content at slaughter has resulted in earlier maturation of the fat depots (P,0.05). Differences were found between genotypes in fat amounts and distribution from 10 to 105 kg live weight. At weaning, piglets of modern breeds do not differ in total fat amounts from ‘old’ type. Subcutaneous fat depot is the largest one, and is relatively largest at weaning in all three genetic groups. This fat depot is absolutely and relatively largest in LLP (P,0.05). LLP has highest amounts of fat from 50 kg live weight (P,0.01). The efficient, fast growing Landrace breed has relatively high amounts and proportions of internal fat during the whole growth period. Amounts and proportion of inter / intramuscular fat depot appears to be high in the Duroc breed at 85 kg but not earlier. 2001 Elsevier Science B.V. All rights reserved.
Keywords: Pig; Fat amounts; Fat distribution; Breed differences; Computer tomography
1. Introduction pigs differ with respect to fat amounts and fat distribution (Wood and Cameron, 1994; Kolstad et Efficient pig meat production is best obtained with al., 1996; Schinckel et al., 1996). There is also a combination of fast lean growth and low fat genetic variation within breeds (de Vries and van der
¨
deposition. Efficient production of good quality meat Wal, 1993; Schworer et al., 1999).
may be obtained by reducing the total fat amounts The two fat depots of greatest interest to the while fat depots important for meat quality is kept at industry so far are backfat and intramuscular fat, also optimum levels. It is generally known that breeds of known as marbling. Backfat has been the selection criterion for leanness in several breeding schemes for several decades. Marbling has gained increased attention during the past few years due to its connection to meat quality (DeVol et al., 1988; Barton-Gade, 1990; Tornberg et al., 1993; Casteels
*Tel.: 147-64-948-000; fax:147-64-947-960.
E-mail address: [email protected] (K. Kolstad). et al., 1994). Selection for high performance may
have resulted in a lower marbling score, and poorer lar fat (Wood and Cameron, 1994). Also included meat quality compared to less intensively selected was a crossbreed (LLP) between Norwegian Land-breeds (Gregor and Scholz, 1993; Cameron et al., race (L) and a selection line (LP) selected for high
1999). backfat and low growth rate (Vangen, 1979). The LP
Differences between breeds of pig are found in selection line pigs have a backfat thickness of amounts of internal fat (Kolstad et al., 1996). approximately 31 mm at slaughter (Vangen, 1980). Internal fat depots do not influence carcass quality. Comparing amounts and distribution of fat in those They will, however, influence the efficiency of meat genetic groups may help us to understand the production. Whole body scanning is necessary to background of genetic variation in these traits, and
detect internal depots in live animals. indicate potentials for genetic changes.
Computer tomography (CT) can be used for
detailed measurement of body components and fat 2.2. Experimental design, housing, feeding and distribution on live animals (Afonso, 1992; Vangen weight recording
and Thompson, 1992; Kolstad and Vangen, 1996;
Kolstad et al., 1996). Earlier studies based on CT A total of 141 pigs were included in the experi-observations on different breeds of pigs by Luiting et ment representing the three genetic groups Landrace al. (1995), Kolstad and Vangen (1996), and Kolstad (63), Duroc (62) and Landrace*LP (16). For the et al. (1996) proved breed differences in mainte- experiment, two males and two females were select-nance requirements, fat distribution and fat mobilisa- ed at random from each litter. The experiment tion in pigs at about 60 kg live weight, i.e. when the included four batches, the first one starting in the pigs grow most rapidly. The aim of the present study autumn 1996, and the last one ending in the spring was to examine development of different fat depots 1998. All batches included all three genetic groups in three genetic groups of pigs by repeated measure- and both sexes except the last batch where LLP was ments of body composition by CT within animals not represented.
from weaning to slaughter, in order to increase the The animals entered the experiment at weaning (5 understanding of the background of genetic variation weeks of age). The animals stayed in mixed groups in amounts and distribution of fat in pigs at different of about six during the whole experiment, with free live weights, and indicate potentials for genetic access to water. The indoor temperature was kept at
changes. about 208C.
From weaning to 25 kg live weight, the animals were group fed. Piglets in the first two batches were
2. Material and methods fed ad libitum, or 80% of ad libitum during this period. In the two last batches, all animals were fed
2.1. Animals ad libitum, but with feed differing in lysine content
(0.8 and 1.0%). Genotypes and sexes were equally Pigs of the two breeds Norwegian Landrace and represented in each of the feeding strategies. The Duroc were included in the experiment, as they are effects of feeding level and lysine content will be known to differ considerably in growth, body com- dealt with in another paper from the experiment. position and fat distribution, partly because of differ- Those effects were, however, adjusted for in the ent selection history. The Norwegian Landrace is a statistical analysis.
highly efficient breed which has been intensively From 25 to 105 kg live weight, the animals were selected for leanness and rapid gain for 35–40 hand-fed ‘to appetite’ twice a day a standard feed generations (Vangen and Sehested, 1997; Norsvin, used for commercial slaughter pigs, with an energy
1999). The Duroc population in Norway is of content of 12.03 MJ ME per kg of feed and 12.3%
and slaughtered when they reached 105 kg live Tissue density51.00621(mean tissue weight.
Hounsfield unit value30.00601)
2.3. Computer tomography The sum of all tissue weights between the first and
last CT image in each animal is referred to as Computer tomography (CT) was used for measur- CT-weight in the following, while the sum of all fat ing changes in body composition during the experi- depots between the first and last CT image is referred ment. The pigs were scanned at weaning (|10 kg), to as total fat.
at about 25, 50, 85 and 105 kg live weight, totaling five times in each animal, except for the last batch,
2.4. Statistical analysis where technical problems limited the number of
scannings to the three first live weights. The pigs
The main effects on amounts and proportions of were fasted for more than 16 h before scanning. The
fat depots were analysed using an animal model anaesthetic Azaperon (4 mg / kg live weight) was
including a relationship matrix (model 1). The administrated by intramuscular injection followed by
ASReml software developed by Gilmour et al. a vascular injection of Phentotal sodium (5 mg / kg
(1999), was used to estimate fixed effects (genetic live weight). This immobilised them for about 30
group, sex, batch, the covariate age and one of the min and minimised artefacts in the CT images due to
two covariates CT-weight or total fat) and random movements of the animals. A series of
cross-section-effects (animal, error), and to test for significance al images was collected throughout the body of the
under a general mixed model. Interactions were animal. The first cross-sectional image was taken at a
included in the model whenever they were significant position proximate to the femur / tibia articulation.
(P,0.05). Thereafter, images were taken with a constant
dis-tance between them throughout the body until the
* *
Yijklmn5m 1b W1 ijklmn1 b AG2 ijklmn1Bi1Sj
first cervical vertebra was reached. At 10 and 25 kg
live weight this constant distance was 40 mm, while 1Tk1Fkl1Aim1eijklmn (1)
at 50, 85 and 105 kg live weight, the distance was 50
mm. A total of 20 to 25 images were taken on each where: Yijklmn is a fat depot at a live weight;m is the animal, depending upon the length of the body. The general mean for Yijklmn; B is the effect of genetici
PC based CT image analysis program CATMAN group (i51,2,3); S is the effect of sex ( jj 51,2); Tk
(Thompson and Kinghorn, 1992) was used to quan- is the effect of batch (k51,2,3,4); F is the effect ofil
tify areas of fat, lean, non-fat visceral components feeding system from 10 to 25 kg live weight within (NFVC) and bone in each image as well as depots batch (l51,2); Aim is the random additive genetic within tissues. These components can easily be effect of animal m; b1 and b2 are the regression recognised in the image and recorded with high coefficients; Wijklmn is the effect of the covariate
2
precision (R 50.85–0.95) (Vangen, 1988; Afonso, CT-weight or total fat weight; AGijklmn is the effect
1992; Jopson et al., 1995). of the covariate age; eijklmnis the random error.
The total weight of each depot and tissue com- When considering amounts of fat in each depot ponent was estimated from total volume and mean relative to CT-weight, model 1 was used including density. Total volume was determined using the covariate CT-weight. When fat distribution was Cavalieri’s principle by multiplying the sum of areas to be considered, total fat between the first and last in all images with the distance between each image CT image was included as a covariate, while CT-assuming a random sampling of parallel sections weight was excluded. Allometric growth coefficients separated by a known distance (Gundersen et al., (b) were estimated within each animal according to
b
1988). Mean density was determined from a function the function y5aX to describe the changes in relating Hounsfield unit value to tissue density proportion of each fat depot relative to CT-weight
coefficient b was estimated by regressing the growth coefficients for each fat depot from 10 to 105 logarithm of component weight ( y) on the logarithm kg live weight relative to CT-weight and total fat of live weight or total fat (X ): log y5log a1b log X. respectively.
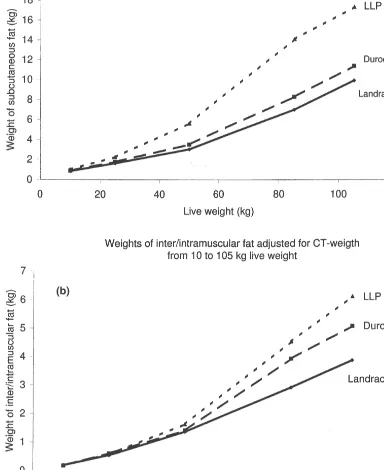
3.1. Genotype differences in amounts of depot fat
3. Results adjusted for CT-weight
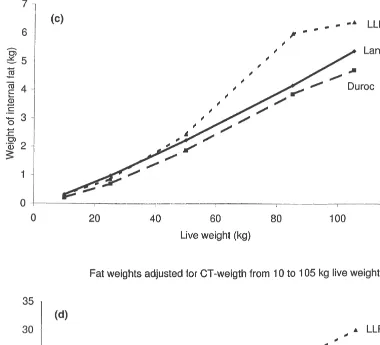
Significant effects of main effects and interactions Absolute amounts of fat increased in all three on fat depots at five live weights are indicated in genetic groups during growth (Fig. 1). According to Tables 1 and 2. Table 3 presents solutions for genetic the estimated allometric growth coefficients in Table differences in depot fat adjusted for CT-weight, to 4 inter / intramuscular fat increased in proportions compare the breeds with respect to amounts of fat in relative to CT-weight (b51.0) in all three genetic each depot at the five live weights. Table 3 also groups (P,0.05) except for the Landrace pigs with presents solutions for breed differences in depot fat b-value ,1.0 for subcutaneous fat (P,0.05). The adjusted for total fat to compare the breeds with genetic groups all differed in allometric fat growth respect to fat distribution. Table 4 presents allometric relative to live weight in this experiment. LLP
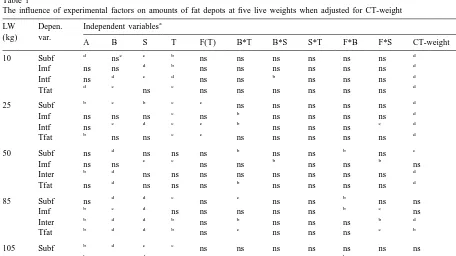
Table 1
The influence of experimental factors on amounts of fat depots at five live weights when adjusted for CT-weight
a
B5effect of genetic group, S5effect of batch, F(T)5effect of feeding system from 10 to 25 kg live weight within batch, A5random additive genetic effect of animal.
b
Indicates effects at significance level P50.05.
c
Indicates effects at significance level P50.01.
d
Indicates effects at significance level P50.001.
e
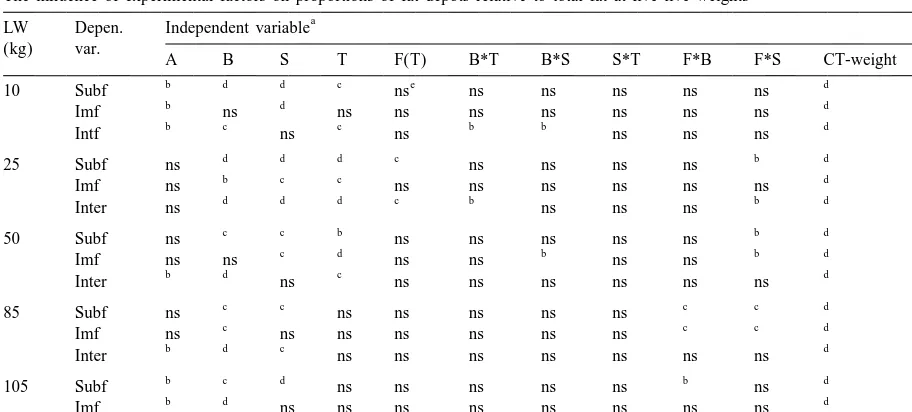
Table 2
The influence of experimental factors on proportions of fat depots relative to total fat at five live weights
a
B5effect of genetic group, S5effect of sex, T5effect of batch, F(T)5effect of feeding system from 10 to 25 kg live weight within batch, A5random additive genetic effect of animal.
b
Indicates effects at significance level P50.05.
c
Indicates effects at significance level P50.01.
d
Indicates effects at significance level P50.001.
e
n.s.5not significant effect.
showed the highest allometric growth coefficients Some differences are seen between the LLP and while Landrace showed the lowest for the three fat the modern breeds at weaning (10 kg) and at 25 kg depots (P,0.05). There were also differences be- live weight with respect to amounts of fat in each tween the three fat depots in allometric growth depot (Table 2), with LLP having significantly coefficients, with inter / intramuscular fat having a higher amounts of subcutaneous fat (P,0.05). significantly higher growth than the subcutaneous fat Duroc pigs have more internal fat (P,0.010) at 10
depot relative to CT-weight (P,0.05). kg live weight, while Landrace pigs have somewhat
Table 3 presents differences between genetic higher amounts (P,0.10) and Duroc somewhat
groups in CT-weight adjusted fat amounts in the lower amounts (P,0.10) of internal fat than the LLP three depots at each live weight. The amounts of at 25 kg. At 50 kg live weight, LLP has significantly subcutaneous fat are somewhat higher (P50.10) in higher amounts of subcutaneous fat than the Duroc Duroc than in Landrace at 50 kg, and significantly and Landrace (P,0.05), more internal fat (P,0.05) higher at 85 and 105 kg live weight. Amounts of and indications of more inter / intramuscular fat (P, inter / intramuscular fat are significantly higher in the 0.10) than the Duroc, as well as indications of more Duroc compared to the Landrace at 85 and 105 kg inter / intramuscular and internal fat than the Land-live weight (P,0.05) but not at 50 kg or lower. At race (P50. 10). At 85 and 105 kg live weight almost 10 kg live weight Landrace pigs have significantly all fat depots are significantly larger in the LLP higher amounts of internal fat than pigs of Duroc compared to the two other genetic groups when breed (P,0.010). This difference is maintained adjusting for total CT-weight (P,0.05), except for
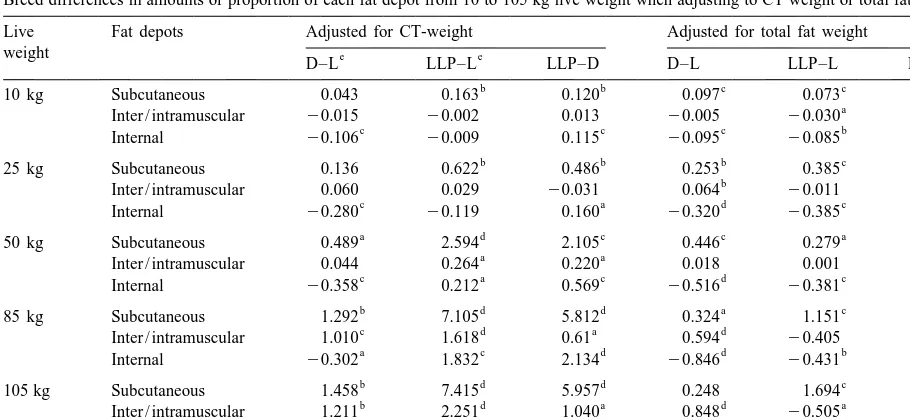
Table 3
f
Breed differences in amounts or proportion of each fat depot from 10 to 105 kg live weight when adjusting to CT weight or total fat weight Live Fat depots Adjusted for CT-weight Adjusted for total fat weight
weight e e
D–L LLP–L LLP–D D–L LLP–L LLP–D
b b c c
10 kg Subcutaneous 0.043 0.163 0.120 0.097 0.073 20.023
a
Inter / intramuscular 20.015 20.002 0.013 20.005 20.030 20.024
c c c b
Internal 20.106 20.009 0.115 20.095 20.085 0.010
b b b c
25 kg Subcutaneous 0.136 0.622 0.486 0.253 0.385 0.132
b a
Inter / intramuscular 0.060 0.029 20.031 0.064 20.011 20.074
c a d c
Internal 20.280 20.119 0.160 20.320 20.385 20.034
a d c c a
50 kg Subcutaneous 0.489 2.594 2.105 0.446 0.279 20.167
a a
Inter / intramuscular 0.044 0.264 0.220 0.018 0.001 0.016
c a c d c
Internal 20.358 0.212 0.569 20.516 20.381 0.135
b d d a c c
85 kg Subcutaneous 1.292 7.105 5.812 0.324 1.151 0.827
c d a d c
Inter / intramuscular 1.010 1.618 0.61 0.594 20.405 20.998
a c d d b b
Internal 20.302 1.832 2.134 20.846 20.431 0.415
b d d c c
105 kg Subcutaneous 1.458 7.415 5.957 0.248 1.694 1.446
b d a d a d
Inter / intramuscular 1.211 2.251 1.040 0.848 20.505 21.353
c c d d c a
Internal 20.671 1.017 1.689 21.034 20.710 0.323
a
Indicate differences at significance level P50.10.
b
Indicate differences at significance levels P50.05.
c
Indicate differences at significance level P50.01.
d
Indicate differences at significance level P50.001.
e
L5Landrace, D5Duroc, LLP5crossbreed between Norwegian Landrace and a selection line selected for high backfat and slow growth.
f
CT-weight5sum of body components and total fat5sum of fat components, both measured by CT.
Table 4
a
Allometric growth coefficients for fat growth from 10 to 105 kg live weight
Fat depot W5CT-weight Y5total fat
Landrace Duroc LLP Landrace Duroc LLP
b,e c d,e e e e
Subcutaneous 0.89 0.96 1.13 0.933 0.91 0.94
b,e c,e d,e b,e c,e bc,e
Inter / intramuscular 1.10 1.28 1.42 1.17 1.23 1.20
b c,e d,e
Internal 0.98 1.08 1.22 1.02 1.02 1.01
a
Y5fat depots, X5CT-weight or total fat weight.
b,c,d
Means within a row and heading with different superscript letter differ (P,0.05).
e
Indicates allometric growth coefficients significantly different from 1 (P,0.05).
intramuscular fat at 85 and 105 kg, which is slightly tramuscular fat and not significantly different from
below significance level (P,0.10). 1.0 for internal fat. These indicate that subcutaneous
fat decreases as a proportion of total fat in favour of 3.2. Genotype differences in depot fat as a inter / intramuscular fat. Significant genotype
differ-proportion of total fat ences were found in allometric growth of inter /
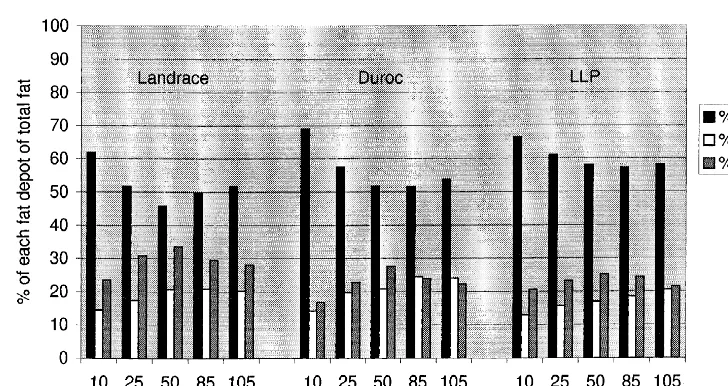
Fig. 2. Fat depots (jsubcutaneous,9inter / intramuscular andhinternal) expressed as a proportion of total fat at 10, 25, 50, 85, and 105 kg live weight in Landrace (n563), Duroc (n562) and LLP (n516).
at each of the five live weights in the three genetic tramuscular fat while LLP shows a higher relative groups. Significant differences in fat distribution proportion of subcutaneous fat and internal fat. between Landrace and Duroc are found at all live
weights. The relative proportion of subcutaneous fat
is significantly higher in the Duroc than in the 4. Discussion
Landrace at 10, 25 and 50 kg live weight (P,0.05),
and slightly higher at 85 kg live weight (P50.10). 4.1. Amounts and distribution of fat The relative proportion of the inter / intramuscular fat
depot is significantly higher in the Duroc at 25, 85 The changes in distribution during the growth and 105 kg live weight (P,0.05, P,0.01, P, period seem to follow similar patterns for the three 0.001), but not significantly higher at 50 kg live genotypes represented in the study (Fig. 2). The weight. Landrace has a significantly higher propor- subcutaneous fat depot is the dominating fat depot at tion of internal fat than the Duroc at all stages all stages, containing more than half of total body fat
(P,0.01, P,0.001). except for Landrace at 50 kg live weight. The
Compared to the Landrace, LLP has a higher proportion of fat depots differs between genotypes, proportion of subcutaneous fat relative to total fat, with the Landrace having a relatively high proportion and a lower proportion of internal fat during the of internal fat, Duroc a high proportion of inter / whole growth period (Table 3). The differences in intramuscular fat and LLP a high proportion of inter / intramuscular fat are not significant, although subcutaneous fat.
fat than in total fatness (Vangen and Thompson, Kolstad et al. (1996) found in an earlier
experi-1992). ment that pigs of Landrace and Duroc breed fed at
Parts of the inter / intramuscular fat depot are maintenance level to keep constant live weight of 60 located close to the backfat. It is even suggested that kg for 8 weeks mobilised 65 to 75% of subcutaneous the third layer of backfat is closely correlated to and inter / intramuscular fat, while only 30 to 40% of degree of marbling (Eggert et al., 1998). This may the internal fat depot was mobilised. Kolstad et al. lead to a greater change in the inter / intramuscular fat (1996) suggested that the ability to mobilise also depot than in internal fat when using backfat thick- reflected the ability is to deposit fat, and that the ness as selection criterion for leanness. Different lower the genetic capacity for fat deposition is, the selection intensity and strategies may then cause higher the ability to mobilise fat. This is also
genetic differences in fat distribution. suggested by others (Standal et al., 1973; Wood et
The relatively high amount of internal fat in the al., 1977). As seen from the present experiment, fat Landrace compared to Duroc and LLP is also found is deposited differently in various depots, and in in earlier experiments (Kolstad et al., 1996). There accordance with the previous suggestions. Fat depo-has not been much attention paid to this fat depot in sition at about 60 kg live weight, i.e. between 50 and commercial pig meat production. It is likely that a 85 kg, showed a higher increase, expressed in relative high proportion of total fat deposited in the proportion of amounts at 50 kg, in subcutaneous and Landrace will be deposited as internal fat as both inter / intramuscular fat (113–178%) than the internal inter / intramuscular fat and subcutaneous fat are depot (87–106%) in Landrace and Duroc pigs (Fig. controlled by selection criteria as meat proportion 1a–c).
and backfat thickness. As seen by comparing the The ability to mobilise fat from different fat Landrace with the LLP, all fat depots have decreased depots when fed below energy needs, may indicate in size through selection against backfat thickness, which fat depots are most important as energy supply but the proportional decrease is least for the internal for certain processes. Results from a maintenance depot. There may be potentials for further progress study of Kolstad and Vangen (1996), showed that in selection for efficiency in the Landrace by reduc- maintenance feeding in the middle of rapid growth to ing the internal fat depot, as this has not been keep live weight constant at 60 kg during 8 weeks
changed much by traditional breeding. resulted in growth of muscles, while fat was
mobil-ised. As already referred to, subcutaneous and inter /
4.2. Development of fat depots intramuscular fat was in the same study found to be
more easily mobilised than internal fat when fed pigs According to the allometric growth coefficients, at maintenance (Kolstad et al., 1996). This may subcutaneous fat is the earliest maturing fat depot show the importance of these fat depot’s as energy while inter / intramuscular fat are the latest maturing supply for growth at this stage when feed is limited. depot in all three genetic groups. As seen from Table The LLP is a genetically fat line compared to the 4, increased slaughter weight will increase amounts modern Landrace. Selection for leanness did, how-and proportions of inter / intramuscular fat in Lhow-and- ever, not result in less total fat early in life, i.e. at 10 race as well as in Duroc and LLP. When comparing and 25 kg live weight (Fig. 1d). This may explore a modern breeds, i.e. Landrace and Duroc, with old potential for further progress in selection for ef-type pigs (LLP) one may conclude that selecting for ficiency in Landrace and Duroc by reducing fat leanness by using backfat at later stages of growth, amounts at earlier stages. This lack of differences as a selection criterion seems to have altered the may however be due to the fact that there might be growth curves for the fat depots (Figs. 1a–d). strong connections between piglet survival and fat Selection for reduced body fat also seems to have amounts at earlier stages as discussed by Herpin et resulted in earlier maturing of all fat depots (Table al. (1993) preventing further progress in this trait. 4). This is in accordance with Kouba et al. (1999) This may also be the reason for the relative high who found higher allometric growth coefficients for proportion of subcutaneous fat at 10 kg live weight fat growth in Meishan pigs than in more efficient, compared to later stages, accounting for 60–70
isolation may be the determining factor for this Selection for reduced fat content at slaughter priority. Breed (L vs. D) or intensive selection for seems to have changed the shape of the growth curve leanness (L vs. LLP) have not affected this priority for total fat and the three fat depots studied from 10 dramatically. Even though there are some differences to 105 kg live weight, and has resulted in earlier in absolute amount of this fat depot (LLP vs. L, D), maturation of the fat depots.
the relative high proportion of subcutaneous fat still Modern breeds do not differ in total fat amounts indicates that the piglets will try to deposit much of from ‘old’ type at weaning, but the differences are this fat depot within the limits of total fat amounts. highly significant at slaughter. Some further progress in selection for efficiency may be gained by reducing
4.3. Early detection of differences fat amounts at earlier stages, i.e. below 50 kg live
weight with the risk of influencing piglet survival. One purpose of this study was to see how early in More attention may also be given to the internal fat life differences between genotypes are present and depot in order to increase efficiency, especially in the can be detected. Differences between genotypes in Landrace breed. This may also have unwanted size of fat depots are visible already at 10 kg live effects. Finally, CT, as a non-invasive technique weight with Landrace having more internal fat than providing detailed information of body composition, Duroc. This difference is still present at 105 kg live is a useful tool for studies of growth and develop-weight. The higher amounts of subcutaneous fat in ment in animals.
LLP compared to Landrace and Duroc at 105 kg is also present from 10 kg live weight. The higher amounts of inter / intramuscular fat at 105 kg in
Acknowledgements
Duroc compared to the Landrace, which is in accord-ance with what is expected for this breed (Wood and
The author acknowledges Professor Odd Vangen Cameron, 1994), is not present until 85 kg live
for initiating the research project, and for his contri-weight according to this experiment, which is not
bution in the scientific discussions. Acknowledged very early.
also is the skilled technical assistance given by K. Information about early appearance of differences
Dalen running the Computer Tomograph, and A. may be utilised for breeding purposes. This also
Mehl, Ø. Kongtorp and N. Horgen at the Research provides us with information about development of
Unit, Agricultural University of Norway. Thanks to fat depots in pigs. There are most likely reasons for
the Norwegian Research Council for their financial developing a fat depot at a certain stage. This must
support. be taken into account when utilising breed
differ-ences and genetic variation in practical breeding.
4.4. Conclusions References
Results from the present study show that there are Afonso, J.J.M., 1992. Factors affecting growth and body com-differences between genotypes in fat deposition and position in sheep. Ph.D. Thesis, University of New England,
distribution from 10 to 105 kg live weight. The Armidale, Australia, 253 pp.
Barton-Gade, P.A., 1990. Danish experience in meat quality
magnitude of breed differences varied between the
improvement. In: Proceedings of the Fourth World Congress on
fat depots. Subcutaneous fat depot is the largest fat
Genetics Applied to Livestock Production, Genetics of Meat
depot, and is relatively largest at weaning in all three Quality, pp. 511–520.
breeds. This fat depot is absolutely and relatively Cameron, N.D., Nute, G., Brown, S., Wood, J.D., 1999. Meat
largest in the genetically old LLP. The efficient, fast quality of Large White pig genotypes selected for components of efficient lean growth rate. Anim. Sci. 68, 115–127.
growing Landrace breed has relatively high amounts
Casteels, M., Van Oecel, M.J., Boschaerts, L., Spincemaille, G.,
and proportions of internal fat during the whole
´
Boucque, Ch.V., 1994. The relationship between carcass, meat
growth period. Inter / intramuscular fat depot appears and eating quality of three pig genotypes. Meat Sci. 40,
to be higher in the Duroc breed at 85 kg but not 253–269.
R.D., Carr, T.R., 1988. Variation in composition and palatabili- Breeders Association and Norwegian Meat Association, Nor-ty traits and relationships between muscle characteristics and way, p. 56.
palatability in a random sample of pork carcasses. J. Anim. Sci. Schinckel, A.P., Forrest, J.C., Berg, E., Sheiss, E., Einstein, M.E., 66, 385–394. 1996. Swine lean growth and pork quality evaluation trails. In: Eggert, J.M., Schinckel, A.P., Mills, S.E., Forrest, J.C., Gerrard, Purdue Swine Day, 1996, Purdue University, West Lafayette,
D.E. et al., 1998. Growth and characterisation of individual IN, USA. ¨
backfat layers and their relationship to pork carcass quality. In: Schworer, D., Hofer, A., Loren D Rebsamen, A., 1999. Selection Swine Day Report 1998, Purdue University, West Lafayette, progress of intramuscular fat in Swiss pig production. In: IN, USA. Commission on Pig Production, Session 4, Zurich, Switzerland, Fullerton, G.D., 1980. Fundamentals of CT tissue characterisation. 50th Meeting of the European Association for Animal
Pro-In: Fullerton, G.D., Zagzebski, J.A. (Eds.), Medical Physics of duction.
CT and Ultrasound: Tissue Imaging and Characterisation, Standal, N., Void, E., Trygstad, O., Foss, I., 1973. Lipid mobilisa-Medical Physics Monograph, Vol. No. 6, American Institute of tion in pigs selected for leanness or fatness. Anim. Prod. 16,
Physics, pp. 125–162. 37–42.
Gilmour, A.R., Thompson, R., Cullis, B.R., Welham, S.J., 1999. Thompson, J.M., Kinghorn, B.P., 1992.CATMAN— a program to In: ASREML Reference Manual, NSW Agriculture, ORANGE, measure CAT-Scans for prediction of body components in live 2800, Australia, p. 213. animals. In: Proceedings of the Tenth Conference of the Gregor, G., Scholz, A., 1993. Evaluation of intramuscular fat- Australian Association of Animal Breeding and Genetics,
content in the longissimusdorsi muscle by video image-analysis AAABG, Rockhampton, Australia.
and discussion of objectives in pig breeding. Archief fur Tornberg, E., Anderson, A., Gdransson, A., vonSeth, G., 1993. Tierzuchtung-archieves of Animal Breeding 36 (3–4), 383– Water and fat distribution in pork in relation to sensory
395. properties. In: Poulanne, E., Demeyer, D.J., Ruusunene, M.,
Gundersen, H.J.G., Bentsen, T.F., Korbo, L., Marcussen, N., Ellis, S. (Eds.), Pork Quality: Genetic and Metabolic Factors, Møller, A., Nielsen, K. et al., 1988. Some new, simple and CAB International, Wallingford, UK, pp. 239–258.
efficient stereological methods and their use in pathological Vangen, O., 1979. Studies on a two trait selection experiment in research and diagnosis. Acta Phatol. Microbiologica Scan- pigs. II. Genetic changes and realized genetic parameters in the dinavia 96, 379–394. traits under selection. Act. Agric. Scand. 29, 305–319. Herpin, P., Le Dividich, J., Amaral, N., 1993. Effect of selection Vangen, O., 1980. Studies on a two trait selection experiment in
for lean tissue growth on body composition and physiological pigs. IV. Estimating maintenance requirements from feeding state of the pig at birth. J. Anim. Sci. 71, 2645–2653. experiment. Acta Agric. Scand. 30, 142–148.
Jopson, N.B., Kolstad, K., Sehested, E., Vangen, O., 1995. Vangen, O., 1988. In: Sixth World Conference on Animal Pro-Computer tomography as an accurate and cost effective duction, Helsinki, Finland, Experience from several years of alternative to carcass dissection. Proc. Aust. Assoc. Anim. using computer tomography (CT) in animal breeding research. Breed. Genet. 11, 635–638. Vangen, O., Sehested, E., 1997. Swine production and research in Kolstad, K., Jopson, N.B., Vangen, O., 1996. Breed and sex Norway. Pig News Inform. 18 (1), 29N–34N.
differences in fat distribution and mobilisation in growing pigs Vangen, O., Thompson, J., 1992. The use of CAT-scanning to fed at maintenance. Livest. Prod. Sci. 47, 33–41. measure maintenance efficiency in genetic lines of sheep. In: Kolstad, K., Vangen, O., 1996. Genetic differences in maintenance Commission on Sheep and Goat Production, Session 5, Madrid, efficiency when accounting for changes in body composition. Spain, 43rd Meeting of the European Association for Animal
Livest. Prod. Sci. 47, 23–32. Production.
Kouba, M., Bonneau, M., Noblet, J., 1999. Relative development de Vries, A.G., van der Wal, P.G., 1993. Breeding For Pork of subcutaneous, intermuscular, and kidney fat in growing pigs Quality. In: Poulanne, E., Demeyer, D.I., Ruusunene, M., Ellis, with different body composition. J. Anim. Sci. 77, 622–629. S. (Eds.), Pork quality: genetic and metabolic factors, CAB Le Dividich, J., Herpin, P., 1994. Effects of climatic conditions on International, Wallingford, UK, pp. 58–72.