A Rapid and Simple High-Performance Liquid Chromatographic Method
for Determination of Levofloxacin in Human Plasma
Dion Notario
1,2, Sudibyo Martono
2, Zullies Ikawati
2, Arief Rahman Hakim
2,
Fathul Jannah
2, and Endang Lukitaningsih
2,*1
Department of Pharmacy, Faculty of Science and Technology, Ma Chung University, Villa Puncak Bukit Tidar, Malang 65151, East Java, Indonesia
2
Faculty of Pharmacy, Universitas Gadjah Mada, Sekip Utara, Yogyakarta 55281, Indonesia
Received July 4, 2016; Accepted December 22, 2016
ABSTRACT
A simple and rapid high-performance liquid chromatography method was developed and validated for quantifying LEV in human plasma. Chromatographic separation was performed under isocratic elution on a Luna Phenomenex®C18 (150 × 4.6 mm, 5 µm) column. The mobile phase was comprised of acetonitrile, methanol, and phosphate buffer 25 mM pH 3.0 (13:7:80 v/v/v) and pumped at a flow rate of 1.5 mL/min. Detection was performed by UV detector at a wavelength of 280 nm. Samples were pre-treated with acetonitrile followed by centrifugation, evaporation, and reconstitution step. The method proved linear (r = 0.995), sensitive (LLOQ and LOD was 1.8 and 0.6 µg/mL respectively), accurate (% error above LLOQ ≤ 12% and LLOQ ≤ 20%), precise (RSD ≤ 9%), robust in the ranges of 1.8-28.8 µg/mL, rapid (separation time not more than 10 min), and simple (use no organic additive in mobile phase). The method was showed reliable for quantifying LEV in human plasma.
Keywords:levofloxacin; HPLC-UV; validation; human plasma
ABSTRAK
Dalam penelitian ini dikembangkan metode analisis secara kromatografi cair kinerja tinggi yang sederhana, cepat, dan tervalidasi untuk menganalisis LEV dalam plasma manusia. Pemisahan secara kromatografik dilakukan pada kolom Luna Phenomenex®C18 (150 × 4,6 mm, 5 µm). Fase gerak terdiri dari asetonitril, metanol, dan dapar fosfat 25 mM pH 3,0 (13:7:80 v/v/v) dan dialirkan pada kecepatan 1,5 mL/menit. Deteksi dilakukan menggunakan detektor UV pada panjang gelombang 280 nm. Sampel disiapkan dengan pemberian asetonitril yang diikuti dengan sentrifugasi, evaporasi, dan rekonstitusi. Metode yang dikembangkan terbukti linier (r = 0,995), peka (batas kuantifikasi dan batas deteksi berturut-turut adalah 1,8 dan 0,6 µg/mL), teliti (% kesalahan diatas batas kuantifikasi ≤ 12% dan pada batas kuantifikasi ≤ 20%), tepat (SDR ≤ 9%), tangguh pada rentang 1,8-28,8 µg/mL, cepat (waktu pemisahan tidak lebih dari 10 menit), dan sederhana (tanpa bahan organik tambahan di dalam fase gerak). Metode yang dikembangkan terbukti valid dan dapat dipercaya untuk menganalisis LEV dalam plasma manusia.
Kata Kunci:levofloksasin; HPLC-UV; validasi; plasma manusia
INTRODUCTION
Levofloxacin (LEV), L-isomer of ofloxacin (OFL), is a fluoroquinolone antibiotic that has an important role in treatment infectious diseases. Some infectious diseases such as chronic bacterial prostatitis, lower respiratory tract infections, urinary tract infections and H. pylori infection could be successfully cured by LEV [1-3]. The great potency of LEV encouraged several pharmaceutical industries to produce many brands of LEV. Moreover, Food and Drug Administration (FDA) was approved applications of 12 pharmaceutical industries to produce the first generic product of LEV [4].
OH
tetrabutylammonium bromide [11], tetramethyl ammonium bromide [8], butadiene styrene brominated ammonium [9], tetrabutylammonium hydrogen sulfate [10], and trifluoroacetic acid [6,15]. The other method was developed under gradient elution using a formic acid 0.05% and methanol as mobile phase component [17], but this method gives relatively long separation time (about 13 min). Use of additive for improving separation may have disadvantages including slow equilibrium time and reduce column lifetime [18]. In the other hand, gradient elution causes some potential problems such as tailing peak, early elution, late elution, and artifact peaks [18]. For these reasons, we developed HPLC-UV method that simple, rapid, and consuming no additives for determination LEV based on its physicochemical properties.
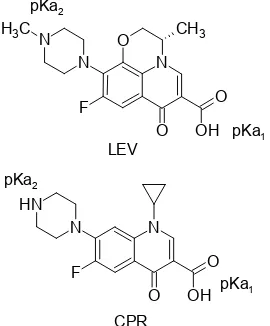
LEV is an amphoteric molecule (Fig. 1) with pKa1
and pKa2value of 6.22 and 7.81 respectively [19], and a
relatively polar compound with log P(o/w) 0.59 at the
isoelectric point (pH 7.1) [20]. LEV has a chromophore system that can absorb UV radiation with a molar
absorptivity (ε) of 3.1 × 10⁴
L mol-1cm-1 at λ of 293.7 nm in HCl 0.1 N solution [21]. The molecular structure of LEV is almost same to CPR so they have similar chemical properties. CPR has pKa1 and pKa2 value of
6.42 and 8.29 respectively; log P(o/w)of 0.13 (pH 7.4), and ε of 9.0 × 10⁴
L mol-1cm-1 at λ of 275 nm in aqueous solution [19-20,22]. The similarity in physicochemical properties makes LEV-CPR ratio remained constant throughout the sample preparation. Besides, LEV and SPR can be separated by HPLC-UV [6], so CPR is suitable as an internal standard to correct errors during the analytical process.
The amine moieties in LEV and CPR can interact with silanol residues by electrostatic interaction at pH > 3 causing peak tailing and increasing retention time. This interaction can be minimized by adjusting mobile phase pH at 2-3 and using methanol as a proton-donor solvent to hold hydrogen bonding interaction with basic amine moiety. In addition, an aromatic moiety in LEV and CPR molecules can interact with acetonitrile by dipole-dipole interaction proportional to the dipole moment of each aromatic group [18]. So that, an optimum combination of water buffered at pH 3, donor, and proton-acceptor solvent (i.e. methanol and acetonitrile) in mobile phase can give optimum solvent strength and solvent-type selectivity to achieve a good chromatographic separation although there are no additives.
The goal of this invention was to develop an HPLC-UV method which rapid, simple (without additives) and validated for determination LEV in human plasma. The method is expected to be a reference method for bioequivalence studies in many laboratories.
Fig 1.Molecular structure of LEV and CPR
EXPERIMENTAL SECTION
Materials
Levofloxacin and ciprofloxacin (CPR) analytical grade were purchased from Sigma-Aldrich (Buchs, Switzerland). Orthophosphoric acid, potassium dihydrogen phosphate, and glacial acetic acid analytical grade purchased from Merck (Darmstadt, Germany). Acetonitrile and methanol HPLC grade J.T. Baker® were purchased from Avantor (Center Valley, USA). Aqua bidest were purchased from Otsuka (Malang, Indonesia). Human plasma was purchased from Indonesian Red Cross (Yogyakarta, Indonesia).
Instrumentation
Chromatographic separation was performed by using HPLC 2000 Hitachi equipped with pump L-2130, autosampler L-2200, UV-Vis detector L-2420. HPLC system and acquisition data were controlled by D-2000 Elite software (Hitachi). Separation of LEV, CPR, and endogenous compound was performed under isocratic elution with mobile phase comprised of acetonitrile, methanol, and 25 mM phosphate buffer pH 3.0 (13:7:80 v/v/v) and pumped at a flow rate of 1.5 mL/min on a Luna Phenomenex® C18 (250 × 4.6 mm; 5 µm) column. The injection volume was 20 µL and the UV detector was operated at 280 nm.
Procedure
Preparation of standard stock solution, calibration standard, and quality control samples
solution in the mobile phase to a final concentration of 80, 60, 40, 20, 10, and 5 µg/mL. The internal standard (IS) solution was prepared by diluting a primary standard solution of CPR in the mobile phase to a final
concentration of
20 µg/mL. Calibration standards were made by adding 50 µL of LEV working standard to 100 µL human plasma to obtain six concentration levels of calibration curve: 26.7, 20.0, 13.3, 6.7, 3.3 and 1.7 µg/mL. Quality control (QC) samples were prepared independently in the same matrix at low (QC3: 6.7 µg/mL), medium (QC4:
13.3 µg/mL), and high (QC5: 20.0 µg/mL) concentrations
for the between-run study, whereas all levels concentration (QC1: 1.7 µg/mL, QC2: 3.3 µg/mL, QC3:
6.7 µg/mL, QC4: 13.3 µg/mL, QC5: 20.0 µg/mL, QC6:
26.7 µg/mL) in calibration curve were made for within-run study.
Sample preparation
Each of 150 µL aliquot of human plasma was spiked with 50 µL of IS working solution (20 µg/mL). Then, 800 µL acetonitrile was added to precipitate plasma proteins. The mixture was vortex mixed for 1 min and centrifuged at 5,000 rpm for 10 min at 4 °C. After a centrifugation step, 800 µL of supernatant was evaporated to dryness. The residue was reconstituted with 1,000 µL of mobile phase and vortex mixed for 1 min. Reconstituted sample filtered through millipore filter 0.45 µm and placed in autosampler vials for HPLC analysis.
Method validation
Method validation was performed according to the international guideline for bioanalytical method validation [23-24]. The proposed method was validated with respect to selectivity, linearity, lower limit of quantification (LLOQ) and limit of detection (LOD), accuracy and precision, stability, and robustness.
Selectivity. A calibration curve was constructed using six calibration standards at 1.7-26.7 µg/mL as mentioned above. A calibration curve was performed by a weighted square linear regression. Weighting factor yielding best fit of area ratios between LEV and IS versus concentration of LEV in human plasma was chosen for quantitative analysis [25].
Lower limit of quantification and limit of detection. LLOQ was defined as the lowest concentration on the calibration curve which can be measured with acceptable accuracy and precision. Accuracy was expressed as a percentage of deviation or error from nominal concentration (%-error), whereas precision was expressed as relative standard deviation (RSD). Both of them should be within ± 20%. LLOQ was evaluated by analyzing spiked plasma samples at the lowest concentration in five replicates (n = 5). Estimation of
LOD was based on the signal to noise ratio (S/N) and RSD approach. The lowest concentration which had S/N and RSD (from six replicate injections) between 2 to 3 and exceeds 17% respectively was considered as LOD [18].
Accuracy and precision. Within-run accuracy and precision were assessed by analyzing six independent QC samples (QC1-QC6) at the same day, whereas
between-run accuracy and precision were assessed by analyzing three QC samples (QC3-QC5) at different
days. The error value and RSD should be within ± 15%. Stability. Stability of analyte was evaluated by comparing area ratios between freshly prepared QC samples (QC3 and QC5) and QC samples after being
treated to the conditions for stability assessment. The conditions for stability study was agreed with sample storage and handling. Short-term stability was assessed at 25 ± 2 °C for 4 h, post-preparative stability was assessed at 25 ± 2 °C for 24 h. Freeze and thaw stability test for analyte in human plasma was performed at three cycles. The sample was frozen at -20 ± 2 °C for 24 h and thawed unassisted at 25 ± 2 °C until three cycles. Stability of analyte and IS in stock solutions were evaluated at a storage temperature of 4 ± 2 °C for 7 days. Analyte considered stable in those storage conditions if stability/freshly prepared samples ratio (%-remaining) between 85-115%.
Robustness. The robustness study was conducted to evaluate influence small changes in HPLC conditions to analytical results. These conditions included operational wavelength (± 2 nm), flow rate (± 0.1 mL/min), mobile phase proportion (± 2% and ± 1% for aqueous and organic components respectively), pH of buffer (± 0.1 unit). The robustness study was performed by analyzing independent QC samples with a concentration of 13.3 µg/mL, then evaluation of accuracy, precision, and resolution was done. Mean recovery of LEV also statistically evaluated by independent t-test.
RESULT AND DISCUSSION
Method Development
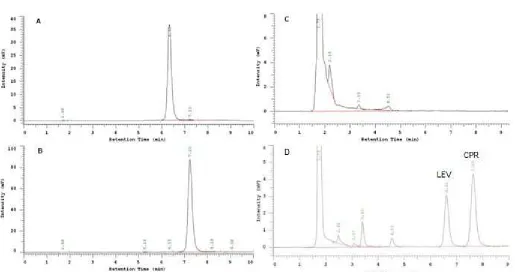
Fig 2.Representative chromatogram of LEV and CPR in solution and human plasma. A: standard solution of LEV, B : standard solution of CPR, C: drug free plasma, D: spiked plasma. Mobile phase: acetonitrile, methanol, and 25 mM phosphate buffer pH 3.0 (13:7:80 v/v/v), flow rate: 1.5 mL/min, column: Luna Phenomenex®C18 (250 × 4.6 mm; 5 µm), Injection volume: 20 µL, and the UV detector was operated at 280 nm. Resolution between LEV and CPR was 3.00
Table 1.System suitability test
LEV (n = 6) CPR (n = 6) Parameters Acceptance criteria (24)
Mean RSD (%) Mean RSD (%)
Retention time (RT, min) RSD ≤ 1% 6.28 0.34 7.23 0.33
Peak area (AUC, mAU) RSD ≤ 1% 74244 0.57 64976 1.03
Tailing factor (TF) ≤ 2 1.20 0.90 1.17 0.67
Resolution (Rs) > 2 3.00 3.76 3.00 3.76
Column capacity (k) > 2 627.33 0.33 722.11 0.31
Number of theoretical plates (N) > 2000 6937 1.76 7287 2.67
10 min (Fig. 2). Based on this data, a good peak shape and separation of LEV and CPR could be achieved using a combination of proton- and acceptor-proton solvent with water buffered at pH of 3.0 on the C18 column without any additive such triethylamine, tetrabutylammonium bromide, and tetramethyl ammonium bromide.
Method Validation
System suitability test
System suitability test was performed before validation step for ensuring that the instrument was in a good performance. Based on this study, we found that all HPLC parameters were meet the FDA requirement (Table 1). Resolution between LEV and CPR was found at 3.00 and tailing factor LEV and CPR was 1.20 and
1.17 respectively. In addition, separation time between LEV and CPR less than 10 min. Based on this data, the developed method was proved to give a good performance.
Selectivity
Table 2.Accuracy and precision of proposed method
Within-Runb(n = 5) Between-Runc(n = 15) Nominal concentration of LEV
in spiked plasma (µg/mL)
x
a Error (%) RSD (%)x
Error (%) RSD (%)1.8 2.0 19.5 8.8 N/Ad N/A N/A
3.5 3.3 8.0 6.5 N/A N/A N/A
7.1 6.3 11.4 1.5 6.5 8.8 3.8
14.2 13.3 6.2 6.2 13.5 4.7 5.9
21.2 23.5 10.8 3.9 23.4 10.2 3.6
28.8 30.3 7.1 5.6 N/A N/A N/A
aAverage calculated concentration of LEV in spiked plasma (µg/mL); bAnalysis of plasma samples was conducted in a single run;cAnalyses of plasma samples were conducted in three different runs;dData not available
Table 3.Stability study of LEV in human plasma (n = 3) %-Remaining (
x
SD
, %)* Stability TestLEV 7.08 µg/mL LEV 21.25 µg/mL 4 h after spiking, 25 ± 2 °C 90.0 ± 4.4 101.9 ± 3.6 24 h after sample preparation, 25 ± 2 °C 99.3 ± 2.1 99.6 ± 0.4 Three cycles of freeze (
20 ± 2 °C) andthaw (25 ± 2 °C) 77.0 ± 0.7 100.6 ± 6.8
*
x
and SD values were average and deviation standard of %-remaining respectivelyLinearity
A calibration curve was generated by weighted-squares linear regression using a weighting factor as the same way as published before [25]. The regression equation that has r value > 0.99 and minimum Sy/x
(standard deviation of y-residual) value was chosen as the best equation. So that, the calibration curve using a weighting factor of 1/x2 was chosen for quantitative
analysis (y = 0.078x − 0.084). The error value of the best
calibration curve was not more than 15% at all level concentration. Therefore, the calibration curve with weighting factor 1/x2 was proven to be linear over the concentration range of 1.8-28.3 µg/mL. According to FDA guideline [23], 28.3 µg/mL was ULOQ value of this method.
Sensitivity
The sensitivity of the method was assessed by determining the lower limit of quantification (LLOQ) and limit of detection (LOD). LLOQ was investigated by analyzing serial low concentration samples of LEV. At a concentration level of 1.8 µg/mL, the limit of error value (i.e. 20% for LLOQ) was nearly exceeded. Therefore, the LLOQ of the method was established at this point. In the other hand, the lowest concentration level that still had S/N value about 2-3 was found at a concentration of 0.6 µg/mL and six replicate injection of this point had an RSD value of 18.8%. According to these approaches, the concentration of 0.6 µg/mL was concluded as LOD.
Accuracy and precision
The accuracy of the developed method was represented by the percentage of analytical errors or deviation between the calculated value and nominal
value. The analytical errors of LEV at all level concentrations both single run and between run were calculated and none of them, except for LLOQ, was not exceed 15% (Table 2). Similar with accuracy, the precision of the proposed method was shown good results. All of the calculated RSD were met to the FDA’s acceptance criteria [23].
Stability
Short-term and post-preparative stability tests were conducted. However, long-term stability cannot be conducted in this experiment, because of the limitation of experiment time. Long-term stability should be conducted minimal in 6 months until one year. The result of the short-term and post-preparative test showed that LEV was stable at those storage conditions. Conversely, freeze and thaw stability test showed that LEV in low concentration was not stable at this storage condition (Table 3). In the other hand, the stability of LEV and CPR in stock solution were evaluated, and both of them showed a good stability until 7thdays (Table 4).
Robustness
Table 4.Stability study of LEV in stock solutiona
aStock solution was comprised of acetonitrile, methanol, phosphate buffer 25 mM pH 3,0 13:7:80 v/v/v; b
x
and SD values were average and deviation standard of %-remaining respectivelyTable 5.The robustness study (n = 4)
HPLC Conditions Concentration of LEV
(µg/mL)b Error (%) RSD (%) Rs
Methanol − 1%, acetonitrile − 1%,
buffer + 2% 14.6 3.1 3.5 3.26
Methanol + 1%, acetonitrile + 1%,
buffer − 2% 14.0 −0.9 1.5 2.45
pH + 0.1 unit 14.8 4.3 1.0 2.79
pH – 0.1 unit 14.5 2.6 2.9 2.78
aFR = flow rate of mobile phase (mL/min); bNominal concentration of LEV in human plasma was 14.2 µg/mL; cT-test showed a significant difference between optimum and challenge condition (P < 0.05);dResolution between LEV and CPR
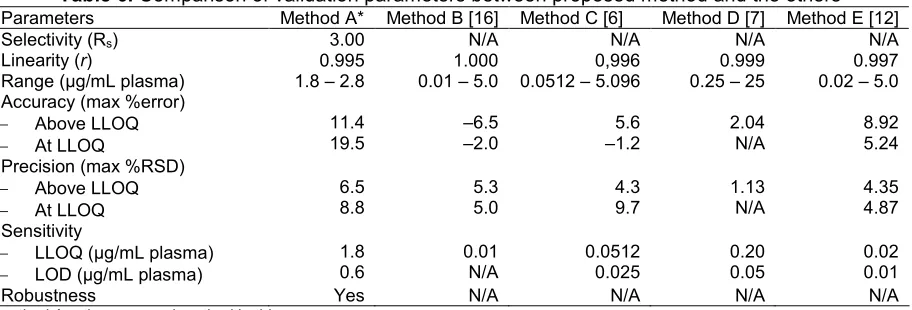
Table 6.Comparison of validation parameters between proposed method and the others Parameters Method A* Method B [16] Method C [6] Method D [7] Method E [12]
Selectivity (Rs) 3.00 N/A N/A N/A N/A
Linearity (r) 0.995 1.000 0,996 0.999 0.997
Range (µg/mL plasma) 1.8 – 2.8 0.01 – 5.0 0.0512 – 5.096 0.25 – 25 0.02 – 5.0
LLOQ (µg/mL plasma)
LOD (µg/mL plasma)
1.8
Robustness Yes N/A N/A N/A N/A
*method A = the proposed method in this paper
shown). The increase in retention time happened while the percentage of buffer was added. Although retention time increase, it still less than 10 min so that separation time still appropriate with the purpose of method development as mentioned before. Changes of wavelength were resulting different analytical result compared with the optimum condition, but accuracy and precision of those analytical results have still met the requirement (Table 5). Therefore, according to the robustness study, the developed method was considered robust.
Comparison with the Other Methods and Application of Method
Fig 3. Chromatogram of LEV in plasma from a healthy subject, collected at 10 min after giving orally Levofloxacin generic tablet. Levofloxacin was analyzed using proposed method and it has a retention time of 6.30 min
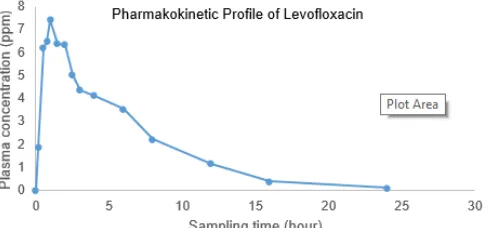
Fig 4.Pharmacokinetic profile of Levofloxacin in healthy subject
methods because there are no data about chromatographic resolution and robustness study published in previous papers. In this paper, we provide more evidence about validation study of proposed method especially robustness study.
Application of this proposed method has been conducted for levofloxacin analysis in plasma from the healthy subject after giving levofloxacin generic tablet obtained from the market. Levofloxacin peak appeared at 6.30 min and there is no overlapping between matrix signal and levofloxacin signal (Fig. 3). Sampling time was conducted at 10, 20, 30, 45 min and continued at 1, 1.5, 2, 2.5, 3, 4, 6, 8, 12, 16 and 24 h after giving an oral tablet. Procedure sampling was done in according to Ethical Clearance (KE/FK/483/EC) from Ethics Commission, Faculty of Medicine, Universitas Gadjah Mada. After plotting plasma concentration data versus sampling time, we got the illustration of the pharmacokinetic profile (Fig. 4). Based on these data, it can be concluded that proposed method can be used in routine analysis such as in bioequivalence test of levofloxacin.
CONCLUSION
A new, rapid, and simple RP-HPLC were optimized and validated according to FDA guideline in term of selectivity, linearity, LLOQ, accuracy, precision, stability, and robustness. A good separation between analyte, internal standard, endogenous compounds and no significant interferences were observed. The developed method showed a good linear relationship between LEV concentration versus area ratio between LEV and CPR at ranges from 1.8-28.3 µg/mL. The correlation coefficient was 0.995 and the errors of calibration curve at each concentration was not greater than 15%. The within and between run accuracy and precision were good and met the requirement for quantitative analysis and fit for the purpose (i.e. bioequivalence study in human). In general, the developed method can be applied for routine analysis such as for bioequivalence study.
ACKNOWLEDGEMENT
The authors are thankful to Ministry of Research, Technology and Higher Education of the Republic of Indonesia (Kementerian Ristek-DIKTI) and Universitas Gadjah Mada for providing a research grant to this work under Excellent Research of University (Penelitian Unggulan Perguruan Tinggi) Program with contract number 92/LPPM/2015 awarded to Dr.rer.nat. Endang Lukitaningsih.
REFERENCES
[1] Naber, K.G., Roscher, K., Botto, H., and Schaefer, V., 2008, Oral levofloxacin 500 mg once daily in the treatment of chronic bacterial prostatitis,Int. J. Antimicrob. Agents, 32 (2), 145–53.
[2] Zhang, Y., Huang, H., Ren, Z., Zheng, H., Yu, Y., Lü, X., Xiao, Z.K., Yang, H.F., Xiu Q.Y., Chen, B.Y., Yue H.M., Hao Q.L., Huang, J.A., Ma, H., Xiao, W., Guo D.Y., Si B., Sun, S.H., Zhang W., Li, Q.H., Shen H.H., Duan, J., Li, H.Y., Yao W.Z., Gu J.M., Xia, Q.M., Ying, K.J., Liu, A., Yang, H.P., Shi, M.H., Sun, T.Y., Ding, G.H., and Wu, G.M., 2009, Clinical evaluation of oral levofloxacin 500 mg once-daily dosage for treatment of lower respiratory tract infections and urinary tract infections: a prospective multicenter study in China,J. Infect. Chemother., 15 (5), 301–311. [3] Peedikayil, M.C., Alsohaibani, F.I., and
[4] Medscape, 2011, FDA Approves First Generic Versions of Levofloxacin. Available from: http://www.medscape.com/viewarticle/745007. [5] Furlanut, M., Brollo, L., Lugatti, E., Di Qual, E.,
Dolcet, F., Talmassons, G., and Pea, F., 2003, Pharmacokinetic aspects of levofloxacin 500 mg once daily during sequential intravenous/oral therapy in patients with lower respiratory tract infections, J. Antimicrob. Chemother., 51(1), 101– 106.
[6] Caufield, W.V., and Stewart, J.T., 2002, Determination of zidovudine and levofloxacin in human plasma by reversed phase HPLC and solid phase extraction, J. Liq. Chromatogr. Related Technol., 25 (12), 1791–1805.
[7] Djabarouti, S., Boselli, E., Allaouchiche, B., Ba, B., Nguyen, A.T., Gordien, J.B., Bernadou, J.M., Saux, M.C., and Breilh, D., 2004, Determination of levofloxacin in plasma, bronchoalveolar lavage and bone tissues by high-performance liquid chromatography with ultraviolet detection using a fully automated extraction method, J. Chromatogr. B, 799 (1), 165–172.
[8] Nemutlu, E., Kır, S., Özyüncü, Ö., and Beksaç,
M.S., 2007, Simultaneous separation and determination of seven quinolones using HPLC: analysis of levofloxacin and moxifloxacin in plasma and amniotic fluid, Chromatographia, 66 (Suppl. 1), 15–24.
[9] Qin, G.D., Xiao, M.Z., Zhou, Y.D., Yang, J., He, H.X., He, Y, and Zeng, Y., 2013, Tamsulosin alters levofloxacin pharmacokinetics in prostates derived from rats with acute bacterial prostatitis, Asian J. Androl.,15 (2), 254–260.
[10] Kontou, P., Manika, K., Chatzika, K., Papaioannou, M., Sionidou, M., Pitsiou, G., and Kioumis, I., 2013, Pharmacokinetics of moxifloxacin and high-dose levofloxacin in severe lower respiratory tract infections, Int. J. Antimicrob. Agents, 42 (3), 262– 267.
[11] Nguyen, H.A., Grellet, J., Ba, B.B., Quentin, C., and Saux, M-C., 2004, Simultaneous determination of levofloxacin, gatifloxacin and moxifloxacin in serum by liquid chromatography with column switching, J. Chromatogr. B, 810 (1), 77–83.
[12] Sousa, J., Alves, G., Campos, G., Fortuna, A., and Falcão, A., 2013, First liquid chromatography method for the simultaneous determination of levofloxacin, pazufloxacin, gatifloxacin, moxifloxacin and trovafloxacin in human plasma, J. Chromatogr. B, 930,104–111.
[13] Tasso, L., de Andrade, C., and Costa, T.D., 2011, Pharmacokinetic/pharmacodynamic modelling of the bactericidal activity of free lung concentrations of levofloxacin and gatifloxacin against
Streptococcus pneumoniae, Int. J. Antimicrob. Agents, 38 (4), 307–313.
[14] Watabe, S., Yokoyama, Y., Nakazawa, K., Shinozaki, K., Hiraoka, R., Takeshita, K., and Suzuki, Y., 2010, Simultaneous measurement of pazufloxacin, ciprofloxacin, and levofloxacin in human serum by high-performance liquid chromatography with fluorescence detection, J. Chromatogr. B, 878 (19), 1555–1561.
[15] Conte, J.E., Golden, J.A., McIver, M., and Zurlinden, E., 2006, Intrapulmonary pharmacokinetics and pharmacodynamics of high-dose levofloxacin in healthy volunteer subjects,Int. J. Antimicrob. Agents, 28 (2), 114–121.
[16] Ji, H.Y., Jeong, D.W., Kim, Y.H., Kim, H-.., Sohn, D.R., and Lee, H.S., 2006, Hydrophilic interaction liquid chromatography–tandem mass spectrometry for the determination of levofloxacin in human plasma,J. Pharm. Biomed. Anal., 41 (2), 622–627. [17] Fang, P.F., Cai, H.L., Li, H.D., Zhu, R.H., Tan, Q.Y., Gao, W., Liu, Y.P., Zhang, W.Y., Chen, Y.C., and Zhang, F., 2010, Simultaneous determination of isoniazid, rifampicin, levofloxacin in mouse tissues and plasma by high performance liquid chromatography–tandem mass spectrometry, J. Chromatogr. B, 878 (24), 2286–2291.
[18] Snyder, L.R., Kirkland, J.J., and Dolan, J.W., 2011, Introduction to Modern Liquid Chromatography, Wiley & Sons, New Jersey. [19] Völgyi, G., Ruiz, R., Box, K., Comer, J., Bosch, E.,
and Takács-Novák, K., 2007, Potentiometric and spectrophotometric pKa determination of
water-insoluble compounds: Validation study in a new cosolvent system,Anal. Chim. Acta, 583 (2), 418– 428.
[20] Völgyi, G., Vizseralek, G., Takacs-Novak, K., Avdeef, A., and Tam, K.Y., 2012, Predicting the exposure and antibacterial activity of fluoroquinolones based on physicochemical properties,Eur. J. Pharm. Sci., 47 (1), 21–27. [21] Badwaik, R.T., Dashputra, A.V., and Gupta, M.,
2012, Determination of levofloxacin in some commercial oral formulations by using spectrophotometer and HPLC, IJMPS, 3 (3), 14– 19.
[22] Cazedey, E.C.L., and Salgado, H.R.N., 2012, Spectrophotometric determination of ciprofloxacin hydrochloride in ophthalmic solution, Adv. Anal. Chem., 2 (6), 74–79.
[24] FDA, 1994, Reviewer Guidance, Validation of Chromatographic Method, Analytical Methods Technical Committee of the Chemistry Manufacturing Controls Coordinating Committee (CMCCC) of the Center for Drug Evaluation and Research at the Food and Drug Administration Rockville.