ANALYTICAL METHOD VALIDATION AND DETERMINATION OF PYRIDOXINE,
NICOTINAMIDE, AND CAFFEINE IN ENERGY DRINKS USING THIN LAYER
CHROMATOGRAPHY-DENSITOMETRY
Florentinus Dika Octa Riswanto
1,*, RR. Endang Lukitaningsih
2, and Sudibyo Martono
2 1Faculty of Pharmacy, Sanata Dharma University, Yogyakarta 55282, Indonesia 2
Faculty of Pharmacy, Universitas Gadjah Mada, Yogyakarta 55281, Indonesia
Received June 3, 2014; Accepted January 30, 2015
ABSTRACT
Food supplement which contains vitamins and stimulants such as caffeine were classified as energy drink. TLC-densitometry method was chosen to determine the pyridoxine, nicotinamide, and caffeine in the energy drink sample. TLC plates of silica gel 60 F254 was used as the stationary phase and methanol : ethyl acetate : ammonia
25% (13:77:10) was used as the mobile phase. The correlation coefficient for each pyridoxine, nicotinamide, and caffeine were 0.9982, 0.9997, and 0.9966, respectively. Detection and quantitation limits of from the three analytes were 4.05 and 13.51 µg/mL; 13.15 and 43.83 µg/mL; 5.43 and 18.11 µg/mL, respectively. The recovery of pyridoxine, nicotinamide, and caffeine were within the required limit range of 95-105%. The percent of RSD were below the limit value of 5.7% for caffeine and nicotinamide and 8% for pyridoxine. The content amount of pyridoxine in the sample 1 and 2 were 33.59 ± 0.981 and 30.29 ± 2.061 µg/mL, respectively. The content amount of nicotinamide in the sample 1 and 2 were 106.53 ± 3.521 and 98.20 ± 3.648 µg/mL, respectively. The content amount of caffeine in the sample 1 and 2 were 249.50 ± 5.080 and 252.80 ± 2.640 µg/mL, respectively. Robustness test results showed that the most optimal method conditions should be applied for the analysis.
Keywords:TLC-densitometry; energy drinks; caffeine; vitamins
ABSTRAK
Suplemen makanan yang mengandung vitamin dan stimulan seperti kafein digolongkan sebagai minuman berenergi. Metode KLT-densitometri dipilih untuk menetapkan kandungan senyawa piridoksin, nikotinamid, dan kafein dalam sampel minuman berenergi. Fase diam yang digunakan adalah lempeng KLT silika gel 60 F254
sedangkan fase gerak yang digunakan adalah campuran metanol : etil asetat : amonia 25% (13:77:10). Koefisien korelasi yang dihasilkan oleh baku pirikdoksin, nikotinamid, dan kafein berturut-turut adalah 0,9982, 0,9997, dan 0,9966. Batas deteksi dan batas kuantitasi dari ketiga analit berturut-turut adalah 4,05 dan 13,51 µg/mL; 13,15 dan 43,83 µg/mL; 5,43 dan 18,11 µg/mL. Nilai persen perolehan kembali piridoksin, nikotinamid, dan kafein berada dalam rentang 95-100%. Nilai persen simpangan baku relatif kafein dan nikotinamid berada di bawah 5,7% untuk sedangkan untuk nikotinamid berada di bawah 8,0%. Konsentrasi piridoksin dalam sampel 1 dan 2 berturut-turut adalah 33,59±0,981 dan 30,2 ±2,061 µg/mL. Konsentrasi nikotinamid dalam sampel 1 dan 2 berturut-turut adalah 106,53±3,521 dan 98,20±3,648 µg/mL. Konsentrasi kafein dalam sampel 1 dan 2 berturut-turut adalah 249,50±5,080 dan 252,80±2,640 µg/mL. Uji ketangguhan metode menunjukkan bahwa analisis harus dilakukan pada kondisi paling optimalnya.
Kata Kunci:KLT-densitometri; minuman berenergi; kafein; vitamin
INTRODUCTION
Active people need more energy to perform their activities. The energy can be obtained either from food or supplements consumed everyday [1-2]. Since 2006 the beverages denominating “energy drinks” and “sport drinks” have gained popularity between active persons due to the attribution of energy-giving properties. Most consumers of supplements tend to prefer energy drinks
over the amount of energy drink consumption is associated with the accurate amount of ingredient information in these supplements. The improvements of toxicity surveillance and regulations of energy drink sales and consumption should be based on appropriate research [4-5]. It is necessary to develop a high-throughput analytical method which should be capable of detecting simultaneously the relevant compounds contained in an energy drink [6].
The previous studies reported the analytical methods to determine compounds contained in energy drink. Determination of caffeine in energy drinks were performed by HPLC/UV [7-9], HPLC/PDA and fluorescence detection [10], microemulsion electrokinetic chromatography [11], mass spectrometry [12], and spectrophotometry UV [13,19]. Determination of vitamin B in energy drinks and multivitamins were performed by HPLC/UV methods [14-17], HPLC with DAD, ELSD, and MS detection [18], and spectrophotometry UV [19]. Determination of caffeine and vitamin B were performed by TLC and HPTLC [6,20-21].
In this study, analytical method validation and determination of pyridoxine, nicotinamide, and caffeine in energy drinks was performed using thin-layer chromatography (TLC)-densitometry method. The purpose of this study was to determine the optimal conditions for TLC-densitometry method; to validate the analytical method for pyridoxine, nicotinamide, and caffeine determination in energy drinks sample simultaneously, quantitatively, and cost effectively.
EXPERIMENTAL SECTION
Materials
Pyridoxine and nicotinamide standard were obtained from PT. Erela, Semarang, Indonesia. Caffeine standard was obtained from PT. Kalbe Farma, Cikarang, Indonesia. Energy drinks of two different brand names were purchased from local market. Methanol, ethyl acetate, and ammonia 25% were purchased from Merck (Germany) and distilled water was purchased from PT. Ikapharmindo Putramas (Indonesia); all solvents were at least of analytical grade or distilled before use. TLC plates of silica gel 60 F254 were also purchased from
Merck.
Instrumentation
Samples and standard solution were applied with anCAMAC Automatic TLC Sampler Linomat 5, with the following settings for 20 tracks per plate: band length, 3.0 mm; track distance, 9 mm; band velocity, 50 nL/s; and first application x axis and y axis were 10.0 and 15.0
mm, respectively. Sample application volumes of 1 μL
for all standards and samples were used. Chromatography was carried out in a 20 × 20 cm flat bottom chamberCAMAGup to a migration distance of 75 mm using methanol-ethyl acetate–ammonia 25% 13:77:10 (v/v/v) as the mobile phase. The chamber was saturated with mobile phase (without filter paper) for 30 min. After development, the plate was dried in a stream of warm air for 2 min. The plate was scanned with the CAMAC TLC Scanner 3 CAT. No. 027.6485 SER. No.160602 slit dimension 6.00x0.10 mm and a scanning speed of 20 mm/s. In absorption mode, pyridoxine, nicotinamide, and caffeine were measured at UV 293, 263, and 274 nm, respectively. All instruments were controlled via the software platform winCats 1.4.4.6337 Planar Chromatography Manager (CAMAG).
Procedure
Standard solution
For the pyridoxine standard stock solution: 50.0 mg of pyridoxine were accurately weighed into a 5 mL volumetric flask, dissolved, and diluted to volume with water. The calibration standard solution of pyridoxine was obtained by transferring 70, 100, 130, 160, 190, dan 220 µL of standard stock solution of pyridoxine into 5 mL volumetric flask for each concentration and dilute to volume with water.
For the nicotinamide standard stock solution: 50.0 mg of nicotinamide were accurately weighed into a 5 mL volumetric flask, dissolved, and diluted to volume with water. The calibration standard solution of nicotinamide was obtained by transferring 75, 125, 175, 225, 275, and 325 µL of standard stock solution of nicotinamide into 5 mL volumetric flask for each concentration and dilute to volume with water.
For the caffeine standard stock solution: 50.0 mg of caffeine were accurately weighed into a 5 mL volumetric flask, dissolved, and diluted to volume with water. The calibration standard solution of caffeine was obtained by transferring 180, 240, 300, 360, 420, and 480 µL of standard stock solution of caffeine into 5 mL volumetric flask for each concentration and dilute to volume with water.
Analytical method validation
The method was validated for selectivity, linearity and range, detection limit, quantitation limit, precision, accuracy, and robustness according to the USP guidelines for validation of analytical methods.
Sample preparation
transferring 3.75 mL of mixed sample into a 5 mL volumetric flask and dilute to volume with water.
RESULT AND DISCUSSION
Determination of the Maximum Absorption
Wavelength
The maximum absorption wavelength of each compound was determined at the beginning of the study by scanning the compounds spots on the TLC plate at 200-400 nm (Fig. 1). The maximum absorption wavelength of pyridoxine, nicotinamide, and caffeine, was 293 nm, 263 nm, and 274 nm, respectively.
Analytical Method Validation
Validation of analytical methods performed in this research includes the following parameters:
Selectivity test
Selectivity test was conducted on both the standard and the sample solution. Selectivity was determined by calculating the resolution value indicates the value of each peak separation of the analytes. Rf values and
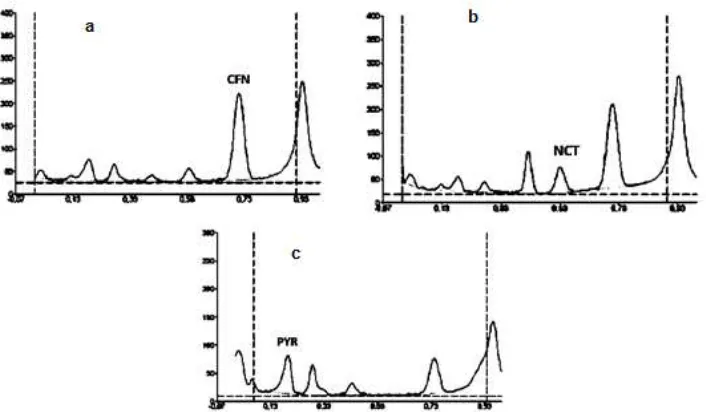
resolution of caffeine, nicotinamide, and pyridoxine in the raw mixture was 0.72 (Rs = 2.0), 0.55 (Rs = 2.0), and 0.18 (Rs = 3.47), respectively, while the sample was 0.71 (Rs = 1.80), 0.53 (Rs = 1.80), and 0.19 (Rs = 1.40), respectively. Fig. 2 was presented the chromatograms of the energy drinks sample. The peaks of the analytes was separated from the others, thus it can be concluded that the developed method is selective for determining caffeine, nicotinamide, and pyridoxine.
Linearity and range
The absorbance data versus concentration of the three analytes were treated by linear correlation coefficient. In the linearity test, calibration curve equation of caffeine, nicotinamide, and pyridoxine was obtained y = 12.5434x + 1460.4352 (r = 0.9966), y = 6.6081x + 120.3904 (r = 0.9997), and y = 10.4417x + 410.0181 (r = 0.9982), respectively. This method is linear in the range of 180–480 µg/mL, 75–325 µg/mL, 70–220 µg/mL, and 70-220 µg/mL for the caffeine, nicotinamide, and pyridoxine, respectively.
Fig 1. Result of the maximum absorption wavelength determination
Table 1.Evaluation of intra-day accuracy and precision (n=3)
Concentration levels Analyte taken(µg/mL) Analyte found(µg/mL) Recovery(%) SD RSD(%) RSD Horwitz(%)
Caffeine 240.0 236.96 98.73 11.03 4.65 7.65
Nicotinamide 125.0 125.63 100.50 5.81 4.62 7.94
Low
Pyridoxine 100.0 92.439 92.44 7.74 8.38 8.00
Caffeine 360.0 375.49 104.30 11.52 3.07 7.34
Nicotinamide 225.0 227.81 101.25 6.19 2.72 7.69
Medium
Pyridoxine 160.0 162.65 101.66 1.47 0.90 7.85
Caffeine 480.0 478.18 99.62 12.04 2.52 7.03
Nicotinamide 325.0 321.38 98.89 3.45 1.07 7.43
High
Pyridoxine 220.0 213.76 97.16 4.00 1.87 7.70
Table 2.Evaluation of inter-day accuracy and precision (n=3)
Concentration levels Analyte taken (µg/mL)
Caffeine 240.0 235.53 98.14 1.89 0.81 7.65
Nicotinamide 125.0 119.06 95.25 4.19 3.52 7.94
Low
Pyridoxine 100.0 98.18 98.18 1.39 1.42 8.00
Caffeine 360.0 363.84 101.07 6.77 1.86 7.34
Nicotinamide 225.0 218.23 96.99 10.07 4.62 7.69
Medium
Pyridoxine 160.0 154.97 96.86 7.59 4.89 7.85
Caffeine 480.0 475.21 99.00 7.30 1.54 7.03
Nicotinamide 325.0 313.46 96.45 4.88 1.56 7.43
High
Pyridoxine 220.0 219.32 99.69 8.03 3.66 7.70
Determination of detection limit and quantitation limit
Detection limit of caffeine, nicotinamide, and pyridoxine was 5.43, 13.15, and 4.05 µg/mL, respectively. Quantitation limit of caffeine, nicotinamide, and pyridoxine was 18.11, 43.83, and 13.51 µg/mL, respectively. The result was obtained by the calculation using standard deviation approach.
Accuracy and precision of standard solution
Determination of standard solution accuracy and precision was assessed using three concentration levels (low, medium, high) and three replicates of each concentration. Subsequently, the recovery and RSD value were calculated.
Intraday evaluation. Intraday evaluation results of caffeine, nicotinamide, and pyridoxine standards in the three concentration levels have a smaller percent RSD value than the Horwitz’s RSD (Table 1) [22]. The required values of percent RSD were accepted except at the low levels of pyridoxine levels (100 µg/mL). These results show that this method produced highly precise determination of caffeine and nicotinamide in all concentration levels. The precision of pyridoxine determination was obtained only at the medium and high concentration levels.
Interday evaluation. Interday evaluation results caffeine, nicotinamide, and pyridoxine standards in the three concentration levels have a smaller percent RSD
than the Horwitz’s RSD (Table 2) [22]. The required values of percent RSD were accepted. These results show that this method produced highly precise determination of caffeine, nicotinamide, and pyridoxine in all concentration levels.
Precision and accuracy test of the samples
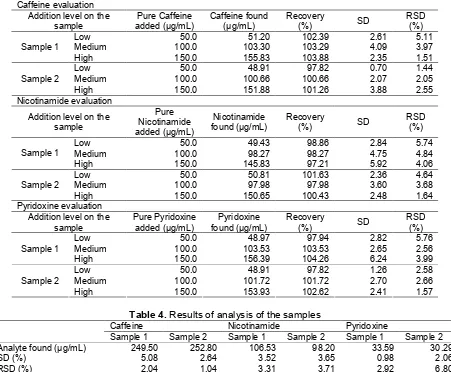
Precision and accuracy of test of samples was performed by the standard addition method. The three levels of addition concentration levels consisted of the low (50 µg/mL), medium (100 µg/mL), and high (150 µg/mL) as shown in Table 3. The mean value of the recovery as the accuracy parameter at three concentration levels of caffeine, nicotinamide, and pyridoxine in both samples are within the required range of 95–105% [22]. Percent RSD as the precision parameter at the three levels of caffeine, nicotinamide, and pyridoxine concentrations in both samples were below the maximum limit of Horwitz’s RSD which is 5.7% for high level and 8% for low and medium levels [22]. These results show that this method, produced highly precision and accuracy for determining caffeine, nicotinamide, and pyridoxine in all concentration levels.
Determination of caffeine, nicotinamide, and pyridoxine in the samples
Tabel 3.Results of recovery study by standard addition method
Caffeine evaluation Addition level on the
sample
Low 50.0 51.20 102.39 2.61 5.11
Medium 100.0 103.30 103.29 4.09 3.97
Sample 1
High 150.0 155.83 103.88 2.35 1.51
Low 50.0 48.91 97.82 0.70 1.44
Medium 100.0 100.66 100.66 2.07 2.05
Sample 2
High 150.0 151.88 101.26 3.88 2.55
Nicotinamide evaluation
Addition level on the sample
Low 50.0 49.43 98.86 2.84 5.74
Medium 100.0 98.27 98.27 4.75 4.84
Sample 1
High 150.0 145.83 97.21 5.92 4.06
Low 50.0 50.81 101.63 2.36 4.64
Medium 100.0 97.98 97.98 3.60 3.68
Sample 2
High 150.0 150.65 100.43 2.48 1.64
Pyridoxine evaluation Addition level on the
sample
Low 50.0 48.97 97.94 2.82 5.76
Medium 100.0 103.53 103.53 2.65 2.56
Sample 1
High 150.0 156.39 104.26 6.24 3.99
Low 50.0 48.91 97.82 1.26 2.58
Medium 100.0 101.72 101.72 2.70 2.66
Sample 2
High 150.0 153.93 102.62 2.41 1.57
Table 4.Results of analysis of the samples
Caffeine Nicotinamide Pyridoxine
Sample 1 Sample 2 Sample 1 Sample 2 Sample 1 Sample 2
Analyte found (µg/mL) 249.50 252.80 106.53 98.20 33.59 30.29
SD (%) 5.08 2.64 3.52 3.65 0.98 2.06
RSD (%) 2.04 1.04 3.31 3.71 2.92 6.80
was 252.80 µg/mL (RSD = 1.04%). Percent RSD obtained on two samples of caffeine was accepted (RSD < 5.7%) according to Horwitz [22]. Nicotinamide concentration in the sample 1 was 106.53 µg/mL (RSD = 3.31%), while the sample 2 was 98.20 µg/mL (RSD = 3.71%). Percent RSD obtained on two samples of caffeine was accepted (RSD < 5.7%) according to Horwitz [22]. Pyridoxine concentration in the sample 1 was 33.59 µg/mL (RSD = 2.92%), while sample 2 was 30.29 µg/mL (RSD = 6.80%). Percent RSD obtained on two samples of caffeine was accepted according to Horwitz (RSD < 5.7% for caffeine and nicotinamide; RSD < 11.3% for pyridoxine).
Robustness test
In this study, the robustness test involves of the usage of re-used mobile phase, the wavelength shift, the shortening of the elution distance, and the variation of the proportion of the mobile phase components.
The effect of using re-use mobile phase. The effect of using re-use mobile phase could be tested by comparing analyte concentration eluted by freshly prepared and re-use mobile phase (Table 5). In the determination of caffeine and nicotinamide using re-use mobile there was no statistical difference between freshly prepared and re-use mobile phase elution at the sample 2 but the difference could be found in sample 1. However the determination of pyridoxine has a statistical difference between freshly prepared and re-use mobile phase elution at the sample 1 and sample 2. Statistical tests performed with T test (two-tailed) using 95% confidence level.
The effect of shifting detection wavelength. Wavelength detection shift test of caffeine was performed at three wavelengths: 272, 274, and 276 nm. The results obtained indicates that in sample 1 there was no differences in response of three wavelengths (Fcalc < 3.60), while in the sample 2
Table 5.Results of robustness test of using re-use mobile phase (n=6)
Sample 1 Sample 2
Re-use mobile phase
Freshly prepared
mobile phase
Re-use mobile phase
Freshly prepared
mobile phase
Caffeine found (µg/mL) 319.79 365.94 352.55 353.46
Tcalc 3.41 0.33
Ttable 2.57 2.57
Statistical difference Yes No
Nicotinamide found (µg/mL) 192.80 204.80 192.78 196.18
Tcalc 2.66 1.49
Ttable 2.57 2.57
Statistical difference Yes No
Pyridoxine found (µg/mL) 180.10 138.72 161.09 132.01
Tcalc 13.87 10.32
Ttable 2.57 2.57
Statistical difference Yes Yes
Fig 3. The effect of shortening the elution distance on the pyridoxine selectivity (a) Elution distance 75 mm (Resolution 1.29), (b) Elution distance 50 mm (Resolution 0.95). Chromatographic conditions: mobile phase, methanol-ethyl acetate–ammonia 25% 13:77:10 (v/v/v); PYR: pyridoxine
and 276 nm. Wavelength detection shift test of nicotinamide was performed at three wavelengths: 261, 263, and 265 nm. The results obtained indicates that not only the sample 1 but also sample 2 have differences in response at the three wavelengths (Fcalc > 3.60).
Wavelength detection shift test of pyridoxine was performed at three wavelengths: 291, 263, and 295 nm. The results obtained indicates that in the sample 1 and sample 2 there were differences in response at wavelengths of 291 and 295 nm compared with the maximum wavelength (293 nm). Statistical test was performed by ANOVA test (two-tailed) using confidence level of 95% followed by Post-Hoc test using Least Significant Difference (LSD) method.
The effect of shortening the elution distance. The effect of shortening the elution distance test was performed by changing elution distance from 75 mm to 50 mm and then two densitogram profiles were compared. The resolutions as well as the selectivity
parameter were calculated. Through this comparison, it can be observed that the shortening of the distance elution still provide a good selectivity in the separation of caffeine and nicotinamide. The unknown peak (peak X) produced by the sample matrix near the peak of pyridoxine has resulted in unsatisfying resolution of pyridoxine at 50 mm elution distance (Fig. 3).
CONCLUSION
Optimization of the TLC-densitometry method for caffeine, nicotinamide, and pyridoxine resulted in a good separation with the usage of stationary phase TLC plates silica gel 60 F254and a mobile phase of methanol :
ethyl acetate : ammonia 25% (13:77:10). Validation data showed that the selectivity, accuracy, precision, linearity, limit of detection, and limit of quantitation of the assay can be applied to quantitatively determine caffeine, nicotinamide, and pyridoxine in the sample of energy drinks. Optimized and validated method of TLC-densitometry can be applied to determine caffeine, nicotinamide, and pyridoxine in samples of energy drinks.
ACKNOWLEDGEMENT
Authors thank PT. Kalbe Farma, Cikarang, Indonesia for gifting standard caffeine and PT. Erela, Semarang, Indonesia for gifting standard nicotinamide and pyridoxine. Authors are grateful to thank the authorities of the Sanata Dharma University and Universitas Gadjah Mada, for permission and facilities.
REFERENCES
1. Putriastuti, R., Kustiyah, L., dan Anwar, F., 2007,J. Nutr. Food, 2(3), 13–25.
2. Sasangka, A., 2010, Analisis Faktor-Faktor yang Mempengaruhi Keputusan Konsumen dalam Pembelian Minuman Energi, Skripsi, Universitas Diponegoro.
3. Salinero, J.J., Lara, B., Abian-Vicen, J., Gonzalez-Millán, C., Areces, F., Gallo-Salazar, C., Ruiz-Vicente, D., and Del Coso, J., 2014, Br. J. Nutr., 112(9), 1494–1502.
4. Seifert, S.M., Schaechter, J.L., Hershorin, E.R., and Lipshultz, S.E., 2011,Pediatrics, 127(3), 511–528. 5. Babu, K.M., Church, R.J., and Lewander, W., 2008,
Clin. Pediatr. Emergency Med., 9(1), 35–42.
6. Aranda, M., and Morlock, G., 2006,J. Chromatogr. A, 1131(1-2), 253–260.
7. Srdjenovic, B., Djordjevic-Milic, V., Grujic, N., Injac, R., and Lepojevic, Z., 2008, J. Chromatogr. Sci., 46(2), 144–149.
8. Leacock, R.E., Stankus, J.J., and Davis, J.M., 2011,J. Chem. Educ., 88(2), 232–234.
9. Sather, K., and Vernig, T., 2011,CCJAC, 2, 84–91.
10. Gliszczyńska-Świgło, A., and Rybicka, I., 2014,
Food Anal. Methods, 1936-976X, doi:10.1007/s12161-014-9880-0
11. Liotta, E., Gottardo, R., Seri, C., Rimondo, C., Miksik, I., Serpelloni, G., and Tagliaro, F., 2012,
Forensic Sci. Int., 220(1-3), 279–283.
12. Grant, D.C., and Helleur, R.J., 2008,Anal. Bioanal. Chem., 391(8), 2811–2818.
13. Amos-Tautua, B.M.W., and Diepreye, E.R.E., 2014,Adv. J. Food Sci. Technol., 6(2), 155–158. 14. Aslam, J., Mohajir, M.S., Khan, S.A., and Khan,
A.Q., 2008,Afr. J. Biotechnol., 7(14), 2310–2314. 15. Gavriliuc, O.I., and Ostafe, V., 2006, Series
Chemistry, 15(1), 91–102.
16. Amidžić, R., Brboric, J., Čudina, O., and
Vladimirov, S., 2005,J. Serb. Chem. Soc., 70(10), 1229–1235.
17. Ekinci, R., and Kadakal, Ç., 2005, Acta Chromatogr., 15, 289-297.
18. Huang, H., 2013, Analyses of Multivitamins in Nutraceuticals By Reverse Phase HPLC With DAD, ELSD and MS,Thesis, Clemson University.
19. Pieszko, C., Baranowska, I., and Flores, A., 2010,
J. Anal. Chem., 65(12), 1228–1234.
20. Ponder, E.L., Fried, B., and Sherma, J., 2004,Acta Chromatogr., 14, 70–81.
21. Urgessa, B., 2008, HPTLC-Densitometric Determination of Some Water Soluble Vitamins Present in Pharmaceuticals, Thesis, M.Sc., Addis Ababa University.