QUALITATIVE STUDY ON SERVICE QUALITY OF PT (X)
PENELITIAN KUALITATIF TERHADAP KUALITAS PELAYANAN PT (X)
Abdulrahman Suratinoyo
International Business Administration (IBA), Management Program,
Economics and Business Faculty, Sam Ratulangi University, Manado 95115, Indonesia Email: [email protected]
ABSTRACT
This study aims to find out what is the service quality of PT (X) Manado from the customer perspective. This study used stratified random sampling method to ensure that the sample was systematically representative as population frame as the researcher need which are 8 different occupations. This study used generic qualitative inquiry approach by using structured interview as data collection method so enable the interviewer to ask each respondent the same questions in the same way. Structured interview
was used to find out respondent’s perceptions and expectations on the service quality of PT (X). The result indicates that all of the five dimensions of service quality performed poorly. Furthermore, the service quality had a negative impact on customer satisfaction and concludes that the service quality deserves improvement.
Keywords: Service Quality, Customer Perception, Customer Expectation, Customer Gap.
ABSTRAK
Penelitian ini mencoba untuk mencari tahu kualitas pelayanan PT (X) dari perspektif pelanggan. Penelitian ini menggunakan metode stratified random sampling untuk memastikan bahwa sampel adalah sistematis representatif dari bingkai populasi sesuai kebutuhan peneliti yang terdiri dari 8 pekerjaan yang berbeda. Penelitian ini menggunakan pendekatan generic qualitative inquiry dengan menggunakan wawancara terstruktur sebagai metode pengumpulan data sehingga memungkinkan pewawancara untuk meminta setiap responden pertanyaan yang sama dengan cara yang sama. Wawancara terstruktur digunakan untuk mengetahui persepsi dan harapan pada kualitas pelayanan PT (X) responden. Hasil penelitian menunjukkan bahwa semua dari lima dimensi kualitas pelayanan dilakukan dengan buruk. Selain itu, kualitas layanan memiliki dampak negatif pada kepuasan pelanggan dan menyimpulkan bahwa kualitas layanan layak perbaikan.
1.
INTRODUCTION
Research Background
In this Modern era, electricity is a basic requirement for human life. Human dependence of electricity occurred because the electricity is very flexible energy where it can converted easily into another form, to move industrial equipment, household, and so on. In Indonesia, PT (X) has responsibility to provide the electricity to Indonesian people. PT (X) is part of BUMN (states-owned enterprises). Nowadays, The BUMN companies are shapes their efforts in improving their service quality, Because they are aware in the middle of the market that increasingly open, satisfy the customer is one key to success. Service is considered satisfactory if it can meet the needs and customer expectations, it is why customer satisfaction is very important factor in developing a service system.
PT (X) has responsible as the electricity provider in Manado and has the duty to serve and satisfy its customers. This research is going to reveal how much needs and wants of customers are fulfilled by the service quality given by PT (X), how big the gap between the expectation and the perception by the customers. That’s why it is important to know the service quality of PT (X). Therefore, the researcher is interested to conduct the qualitative research on service quality of PT (X).
Research Objective
In order to reach the answer of the research problem there is a thing the researcher needs to find out the service quality performance of PT (X).
Theoretical Framework
Marketing
Marketing is the process by which companies create value for customers and build strong customer relationships in order to capture value from customers in return. (Kotler et al., 2012)
Service
Services are a form of product that consist of activities, benefits, or satisfactions offered for sale that are essentially intangible, and do not result in the ownership of anything. (Kotler et al., 2012).
Service Quality
Zeithaml and Bitner (2003) mentioned that “service quality is a focused evaluation that reflects the customer’s perception of specific dimensions of service namely reliability, responsiveness, assurance, empathy, and tangible.
Role of Electricity
Customer Satisfaction
Feeling happy or disappointed by someone who emerged after comparing the performance (yield) of products considered the expected performance (Kotler, 2005). Meanwhile, according to Sumarwan (2003), Costumers satisfaction is the result of a comparison between expectations of costumers prior to purchase by the costumer actually obtained from the products purchased. Basically the goal of a business is to creating the costumers are satisfied. Creation of customer satisfaction can provide several benefits, including the relationship between the company and consumers become harmonious, provide a good foundation for repeat purchases and creation of customer loyalty, and form a recommendation from the mouth to mouth profitable company.
Customer Expectation
It is now widely accepted that exceeding customer expectations is key to customer satisfaction, delight, and loyalty (Kotler, 2000). Accordingly, it is critical for marketers to try to find out in advance what their customers’ expectations are, because a failure to meet or exceed those expectations could lead to dissatisfaction and defection.
Customer Perception
Perceptions are always considered in relation to expectations (Zeithaml, Bitner and Gremler, 2009). Perceptions are formed through customers’ assessment of the quality of service provided by a company and whether they are satisfied with the overall service (Zeithaml and Bitner, 2003). (Zeithaml, Bitner and Gremler, 2009) Zeithaml and Bitner (2003) argue that because perceptions may shift over time and therefore it is necessary for companies to continually assess customer perceptions (Zeithaml and Bitner, 2003).
Customer Gap
Zeitahml, et al. (2010) mentioned that the customer gap is the heart of the gaps model. It represents the difference between customer expectations and perceptions of service performance. The model suggests that closing this gap by matching or exceeding customer expectations will result in the achievement of service quality from the customer’s perspectives. In the years since the introduction of the model, there has been significant focus on both customer expectations and perceptions in terms of conceptualizing these constructs, developing measures for them, and studying their effects.
Previous Resesarch
Achchuthan, Sivathaasan and Jayasundara (2014), Service Quality Dimensions of Electricity Services: Evidence from Electricity Board in Sri Lanka. This study tries to develop an empirical model of service quality in terms of electricity services that may form a basis for a better understanding of its determinants. Specifically, it's aimed to identify the dimensions of service quality of electricity services provided by the Ceylon Electricity Board located in Badulla District. Results revealed that dimensions extracted from the analysis accounted for 62.899 percent of the total variance. While the study limits to the electricity services provided by the public sector organization based in Badulla district, the findings introduce the dimensions of service quality for electricity services, which may be a base for other scholars.
For managers, this finding has important implications with regard to brand building strategies. Indications of a successful brand building strategy are found when companies provide quality services relative to other companies within the same industry. It is imperative for Vodafone (Ghana) and other telecom firms, therefore, to improve customer services by giving customers what they want and at the right time. Thus, identifying and satisfying customers’ needs could improve network services because what is offered can be used to separate the company’s services from competitors’.
Arthur, Sekyere, Kantanubahmarlle, and Banuenumah (2016), The Impact of Service Quality on Customer Satisfaction in Obuasi Electricity Company of Ghana (ECG) – The Customers Perspective. The result indicates that all the five dimensions of service quality performed poorly P >0.05. Furthermore the service quality had a negative impact on customer satisfaction and concludes that the service quality deserves improvement. The study finally recommends that staff should be engaged on regular basis to be trained on issues of costumer services and its effects on organizational performance. Further studies on SERVQUAL model using the five service quality dimensions can gradually close the gaps to bring success to the ECG.
Conceptual Framework
Figure 1. Conceptual Framework Source: Literature Reviews, 2016
2.
RESEARCH METHOD
Type of Research
This research use qualitative research methods that will describe and investigate the phenomenon that happened related with the title and purpose of the research that is to find out what is service quality of PT (X).
Place and Time Research
This research conducted in around Manado City which covered by PT (X) started from June 2016 to September 2016.
Research Procedure
This research used the steps explained by Chenail (2011) which is “ten steps to conduct a
qualitative research.” Choose the topic; identify the problem; specify the topic focus; compose
research questions; define research objectives; literature review; develop research design; conduct self-assessment; plan, conduct and manage the research; compose and submit the research.
Population
The population that mainly observed in this research is all the electricity users in Manado City, because they are the people which consume electricity directly or indirectly which means they
Service Quality
are also the customers of PT. (X) who has the responsibility as the supplier of the electricity. According to BPS Kota Manado total population of Manado City are 423,358 people.
Sample
Researcher wanted to ensure that the sample was representative of the population frame, this is the reason why researchers rely on sampling techniques and employ stratified random sampling method. From those 423,358 people, researcher sorted them to 15 years old and above, because in order to make the population into smaller group the researcher wanted to divided them in to 8 occupations, and found that only 15 years old and above were encompassed all of the 8 occupations, and besides that, researcher also assumed that the population of 15 years old and above are responsible enough about their answers as respondents later. Researcher got 321,580 (76%) as the total population needed. From the 76% of the total population, researcher split the population into the different occupations, in this case, separating out those individuals with the relevant background into 8 occupations which are Medical Personnel, Police officers, Students, Retailer, Labor, Teacher, Private sectors, Housewifery. Researcher divides each of occupations by 5 samples, so total samples are 40, then randomly choosing the sample to each occupation separately giving the questionnaire.
Data Collection Method
Data Collection Method in this research used primary data which is obtained from structured interview and also secondary data which is obtained from PT (X), internet, and several types of document like books and journals.
Operational Definition of Research Variable
Service quality was measured by using the variables in SERVQUAL model (Parasuraman, Zeithmal and Berry, 1988; Ndubisi, Chan, and Chukwunonso, 2004). In using the SERVQUAL instrument, 15 statements measured the service quality across these elements, using 5 points Likert scale. The factors in the model were measured as follows:
1. Tangibility: Appearances of physical facilities, equipment, personnel.
2. Reliability: Ability to perform the promised service dependably and accurately. 3. Responsiveness: Willingness to help customers and provide prompt service. 4. Assurance: The ability to inspire trust and confidence..
5. Empathy: Individual attention to show to the customers that the company does best to satisfy their needs.
Measurement of Research Variable
Researcher has spreads questionnaires that consists of 15 questions based on the service quality dimensions (tangibility, reliability, responsiveness, assurance, empathy) of PT (X). In order to avoid inequality, each of dimensions has 3 questions. Researcher intends to find out the gap between customers perceptions and expectations that’s why the questionnaire’s answer selection divide into two parts, perception and expectation. The questionnaire’s calculation used 5 Likert scale. Besides giving the questionnaires, researcher also opened for any additional opinions from the customer regarding the service quality of PT (X). The opinions collected are summarized in a note.
Data Analysis Method
1. Data Reduction; It means summarizing, choose things that are basic, focusing on things that are important, look for themes and patterns. Thus the reduced data will provide a clearer picture, and facilitate researchers to conduct further data collection, and look for it when necessary.
2. Data Display; It can be done in the form of brief descriptions, charts, relations between categories, flowchart, etc. Display data will make it easier to understand what has happened, to plan further work based on what has been understood. Beside by narrative text, it can also be in a graphic, matrix, network, and chart.
3. Conclusion Drawing/Verification; Conclusion in this case is a new finding that had not been there before. the findings could be a description or picture of an object that previously were dim or dark so that after investigation it became clear, it can be a causal relationship or interactive, hypothesis, or theory.
Validity and Reliability Test
In qualitative research is important to prove that all the result that explain and discuss in this research is true and has credibility. In the qualitative research, some have doubted the researcher of qualitative research because the low of reliability, lack of generalizability and the data resources are illogical. To check the validity of the research, it needs:
1. Credibility: to describe or understand the phenomena of interest from the participants are the only ones who can legitimately judge the credibility of the results.
2. Transferability: it is the extent to which the irrelevant in qualitative research because the researcher wants to describe the particular phenomenon.
3. Dependability: to describe and confirm the research affected with the researcher.
4. Confirmability: to conclude and interpreted directly about the data to established the decision trial between credibility, transferability, and dependability.
3.
RESULT AND DISCUSSION
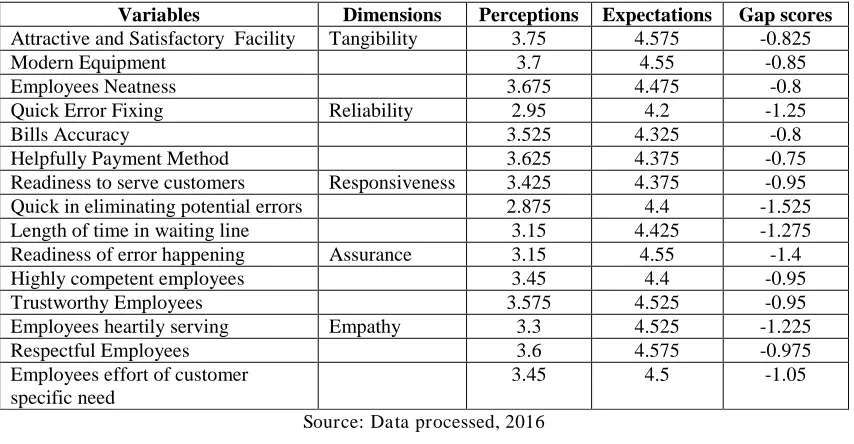
The following is table 1 which indicates the composite scores from a total 40 respondents who shared their thought on their expectations and perceptions about service quality of PT (X). The table comprises of average mean scores of Perceptions, expectations and the gap scores as against the service quality dimensions (tangibility, reliability, responsiveness, assurance, empathy).
Table 1. Expectation and Perception Gap
Variables Dimensions Perceptions Expectations Gap scores
Attractive and Satisfactory Facility Tangibility 3.75 4.575 -0.825
Modern Equipment 3.7 4.55 -0.85
Employees Neatness 3.675 4.475 -0.8
Quick Error Fixing Reliability 2.95 4.2 -1.25
Bills Accuracy 3.525 4.325 -0.8
Helpfully Payment Method 3.625 4.375 -0.75
Readiness to serve customers Responsiveness 3.425 4.375 -0.95
Quick in eliminating potential errors 2.875 4.4 -1.525
Length of time in waiting line 3.15 4.425 -1.275
Readiness of error happening Assurance 3.15 4.55 -1.4
Highly competent employees 3.45 4.4 -0.95
Trustworthy Employees 3.575 4.525 -0.95
Employees heartily serving Empathy 3.3 4.525 -1.225
Respectful Employees 3.6 4.575 -0.975
Employees effort of customer specific need
3.45 4.5 -1.05
As demonstrated in table 1 are the perceptions and expectations of customers of PT (X) on 15 questions for perception and expectation answered by 40 respondents. The mean values of expectation and perception have been summarized in table 1.
Table 2. Total Score of Expectation and Perception of the Service Quality Dimensions
Service Quality
Presented in the table 2 are respondent’s average mean ratings of perceptions on the entire service quality dimension with Tangibility (3.71) ranked highest than the others, followed closely by Empathy (3.45), Assurance (3.39), Reliability (3.37) and Responsiveness (3.15). Furthermore, the respondents ranked Tangibility (4.53) as the highly perceived service quality dimension, followed by Empathy (4.53), Assurance (4.49), Responsiveness (4.40) and Reliability (4.30). The smallest gap of the entire service quality dimension were created by both Tangibility (-0.83) and Reliability (-0.93), followed by Empathy (-1.08), Assurance (-1.10) and Responsiveness (-1.25). Therefore, the average gap score difference between Perception and Expectation is -1.04. From table 2 the means expectation of the respondents who answered the questionnaires indicate that expectations had the highest mean scores for the five service quality dimension as well as the individual items. On the contrary, the average scores of customers that responded to the questionnaires graded perception as lowest mean score for the five service quality dimensions and all the service quality items as in Table 4.3. Consequently, the gaps scores between expectation and perception is negative which signifies that expectation was higher than perception which obviously means that consumer are not happy with the service quality at PT (X)
The findings of this studies suggested the most rated service quality at PT (X) is Tangibility. Table 4.3 indicates that the mean score on tangibility produce a perception score of 3.71 and expectation score of 4.53. This means that when customer expectation is higher than the perceived service provided, consumers are not happy with the performance of the service providers. In addition to giving questionnaires, researcher also opened for any opinions from the respondents regarding the service quality of PT (X). The opinions from the respondents were summarized in a note. According to the opinions that researcher summarized in a note, respondents were added their experiences. Gronroos (1984) defined “service quality as the outcome of an evaluation process, where the consumer compares his expectations with the service he perceives he has received.” And according to Bitner and Hubbert, 1994 mentioned that customer satisfaction is “customer's overall impression of the relative inferiority/superiority of the organization and its services”
consistent delivery of superior service is the strategy that is increasingly being offered as a key to service providers to position themselves more effectively in the market place.” (Brown and Swartz, 1989).
According to the opinions states by the respondents, the most outstanding thing for them was the blackout/ electricity outage. Respondents stated that usually the electricity outages were happen suddenly, that made the respondents disappointed. Respondents mentioned that the electricity outages disturb their daily activities, it make them to feel uncomfortable in doing their daily activities. The researcher assumed that the disappointed by respondents were happened because the lack of initiatives by the services given and were happened due to inconsistent delivery of superior service, according to Sachdev et al., (2004) “customer service initiatives are closely related to quality improvement initiatives,” and Brown and Swartz (1989) reported that “the consistent delivery of superior service is the strategy that is increasingly being offered as a key to service providers to position themselves more effectively in the market place.” Respondents also adding that sometime the blackout happened while using electronics (e.g. Computers, washing machine, rice cooker, TV, Air conditioner, iron, etc), and it could damage the electronics or the worst is shorting. According to Meredith (2011) mentioned that “damage to your valuable electronics can occur when the power comes back on. The sudden surge of electricity could destroy the inner mechanisms of computers and other electronic equipment.”
4.
CONCLUSION AND RECOMMENDATION
Conclusion
The purpose of this study is to find out what is the service quality of PT (X) from a customer perspective. The researcher intend to find out what is the perception and expectation by the customer, that’s why the researcher conduct a structured interview to give the same questions for the each respondents which distributes some questionnaires to the customers, with 5 Likert scale the researcher tabulates them to find the gap scores between perception and expectation by the customers. On the basis of the results obtained in the study the following conclusions were reached: The objective of the most rated service quality at PT (X) was Tangibility. Even though, customers rated tangibility higher than any of the service quality dimensions yet they were not satisfied with the provider’s physical appearances facilities, equipment, and personnel. The overall gap between perception and expectation suggest that customers are not happy with all the service provided for the five service quality dimension. Responsiveness is the service quality with largest gap. Also, tangible were the only dimensions with the smallest gap. It does not matter how small or large the gap, if the customer’s expectation is always higher, then it would produce bad word of mouth, poor past experience. Therefore, closing all customer gaps to zero brings success. Service quality of PT (X) is indirectly/ inversely proportional to customer satisfaction. The results indicate that the higher customer satisfaction, the lower the service quality provided or when customer satisfaction is low, the service quality is high. This means that the customers are always happy no matter the kind of service provided. On the other hand, customers are not satisfied no matter the quality of service provided.
Recommendation
automatically change the view of the customer. After that, it will be easier for them to attract customer and by the time they slowly improve their service dimensions customer will be happier. Therefore, future studies under this material should identify the gap created between 2 different areas of PT (X) to breach the differences, and hopefully can gradually close the gaps to bring success to PT (X).
REFERENCES
Papers in Journals
[1] Achchuthan, S., Sivathaasan, N., & Jayasundara, J. M. R. S. (2014). Service Quality Dimensions of Electricity Services: Evidence from Electricity Board in Sri Lanka. Canadian Center of Science and Education, Vol. 10, No. 17, pp. 194-203.
[2] Agyapong, G.K.Q. (2011). The Effect of Service Quality on Customer Satisfaction in the Utility Industry – A Case of Vodavone (Ghana), International Journal of Business and Management, Vol. 6, No. 5, pp. 203-210.
[3] Arthur, Y. D., Sekyere, F., Kantanubahmarlle, E., Banuenumah, W. (2016). The Impact of Sercvice Quality on Customer Satisfaction in Obuasi Electricity Company of Ghana (ECG) – The customers perspective, International Journal of Contemporary Applied Sciences (ISSN:2308-1365), Vol. 3, No. 3, pp. 247- 261.
[4] Brown, S.W., & Swartz, T.A. (1989). A gap analysis of professional service quality. Journal of Marketing, Vol. 53 (April), pp. 92-98.
[5] Chenail, R. J. (2011). Ten Steps for Conceptualizing and Conducting Qualitative Research Studies in a Pragmatically Curious Manner. The Qualitative Report, 16(6), 1715-1732. [6] Grönroos, Christian (1984). A Service Quality Model and Its Marketing Implications.
European Journal of Marketing, 18(4), 36-45.
[7] Meredith.L. (2011). Protect Your Electronics From Power Outage Damage. Retrieved from www.nbcnews.com/id/44280851/. Accesed on September 19th 2016.
[8] Ndubisi, N.O., Chan, K.W., & Chukwunonso, N.C. (2004). Evaluating relationship marketing strategies and customer loyalty. International Logistics Congress Proceeding, 11, Izmir. [9] Parasuraman, Zeithaml and Berry. (1988). SERVQUAL: A Multiple-Item Scale for
Measuring Customer Perceptions of Service Quality. Journal of Retailing, pp. 12- 40. [10] Parasuraman, A., Leonard L. Berry, and Valarie A. Zeithaml (1991). Refinement and
Reassessment of the SERVQUAL scale. Journal of Retailing, 67, 420-450
[11] Sachdev, S. B., and Verma, H. V. 2004. Relative importance of service quality. Journal of Services Research 4(1): 93-116.
[12] Velasquez, J. R. C., & Pichler, B. (2010). China’s increasing economy and the impacts on its energy. Estudios Gerenciales, 26(117), 131-143.
[13] Zeitahml, V.A., Bitner, M.J., & Gremler, D.E. (2010). Service Marketing Strategy. In Wiley International Encyclopedia of Marketing: Marketing Strategy, Vol. 1, Robert A. Peterson and Roger A. Kerin, eds. Chichester, UK: John Wiley & Sons, 208-218.
Books
[14] Bitner, M-J and Hubbert A,R., (1994). Encounter Satisfaction Versus Overall Satisfaction Versus Service Quality: The Consumer’s Voice. In Rust, Roland .T. and Oliver Richard L., (eds), Service Quality: New Directions in Theory and Practice, Sage Publications, Thousand Oaks, USA, 72-94.
[15] Christopher and Ballantyne (1991). The Essence of Service Marketing. In Payne, Adrian. (eds), Prentice – Hall International (UK) Ltd.
[17] Kotler, Philip. Alih Bahasa : Benyamin Molan. 2005. Manajemen Pemasaran. Edisi Kesebelas. Jilid 1. PT. Intan Sejati Klaten. Jakarta.
[18] Kotler,P., Armstrong,G., Ang S,H., Leong S,M., Tan C,T., & Yau H,M,O. (2012). Principles of Marketing an Asian Perspective. Pearson Education South Asia Pte Ltd.
[19] Miles, Mathew B., & Michael Huberman. (1984). Qualitative Data Analysis: A Sourcebook of New Methods. Kondon: Sage Publication, Inc.
[20] Sumarwan, U. (2003). Perilaku Konsumen Teori dan Penerapannya Dalam Pemasaran. Jakarta: Ghalia Indonesia.
[21] Zeithaml, V. A., Bitner, M. J. 2003, Service Marketing (3rd ed.), Tata McGraw Hill, New Delhi.