191
Soegiharto—What Drives the Payment of Higher Merger Premiums? Gadjah Mada International Journal of Business
May-August 2009, Vol. 11, No. 2, pp. 191–228
WHAT DRIVES THE PAYMENT
OF HIGHER MERGER PREMIUMS?
Soegiharto
STIE YKPN, Yogyakarta, Indonesia
This study examines whether the premiums paid to targets firms are affected by bidder CEO overconfidence, merger waves, method of payment, industry of merged firms, and capital liquidity. Using merger data for the period spanning from 1991 to 2000, this study finds that CEOs pay less premiums in cash mergers and pay more premiums for mergers undertaken during the year of high capital liquidity. Moreover, the findings also demonstrate that CEOs tend to pay higher merger premiums for mergers that occur during merger waves and in high capital liquidity year. CEOs’ behavior, which is the main variable examined in this study, does not show any significant effect on the premiums paid. This suggests that the effect of CEO overconfidence on the premiums paid may be exaggerated.
Introduction
Premium is the key statement by a bidder CEO of how much extra value he or she can get from a target firm, and it underlines the bidder CEO’s confi-dence that the target’s stock price in-adequately reflects the value of the firm’s resources and prospects. More-over, premium is important not only as a statement of pricing and the bidder’s expectation, but also because it affects the ultimate merger performance and can materially alter firm size. A study by Roll (1986) indicates that the amount of premiums paid to targets is affected by bidders CEOs’ overconfidence (hu-bris). His hubris hypothesis suggests bidder managers engage in mergers and acquisitions with an overly opti-mistic opinion of their abilities to cre-ate value, and this results in paying higher premiums to targets. In addi-tion, the result of Hayward and Hambrick’s (1997) study suggests that CEO hubris, manifested as exagger-ated pride or self-confidence, plays a substantial role in the merger process, particularly in the decision of how much to pay. Other studies (e.g., Hietala et al. 2003; Morck et al. 1990; Shleifer and Vishny 1989) also indicate that bidders tend to pay higher premium to target firms, which are reflected in their negative stock returns during take-over announcements.
This study argues that premiums paid to target firms are affected by other key factors in addition to CEOs’ behavior, such as the timing of merg-ers, the industry of merged firms, and
the method of payment used to com-plete mergers. It is well documented that merger activity occurs in waves (e.g., Andrade et al. 2001; Harford 2005). During merger waves, bidder CEOs may pay higher premiums as there may be a potential competition amongst bidders. CEOs of bidders that acquire targets from a different indus-try may also pay higher premiums since they may overestimate the value of mergers due to their lack of experi-ences, capabilities, and knowledge of targets’ businesses. CEOs of stock mergers may also pay higher premi-ums when they believe their stocks are overvalued.
193
Soegiharto—What Drives the Payment of Higher Merger Premiums? The outline of this paper is as
follows. Literature review and predic-tions are presented in Secpredic-tions 2 and 3, respectively. Section 4 describes data and methodology employed, and Sec-tion 5 presents and discusses the re-sults of this study. Section 5 concludes the study.
Literature Review
The final price paid for a merger or acquisition, especially a large one, is determined by the top management coup in conjunction with its principal advisers (Haspeslagh and Jemison 1991). While final pricing of major mergers and acquisitions requires ap-proval of the board of directors, boards rely heavily on guidance from top management (Mace 1971). Within the top management group, the CEO is pivotal in approving bid premiums in large mergers and acquisitions. Since large mergers and acquisitions are in-variably highly visible events, require high-level negotiations, involve major corporate outlays, and can materially alter firm size and future performance, the bidder CEOs will be extensively involved (Haspeslagh and Jemison 1991). In determining the amount of merger premiums, CEOs may be af-fected by such factors as their behav-ior, merger timing, method of pay-ment, and industry of merged firms, which are discussed in the four follow-ing subsections.
CEO Overconfidence
ostensibly substitutes the target’s in-cumbent management with himself is likely to feel the fantasy of control over the outcome and to underestimate the likelihood of ultimate failure (Langer 1975; March and Shapira 1987). Individuals may also be espe-cially overconfident concerning out-comes to which they are highly com-mitted (Weinstein 1980). The CEO’s current professional standing and his or her future employment prospects may considerably increase if he or she conducts a merger successfully.
A study by Hayward and Hambrick (1997) investigates the sources of CEO hubris and examines the effect of hubris on premiums paid. They find that three indicators of hu-bris they employ —the firm’s recent success, current media praise for the CEO, and self-importance of the CEO— are highly associated with the size of premiums paid in acquisitions. They also state that exaggerated self-confidence contributes to the overall CEO hubris. A later study by Malmendier and Tate (2003) employs particular measures as proxies for over-confidence to test the hubris hypoth-esis. They analyze the impact of the CEO overconfidence on mergers and acquisitions, and argue that overconfi-dent CEOs overestimate their abilities to generate returns both in their cur-rent firms and in potential targets of takeover. They find that the market reacts negatively to takeover bids and that this effect is significantly stronger for overconfident CEOs. As bidder CEOs may have different behavior
(overconfident or less overconfident) in undertaking mergers, there may be a difference in premiums paid by over-confident or less overover-confident CEOs to target firms.
Merger Waves
195
Soegiharto—What Drives the Payment of Higher Merger Premiums? key driver of merger activity. Harford’s
(2005) findings support a neoclassical explanation for merger waves, show-ing that merger waves occur in re-sponse to specific industry shocks that require large-scale reallocation of as-sets. His interpretation of neoclassical theory provides a plausible explana-tion for shocks as the driver of industry merger waves.
On the other hand, Shleifer and Vishny (2003) and Rhodes-Kropf and Viswanathan (2004) claim that waves are triggered by stock market over-valuation. Several studies, including Ang and Cheng (2003), Dong et al. (2002), and Rhodes-Kropf et al. (2004), have empirically examined market misvaluation theory. Those three stud-ies find that the merger waves occur when market valuations are high rela-tive to “true” valuations. In addition, Rhodes-Kropf et al. (2004) note that their results are not only consistent with the behavioral mispricing theory but also with the interpretation that merger activity spikes when growth opportunities are high or when firm-specific discount rates are low. This latter interpretation is similar to the neoclassical hypothesis with a capital liquidity component. While a large body of research has examined the determinants of merger waves, rela-tively little is known about how the establishment of merger premiums depends on the effects of merger waves. As mergers may or may not occur during merger waves, there may be a difference in premiums paid to targets.
Industry of Merged Firms
The issue of choice between di-versification and specialization in cor-porate business activity has become the centre of large body of corporate finance literature for years. The em-pirical evidence generally suggests that the value of the sum of diversified firms is lower than that of focused firms, and that diversification destroys value. This can be explained by many studies which suggest that managing a diversified firm may be relatively more difficult than managing a focused firm and, therefore, a manager with higher ability is required (e.g., Finkelstein and Hambrick 1989; Rose and Shepard 1997).
Method of Payment
Several studies, e.g., Asquith and Mullins (1986), Masulis and Korwar (1986), and Mikkelson and Partch (1986), find that the average market reaction to the announcements of merg-ers and acquisitions financed with stocks is significantly negative. Simi-larly, Travlos (1987) reports empirical evidence consistent with this notion. He finds that the announcement-pe-riod average abnormal stock returns to bidders in stock mergers are signifi-cantly negative, while the correspond-ing bidders’ performance in cash merg-ers is zero or positive. Moreover, some other studies, such as Servaes (1991) and Franks, Harris, and Titman (1991), also document that the use of stocks instead of cash to finance mergers by bidding firms results in significantly more negative returns to the firms. These findings are consistent with the signalling hypothesis. Particularly, it implies that the use of stocks as the method of payment contains negative information that the bidder is overval-ued, and also signals to the market that the CEO of the bidding firm believes that his or her firm’s stock is overval-ued. This is also consistent with the argument of Myers and Majluf (1984), which indicates that the prevalence of information asymmetry between man-agers and shareholders may induce managers to issue stocks when they perceive them to be overvalued. In the context of acquisitions, the theory of Myers and Majluf (1984) implies that
acquiring firms prefer to pay for merg-ers and acquisitions with stocks when they are overvalued and cash when the stocks are undervalued. As their stocks are overvalued, it is more likely for them to pay higher merger premiums.
Empirical Predictions
197
Soegiharto—What Drives the Payment of Higher Merger Premiums? Bidders tend to use stocks to
fi-nance mergers when they believe their stocks are overvalued. As their stocks are overvalued, they are more readily available to pay higher premiums to target firms. In addition, the bid premi-ums paid to the targets may be higher when capital liquidity is high. As the transaction costs are low (when the capital liquidity is high), the bidder CEOs may be more willing to pay more premiums to complete merger transactions.
CEOs with better pre-merger per-formance may believe that their mana-gerial ability to run their firms suc-cessfully can be applied to firms they acquire. As they may also believe the acquired firm’s prospect will be better in their hands and more benefits they can bring to the firm, the higher the premium they pay. It is also believed that CEOs with high level of free cash flows and low level of leverage will pay higher mergers premiums.
Kesner and Sebora (1994) argue that a CEO is the agent who is eventu-ally responsible for actions on and reactions to the organization’s strat-egy, design, performance, and envi-ronment Moreover, the CEO defines the policies and strategies of the firm for a substantial period of time. For a CEO with long tenure, the board should have already obtained almost all infor-mation needed on him or her, and the CEO should have already proven his or her skills in both good and bad times. As a result, as his or her tenure gets longer, he or she might have more control on the firm and stronger
influ-ence on the board. With this power in hands, CEOs tend to act not for the interest of shareholders and may de-stroy the values of mergers they under-take by paying higher premiums to target firms in order to complete merg-ers, which may be a part of his or her organizational strategy. On the other hand, since a merger typically results in a decrease in the acquirer’s stock price, it follows that CEOs with more equity or whose pays are more heavily weighted towards equity-based incen-tives might be less likely to make merg-ers and acquisitions or they may at-tempt not to overpay the target firms. Therefore, CEOs with high stock own-erships may have an interest aligned with that of shareholders. For this rea-son they may pay “fair” premiums in mergers they conduct.
Based on the arguments presented above, it is predicted that:
1. The bid premium paid by an over-confident CEO is higher than that paid by a less overconfident CEO, and the payment of this premium is also higher for in-wave merger, cross-industry merger, stock merger, and merger undertaken fol-lowing a high liquidity year than for non-wave merger, within in-dustry merger, cash merger, and merger undertaken following a low liquidity year, respectively. 2. An overconfident CEO is more
3. An overconfident CEO is more likely to pay a higher premium than a less overconfident CEO for a merger undertaken during merger waves and outside the waves. 4. An overconfident CEO is more
likely to undertake more mergers during merger waves than during non-merger waves.
In addition to these four predic-tions, the fifth prediction is that: 5. CEO overconfidence along with
merger waves, stock overvaluation, higher capital liquidity, different-industry target firms, better merger performance, higher merger free cash flows, lower pre-merger leverage, longer tenures, and lower stock ownerships lead bidder CEOs to pay higher merger premiums to target firms.
Overconfidence may cause CEOs to overestimate the values of target firms, their abilities to manage the targets, or the gains/returns from merg-ers. During merger waves, bidders may compete one another to take over the target firms. It is fairly difficult for bidder CEOs to value mergers cor-rectly if they acquire the targets from different industries since they may have only few experiences, capabilities, and little knowledge of the targets’ busi-nesses. In addition, CEOs with longer
tenures might have more control on the firms as they define the policies and strategies of their firms for a sub-stantial period of time and have stron-ger influence on the board as they have already proven their skills and abilities to the board. With this power in hands, they may force the board to support them to complete mergers, which may be a part of their organizational strat-egy. Moreover, bidder CEOs with lower stock ownerships will be less affected by the decreases in bidder stock prices after mergers. They are more willing to complete mergers as they may get better rewards in manag-ing bigger assets. In turn, all these together, accompanied by bidders’ stock overvaluation (economic source of finance), high level of free cash flows, low level of leverage, and better pre-merger performance (which makes CEOs believe that the acquired firms’ prospects will be better in their hands and more benefits can be brought to their firms) as well as high capital liquidity (low transaction costs) may lead to bidder CEOs being readily avail-able to pay higher premiums to the targets.
199
Soegiharto—
What Drives the Payment of Higher Merger Premiums?
The Means of and the Predictors Effect on Premium Paid Findings
Predictions Univariate Multivariate
CEOs’ Behaviour Overconfident Higheru; Positivem Mixed Insignificant
Timing of Merger In-Wave Merger Higheru;Positivem Insignificant Significant
Industry of Inter-Industry Higheru;Positivem Insignificant Insignificant Merged Firms Merger
Method of Stock Higheru;Positivem Significantly Insignificant
Payment lower
Capital Liquidity Year of Higheru;Positivem Significantly Significant High Liquidity higher
Pre-Merger FCF Higher Higher — Insignificant
Pre-Merger Lower Higher — Insignificant
Leverage
CEOs’ Lower Higher — Insignificant
Ownerships
CEOs’ Tenure Longer Higher — Insignificant
Pre-Merger Better Higher — Insignificant
Performance
u = Univariate evidence m = Multivariate evidence
The difference is significant only when Measure B is used and it is the less overconfident CEOs who pay higher premiumsu
In all models employed except when the timing of merger is the only predictor in the modelm
In all models employedm
This may occur due to the undervaluation of bidders’ stock and/or the higher level of bidders’ free cash flowu; in general, except for few models that indicate that bidders of stock mergers pay a lower premiumm
In general m
—
—
In general, except when Measure A is included in each model employedm
—
In general, except for pre merger sales growthm
Predictors Remark
Data and Methodology
Data
The data on mergers are collected from Securities Data Company’s (SDC) Mergers and Acquisitions da-tabase. The data gathered include suc-cessful U.S. merger transactions that took place during the period of Janu-ary 1991 to December 2000. It is re-quired that both the bidders and the target firms be publicly traded, the form of the deal be merger, and the attitude of the deal be friendly. In addition, the transaction value has to be at least USD60 million in 2005 dollars. These criteria result in an ini-tial sample of 3,184 mergers. The fi-nancial and stock price data for merged companies are extracted from Stan-dard and Poor’s COMPUSTAT re-search tape (COMPUSTAT) and Cen-tre for Research in Securities Price (CRSP) database, respectively. All sample firms are required to be listed on these two databases. This require-ment reduces the sample size to 729 mergers. Furthermore, the data for sample CEOs are collected from Execucomp database. The database provides comprehensive information on various aspects of CEOs such as the dates they are appointed to be CEOs, option packages including expiration dates and exercise prices, and CEOs’ share ownerships. Nevertheless, as the information regarding options held by CEOs until year of expiration–used to measure CEOs’ behavior–in this data-base is available only for a small num-ber of CEOs in the sample of this
study, the sample size drops to 294 mergers.
Measure of Overconfidence
A study by Malmendier and Tate (2003) collects sample of CEOs from Hall and Liebman’s data. The study classifies CEOs as overconfident when they hold their stock options until the last year before expiration. Different from Malmendier and Tate (2003), this study uses Execucomp database and since information regarding op-tions held by CEOs until year of expi-ration in this database is available only for a small number of CEOs in the sample of this study, it is not possible to apply their method. For this reason, this study proposes several measures of CEOs’ behavior measured prior to the year of merger announcement. As these measures of CEOs’ behavior are measured prior to merger announce-ment, they may better reflect CEO overconfidence in undertaking merg-ers. These measures are (Execucomp’s access item presented in italic) the followings:
1. Measure 1. CEO’s behavior is mea-sured as soptexsh/(soptexsh +
uexnumex). Soptexsh is the number of stock options exercised by CEOs
and uexnumex is the number of
201
Soegiharto—What Drives the Payment of Higher Merger Premiums? 2. Measure 2. CEO’s behavior is
mea-sured using the number of shares they own (shrown). CEOs are clas-sified as overconfident if the num-ber of shares they own increase at the end of the year, irrespective of whether or not they exercise their options. On the other hand, if the number of shares they own at the end of the year decrease or remain unchanged, they are classified as less overconfident CEOs.
3. Measure 3. CEO’s behavior is mea-sured using the number of options exercised (soptexsh) and the num-ber of shares owned by CEO (shrown). CEOs are classified as overconfident if they exercise no options and the number of share they own increase at the end of the year. In contrast, CEOs are classi-fied as less overconfident if they exercise their options and the num-ber of share they own decrease. 4. Measure 4. CEO’s behavior is
mea-sured using the number of shares owned by CEO (shrown), net aver-age value realized from exercising options (soptexer/soptexsh), and the average value the CEOs would have realized at year end if they had exercised all of their vested options that had an exercise price below the market price (inmonex/uexnumex).
Soptexer is the net value realized from exercising options, and
inmonex is the value that CEOs
would have realized if they had exercised all of their in-the-money vested options. CEOs are classi-fied as overconfident (less
over-confident) if the number of shares they own (shrown) increase (de-crease or remain unchanged) at the end of the year and inmonex/
uexnumex is greater (smaller) than
soptexer/soptexsh.
5. Measure 5. CEO’s behavior is mea-sured using net average value real-ized from exercising options (soptexer/soptexsh) and the aver-age value the CEOs would have realized at year end if they had exercised all of their vested options that had an exercise price below the market price (inmonex/uexnumex). Different from Measure 4, the in-crease of the number of shares owned by CEOs (shrown) is disre-garded in this measure. CEOs are classified as overconfident (less overconfident) if inmonex/
uexnumex is greater (smaller) than
soptexer/soptexsh.
Identification of Merger Wave
wave. To confirm a potential wave as an actual wave, the following simula-tion procedure is followed to construct a distribution of merger concentra-tions that facilitates the testing of the economic significance of each merger wave concentration. The total number of merger bids for a given industry over the 120-month sample period (i.e., 10 years x 12 months) is identified. Each bid is then randomly assigned to one of the 120 months with the prob-ability of assignment being 1/120 for each month. This is repeated 1,000 times. Then, the highest concentration of merger activity within a 24-month period from each of the 1,000 draws is calculated. The actual concentration of activity from the potential wave is compared to the empirical distribution based on the simulated data. If the actual peak concentration exceeds the 95th percentile from that empirical dis-tribution, that period is coded as a wave. The final result of the merger simulation in the study of Soegiharto (2008) is 28 waves. He indicates that the average number of bids during the 24-month wave period over the 10-year sampling period is 53 whereas the average number of bids during the 24-month non-wave period is 14.3. This present study employs the identical waves identified in the study of Soegiharto (2008).
Measure of Bid Premium
Similar to Raj and Forsyth (2003), Hayward and Hambrick (1997), and Crawford and Lechner (1996), the ac-quisition premium is calculated over
the period in which target stock price is not affected by information on the merger. In this study, the window be-gins 30 trading days before the first announcement of the takeover and ends when the offer is accepted by the target shareholders. Bid premiums are calcu-lated as: (bid offer-target price-30)/ target price-30. Bid offer is the final price paid per target share by the bid-der and target price-30 is the value of the target share 30 days prior to the first bid announcement.
Results
Univariate Tests
203
Soegiharto—What Drives the Payment of Higher Merger Premiums? 1, 2, and 5 employed are renamed as
Measure A, Measure B, and Measure C, respectively.
The Difference in Premiums Paid
The first prediction of this study is that the premiums paid by overcon-fident CEOs are higher than those paid by less overconfident CEOs. To test this prediction, CEOs are classified as overconfident and less overconfident CEOs, and the independent sample t-test is used to look at the difference in the means of the premiums paid by these two different groups of CEOs. The results of the test, as presented in Table 2, indicate that there is a differ-ence in the average premiums paid by the two groups of CEOs. However, the difference is only significant when Measure B is used as a measure of CEOs’ behavior and it is the less over-confident CEOs who pay the higher
premiums. These results, therefore, do not substantiate Prediction 1. The over-confident CEOs paying less premiums may be due to their confidence that they value the targets correctly and the conviction of target stockholders that their firms will be better/superior in the hands of these overconfident CEOs. Irrespective of whether CEOs are overconfident or less overconfident, this study also tests the difference in the means of bid premiums paid for mergers that occur during merger waves (in-wave mergers) and outside the waves (non-wave mergers), merg-ers that involve biddmerg-ers and targets from the same industry (intra-industry mergers) and different industries (in-terindustry mergers), mergers com-pleted using stocks and cash, and merg-ers undertaken during the years of low and high (capital) liquidity. A high liquidity year is the year in which the
Table 2.The Difference in the Means of Premiums Paid by Overconfident and Less Overconfident CEOs
CEOs’ behavior is measured using Measure A, Measure B, and Measure C.
Premium Paid
SE Mean SE Sig.
CEO's Behavior N Mean SD Mean Diff. Diff. (2-tailed) Less overconfident 84 0.487 0.297 0.032
Overconfident 145 0.460 0.302 0.025
Less overconfident 81 0.549 0.301 0.033 Overconfident 179 0.430 0.282 0.021
Less overconfident 132 0.493 0.300 0.026 Overconfident 129 0.446 0.291 0.026 Measures
A
B
C
0.027 0.041 0.508
0.119 0.039 0.002
rate spread is below its time-series median and the industry’s market-to-book ratio is simultaneously above its time-series median. Low liquidity year is all other year.
It can be predicted that as merger competition during merger waves may be potentially tighter, the premiums paid to target firms during these waves may be higher. The premiums paid to the targets may also be higher in the interindustry (across industry) merg-ers because bidder CEOs may have only few experiences and little knowl-edge about targets’ businesses and, in turn, they may overestimate the values of the targets. Many studies suggest that managing a diversified firm may be a relatively more difficult task than managing a focused firm and,
thefore, a CEO of higher ability is re-quired (Finkelstein and Hambrick 1989; Rose and Shepard 1997). Bid-ders tend to use stocks to finance merg-ers when they believe their stocks are overvalued. As their stocks are over-valued, they are more readily available to pay higher premium to targets. In addition, the bid premiums paid to the targets may be higher when capital liquidity is high. As the transaction costs are low when the capital liquid-ity is high, the bidder CEOs may be more willing to pay more premiums to complete merger transactions.
The results of the independent sample t-test for these predictions (see Table 3) indicate that there are no differences in the means of bid premi-ums paid for mergers undertaken
dur-Table 3. The Difference in the Means of Premiums Paid for Mergers that Occur During Merger Waves and Outside The Waves
Mergers that involve bidder and target firms from the same and different industry, mergers completed using cash and stock, and mergers undertaken during a low and high (capital) liquidity year
Premium Paid
SE Mean SE Sig.
N Mean SD Mean Diff. Diff. (2-tailed) Non-Waved Merger 182 0.475 0.302 0.022
Waved Merger 82 0.486 0.312 0.034
Inter-Industry Merger 105 0.465 0.332 0.032 Intra-Industry Merger 155 0.458 0.267 0.021
Cash 62 0.532 0.330 0.042
Stock 119 0.433 0.280 0.026
Low Liquidity Year 161 0.454 0.280 0.022 High Liquidity Year 64 0.534 0.340 0.042 Merger
Timing
Firms’ Industry
Method of Pay-ment
Liquidity
-0.011 0.041 0.792
0.007 0.037 0.858
0.100 0.047 0.034
205
Soegiharto—What Drives the Payment of Higher Merger Premiums? ing merger waves and outside the waves
and for mergers that involve bidders and targets from the same and differ-ent industries. On the other hand, the findings document that the means of premiums paid for stock mergers are significantly lower than those for cash mergers. This may occur due to the undervaluation of bidders’ stocks and/ or the high level of their free cash flows. In addition, the means of premi-ums paid for mergers undertaking fol-lowing a high liquidity year are sig-nificantly higher (at significant level of 0.1) than those for mergers con-ducted following a low liquidity year. These results suggest that bidders will pay higher premiums when they have access to economic sources of fund to accommodate the reallocation of as-sets.
To test the second prediction that overconfident CEOs are more likely to pay higher premiums for in-wave merg-ers than for non-wave mergmerg-ers, over-confident CEOs are classified into: (1) overconfident CEOs who undertake mergers during merger waves and (2) those who undertake mergers outside the waves. The independent sample t-test is employed to test the difference in the means of premiums paid by these two groups of overconfident CEOs. As presented in Panel A of Table 4, the results indicate that the premiums paid by overconfident CEOs for mergers undertaken during merger waves and outside the waves are not significantly different. Hence, these findings do not support Prediction 2. The presence of many target firms
during merger waves may provide an opportunity for overconfident bidder CEOs to choose the most favorable one without paying higher premiums. For comparison, this study also con-ducts an identical independent sample
Table 4. The Difference in The Means of Premiums Paid by Overconfident CEOs for In-Wave and Non-Wave Mergers
(Panel A)
CEOs’ behaviour is measured using Measure A, Measure B, and Measure C
Premium Paid
Overconfident CEOs– SE Mean SE Sig.
Measure Merger Timing N Mean SD Mean Diff. Diff. (2-tailed)
Overconfident CEOs–Non-Wave Mergers 105 0.447 0.276 0.027 Overconfident CEOs–In-Wave Mergers 39 0.475 0.346 0.055 Overconfident CEOs–Non-Wave Mergers 123 0.422 0.272 0.025 Overconfident CEOs–In-Wave Mergers 57 0.461 0.318 0.042 Overconfident CEOs–Non-Wave Mergers 89 0.429 0.279 0.030 Overconfident CEOs–In-Wave Mergers 41 0.502 0.332 0.052
(Panel B)
The difference in the means of premium paid by less overconfident CEOs for in-wave and non-wave mergers CEOs’ behaviour is measured using Measure A, Measure B, and Measure C.
Premium Paid
Less Overconfident CEOs– SE Mean SE Sig.
Measure Merger Timing N Mean SD Mean Diff. Diff. (2-tailed)
Less Overconfident CEOs–Non-Wave
Mergers 74 0.484 0.305 0.036
Less Overconfident CEOs–In-Wave
Mergers 43 0.496 0.281 0.043
Less Overconfident CEOs–Non-Wave
Mergers 56 0.552 0.306 0.041
Less Overconfident CEOs–In-Wave
Mergers 25 0.542 0.298 0.060
Less Overconfident CEOs–Non-Wave
Mergers 91 0.503 0.303 0.032
Less Overconfident CEOs–In-Wave
Mergers 41 0.469 0.295 0.046
-0.028 0.056 0.620
-0.040 0.046 0.391
-0.073 0.056 0.194 A
B
C
-0.012 0.057 0.837
0.010 0.073 0.887
0.034 0.057 0.552 A
B
207
Soegiharto—What Drives the Payment of Higher Merger Premiums?
Continued from Table 4
(Panel C)
The difference in premium paid by overconfident CEOs and less overconfident CEOs for in-wave mergers CEOs’ behaviour is measured using Measure A, Measure B, and Measure C.
Premium Paid
Less Overconfident CEOs– SE Mean SE Sig.
Measure Merger Timing N Mean SD Mean Diff. Diff. (2-tailed)
Less Overconfident CEOs 43 0.496 0.281 0.043
Overconfident CEOs 39 0.475 0.346 0.055
Less Overconfident CEOs 25 0.542 0.298 0.060
Overconfident CEOs 57 0.461 0.318 0.042
Less Overconfident CEOs 41 0.469 0.295 0.046
Overconfident CEOs 41 0.502 0.332 0.052
(Panel D)
The difference in premium paid by overconfident CEOs and less overconfident CEOs for non-wave mergers. CEOs’ behaviour is measured using Measure A, Measure B, and Measure C.
Premium Paid
Less Overconfident CEOs– SE Mean SE Sig.
Measure Merger Timing N Mean SD Mean Diff. Diff. (2-tailed)
Less Overconfident CEOs 74 0.484 0.305 0.036
Overconfident CEOs 105 0.447 0.276 0.027
Less Overconfident CEOs 56 0.552 0.306 0.041
Overconfident CEOs 123 0.422 0.272 0.025
Less Overconfident CEOs 91 0.503 0.303 0.032
Overconfident CEOs 89 0.429 0.279 0.030
0.021 0.069 0.766
0.081 0.075 0.284
-0.033 0.069 0.636 A
B
C
A
B
C
0.021 0.069 0.766
0.037 0.044 0.403
0.074 0.043 0.091
non-wave mergers are higher than those paid by the overconfident CEOs. These findings do not support Prediction 3, but they are consistent with the finding
CEO’s Behavior and the Timing of Mergers
This study also predicts that an overconfident CEO is more likely to undertake more mergers during merger waves than outside the waves (Predic-tion 4). To test this predic(Predic-tion, CEOs are classified into overconfident CEOs and less overconfident CEOs, and mergers are categorized into in-wave mergers and non-wave mergers. The
chi-square test is employed to test the relatedness between these two vari-ables.
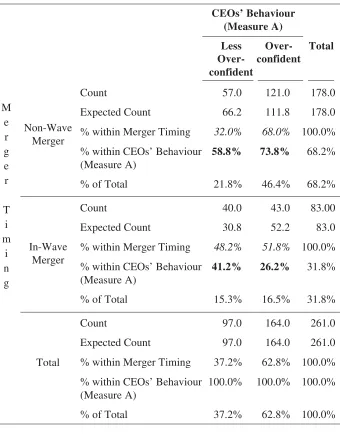
The results of the test, when Mea-sure A is utilized, indicate a Pearson
statistic of 6.388 and a significance of 0.012. By examining the percentage within the CEOs’ Behavior (Measure A is used) cell in the cross-tabulations presented in Table 5, it can be con-cluded that the portion of mergers un-dertaken outside merger waves by over-confident CEOs (73.8%) is greater than that undertaken outside merger waves by less overconfident CEOs (58.8%). It can also be concluded that the por-tion of overconfident CEOs who un-dertake mergers outside merger waves (68.0%) is greater than that undertak-ing mergers durundertak-ing the waves (51.8%). These conclusions are supported by the result of the hypothesis test for two proportions that indicates Z value of -2.518 and p value of 0.005. In addition, the value of contingency coefficient on the symmetric measure is 0.158 with a significance of 0.012, which suggests that there is a relationship between CEOs’ behavior and the tim-ing of mergers even though this
rela-tionship is very weak. In contrast to these results, the chi-square test for the relatedness between CEOs’ be-havior —measured using either mea-sure B or Meamea-sure C— and the timing of mergers indicates an insignificant association between these two vari-ables (cross-tabulations are not pre-sented). This suggests that either over-confident CEOs or less overover-confident CEOs do not have time preference in undertaking mergers (during merger waves or outside the waves). Overall, these findings do not support Predic-tion 4.
Multivariate Tests
Variables Affecting the Premiums Paid to Target Firms
li-209
Soegiharto—What Drives the Payment of Higher Merger Premiums?
Table 5. The Association between CEOs’ Behavior and Timing of Mergers CEOs’ Behaviour
(Measure A)
Less Over- Total
Over- confident
confident
Count 57.0 121.0 178.0
Expected Count 66.2 111.8 178.0
% within Merger Timing 32.0% 68.0% 100.0% % within CEOs’ Behaviour 58.8% 73.8% 68.2% (Measure A)
% of Total 21.8% 46.4% 68.2%
Count 40.0 43.0 83.00
Expected Count 30.8 52.2 83.0
% within Merger Timing 48.2% 51.8% 100.0% % within CEOs’ Behaviour 41.2% 26.2% 31.8% (Measure A)
% of Total 15.3% 16.5% 31.8%
Count 97.0 164.0 261.0
Expected Count 97.0 164.0 261.0
% within Merger Timing 37.2% 62.8% 100.0% % within CEOs’ Behaviour 100.0% 100.0% 100.0% (Measure A)
% of Total 37.2% 62.8% 100.0%
M e r g e r
T i m
i n g
In-Wave Merger
Total Non-Wave
quidity is also a dummy variable that takes the value of one for year with high liquidity and zero otherwise. A high liquidity year is the year in which the rate spread is below its time-series median and the industry’s market-to-book ratio is simultaneously above its time-series median. Low liquidity year is all other year. Three other dummy variables are: (1) industry of merged firms that takes the value of one for mergers involving bidders and targets from the same industry (intra-industry merger) and zero for mergers involv-ing bidders and targets form different industries (interindustry merger); (2) merger timing that takes the value of one for mergers that occur during the waves (in-wave mergers) and zero for those that occur outside the waves (non-wave mergers); and (3) the method of payment that takes the value of one for stocks and zero for cash. The difference between the date an indi-vidual becomes a CEO and the date the merger announced is used to deter-mine CEO tenure, and shares owned by a CEO is divided by the number of shares outstanding to obtain CEO stock ownership. To test the effects of these variables on premiums paid to the tar-get firms, this study employs regres-sion analysis and as in the univariate analysis, three measures of CEOs be-havior —Measure A, Measure B, and Measure C— are also used.
The individual effects of 16 pre-dictors on the amount of premiums paid to target firms are examined. Of the 16 regression models employed, only three predictors can explain the
amount of premiums paid. These three predictors can be seen in Models 1, 2, and 7 of Table 6 (the results of regres-sion analyses for the 16 models used are presented in Appendix A).
211
Soegiharto—What Drives the Payment of Higher Merger Premiums?
Table 6. Predicting Premiums Paid to Target Firms
Regression analyses are used to predict premiums paid to target firms. Bid premiums are calculated as: (bid offer – target price-30)/target
price-30. Bid offer is the final price paid per target share by the bidder and target price-30 is the value of the target shares thirty days prior
to the first bid announcement. The explanatory variables employed are free cash flows, leverage, CEOs tenure, and CEOs stock ownerships. Free cash flow is calculated as operating income – (taxes + interest + preferred dividend + common dividend) and leverage is calculated as long-term debt divided by book value of equities. The difference between the date an individual became a CEO and the date the mergers announced is used to determine CEOs’ tenure, and shares owned by CEOs is divided by number of shares outstanding to obtain CEOs’ stock ownerships. The measure of performance used as predictors are net income to sales, assets turnover, return on assets, sales growth, and market-to-book. Five other explanatory variable are dummies. These variables are method of payment that takes value of 1 for stock and 0 for cash, capital liquidity that takes value of 1 for high liquidity years (the years in which the rate spread is below its time-series median and the industry’s market-to-book ratio is simultaneously above its time-series median) and 0 for low liquidity year (all other years), timing of merger that takes value of 1 for in-wave mergers and 0 for non-wave mergers, industry of merged firms that takes value of 1 for intra-industry mergers and 0 for inter-intra-industry mergers, and CEOs behavior that takes value of 1 for overconfident CEOs and 0 for less overconfident CEOs. Three measures of CEOs’ behavior, Measure A, Measure B, and Measure C, are used in Model A, Model B, and Model C, respectively.
Without Measure of CEOs’ Behaviour With Measure A (Model A)
1 2 3 4 5 6 7 A1 A2 A3 A4 A5 A6
Intercept 0.532 0.454 0.506 0.482 0.400 0.357 0.549 0.529 0.500 0.539 0.498 0.381 0.323 [0.000] [0.000] [0.000] [0.000] [0.000] [0.000] [0.000] [0.000] [0.000] [0.000] [0.000] [0.000] [0.005]
Pre-merger FCF 0.000 0.000 0.000 0.000 0.000 0.000
[0.464] [0.575] [0.608] [0.425] [0.650] [0.316]
Pre-merger Leverage -0.111 -0.085 -0.070 -0.099 -0.090 -0.140
[0.345] [0.454] [0.547] [0.438] [0.471] [0.264] Method of Payment -0.100 -0.099 -0.021 -0.074 -0.076 -0.078 -0.087 0.002 -0.069 -0.074 [0.034] [0.047][0.753] [0.278] [0.282] [0.127] [0.132] [0.976] [0.386] [0.343] Capital Liquidity 0.081 0.129 0.155 0.169 0.176 0.069 0.160 0.146 0.165 0.202
[0.069] [0.031] [0.059] [0.037] [0.040] [0.147] [0.021] [0.102][0.070] [0.027]
Timing of Mergers 0.187 0.199 0.186 0.225
[0.012] [0.010] [0.048] [0.020]
Firms Industry 0.101 0.110 0.117 0.095
[0.146] [0.144] [0.145] [0.233]
CEOs’ Tenure -0.005 0.071
[0.633] [0.026]
CEOs’ Ownerships 0.000 0.000
[0.472] [0.812]
CEOs’ Behavior -0.019 -0.088 -0.070 -0.061 0.019 0.011
[0.700] [0.045] [0.213] [0.400] [0.813] [0.892]
CEOs’ Behaviour -0.119
[0.002]
CEOs’ Behaviour
Adjusted R2 0.019 0.010 0.044 0.010 0.088 0.083 0.032 0.003 0.020 0.047 -0.004 0.056 0.109 SE of the Estimate 0.298 0.298 0.294 0.300 0.288 0.292 0.288 0.303 0.290 0.319 0.312 0.303 0.296
p-value for F-test 0.034 0.069 0.012 0.307 0.036 0.066 0.002 0.286 0.054 0.025 0.464 0.142 0.052
Continued from Table 6
Without Measure of CEOs’ Behaviour With Measure A (Model A)
8 9 10 11 12 13 A8 A9 A10 A11 A12 A13
Intercept 0.430 0.340 0.369 0.356 0.367 0.415 0.396 0.319 0.339 0.331 0.362 0.410 0.000] [0.000] [0.000] [0.000] [0.000] [0.000] [0.001] [0.006] [0.004] [0.004] [0.002] [0.001] Pre-merger FCF 0.000 0.000 0.000 0.000 0.000 0.000 0.000 0.000 0.000 0.000 0.000 0.000
[0.789] [0.603] [0.576] [0.661] [0.512] [0.693] [0.459] [0.332] [0.299] [0.402] [0.235] [0.171] Pre-merger Leverage -0.069 -0.054 -0.087 -0.068 -0.066 -0.038 -0.128 -0.134 -0.154 -0.136 -0.133 -0.197 [0.554] [0.645] [0.468] [0.562] [0.574] [0.768] [0.304] [0.293] [0.226] [0.284] [0.287] [0.182] Method of Payment -0.104 -0.088 -0.075 -0.098 -0.069 -0.109 -0.093 -0.078 -0.069 -0.092 -0.061 -0.062 [0.154] [0.224] [0.292] [0.184] [0.345] [0.161] [0.252] [0.324] [0.378] [0.255] [0.439] [0.479] Capital Liquidity 0.169 0.167 0.164 0.183 0.153 0.137 0.185 0.196 0.186 0.207 0.165 0.167
[0.058] [0.053] [0.062] [0.037] [0.082][0.153] [0.056] [0.035] [0.048] [0.028] [0.078] [0.119] Timing of Mergers 0.194 0.198 0.220 0.190 0.200 0.180 0.217 0.220 0.239 0.210 0.192 0.204
[0.016] [0.011] [0.009] [0.021] [0.019] [0.046] [0.024] [0.025] [0.016] [0.041] [0.066] [0.078]
Firms Industry 0.128 0.122 0.112 0.122 0.116 0.122 0.114 0.101 0.097 0.104 0.095 0.071 [0.095] [0.109] [0.139] [0.113] [0.130] [0.141] [0.157] [0.220] [0.225] [0.199] [0.238] [0.428] CEOs’ Tenure 0.000 0.000 0.000 0.000 0.000 0.000 0.000 0.000 0.000 0.000 0.000 0.000
[0.549] [0.387] [0.440] [0.538] [0.523] [0.569] [0.809] [0.878] [0.879] [0.796] [0.695] [0.363] CEOs’ Ownerships -0.014 -0.006 -0.006 -0.007 -0.003 -0.012 0.055 0.068 0.067 0.067 0.074 0.074
[0.274] [0.551] [0.611] [0.570] [0.803] [0.396] [0.087] [0.040] [0.042] [0.041] [0.021] [0.052]
Pre-merger NI/Sales -0.480 -0.464 -0.541 -0.396
[0.125] [0.265] [0.119] [0.389]
Pre-merger ATO 0.049 -0.015 0.020 -0.038
[0.359] [0.832] [0.743] [0.664]
Pre-merger ROA -0.169 0.252 -0.165 -0.169
[0.422] [0.474] [0.478] [0.683]
Pre-merger Sales Growth 0.131 0.058 0.104 0.399
[0.291] [0.728] [0.444] [0.080]
Pre-merger M/B -0.015 -0.015 -0.012 -0.006
[0.425] [0.483] [0.537] [0.780]
CEOs’ Behaviour 0.011 0.010 0.006 0.003 -0.026 -0.014
[0.893] [0.906] [0.942] [0.970] [0.757] [0.879] Adjusted R2 0.102 0.081 0.078 0.094 0.042 0.007 0.129 0.097 0.103 0.113 0.071 0.052 SE of the Estimate 0.290 0.292 0.294 0.294 0.293 0.296 0.292 0.298 0.297 0.298 0.295 0.297 p-value for F-test 0.050 0.080 0.089 0.06 0.206 0.426 0.043 0.079 0.070 0.059 0.140 0.263
213
Soegiharto—What Drives the Payment of Higher Merger Premiums?
Continued from Table 6
With Measure B (Model B) With Measure C (Model C)
B1 B2 B3 B4 B5 B6 C1 C2 C3 C4 C5 C6
Intercept 0.582 0.535 0.565 0.479 0.393 0.330 0.538 0.485 0.523 0.522 0.433 0.389 [0.000] [0.000] [0.000] [0.000] [0.000] [0.002] [0.000] [0.000] [0.000] [0.000] [0.000] [0.000]
Pre-merger FCF 0.000 0.000 0.000 0.000 0.000 0.000
[0.470] [0.583] [0.627] [0.459] [0.571] [0.648]
Pre-merger Leverage -0.113 -0.089 -0.082 -0.100 -0.079 -0.068
[0.350] [0.445] [0.491] [0.390] [0.483] [0.558] Method of Payment -0.066 -0.086 -0.021 -0.074 -0.077 -0.089 -0.095 -0.008 -0.061 -0.064 [0.148] [0.098] [0.754] [0.281] [0.282] [0.058] [0.070] [0.906] [0.371] [0.371] Capital Liquidity 0.057 0.143 0.156 0.171 0.183 0.062 0.146 0.159 0.170 0.172
[0.191][0.020] [0.061] [0.038] [0.035] [0.158] [0.019] [0.051] [0.036] [0.044]
Timing of Mergers 0.188 0.204 0.171 0.181
[0.012] [0.009] [0.022] [0.022]
Firms Industry 0.100 0.107 0.098 0.108
[0.152] [0.157] [0.154] [0.151]
CEOs’ Tenure -0.005 -0.006
[0.588] [0.562]
CEOs’ Ownerships 0.000 0.000
[0.426] [0.380]
CEOs’ Behaviour
CEOs’ Behaviour -0.115 -0.114 -0.099 0.005 0.012 0.040 [0.014] [0.007] [0.062] [0.937] [0.857] [0.576]
CEOs’ Behaviour -0.031 -0.060 -0.040 -0.104 -0.074 -0.074
[0.479 [0.129] [0.422] [0.110] [0.243] [0.272] Adjusted R2 0.038 0.034 0.062 -0.002 0.077 0.075 0.012 0.013 0.044 0.029 0.092 0.086 SE of the Estimate 0.286 0.291 0.306 0.301 0.289 0.293 0.294 0.294 0.309 0.297 0.287 0.291 p-value for F-test 0.013 0.008 0.005 0.442 0.062 0.094 0.132 0.091 0.020 0.192 0.039 0.070
Continued from Table 6
With Measure B (Model B) With Measure C (Model C)
B8 B9 B10 B11 B12 B13 C8 C9 C10 C11 C12 C13
Intercept 0.414 0.309 0.330 0.320 0.346 0.399 0.454 0.372 0.398 0.386 0.407 0.434 [0.000] [0.004] [0.002] [0.004] [0.001] [0.001] [0.000 [0.000] [0.000] [0.000] [0.000] [0.000] Pre-merger FCF 0.000 0.000 0.000 0.000 0.000 0.000 0.000 0.000 0.000 0.000 0.000 0.000
[0.806] [0.624] [0.593] [0.677] [0.526] [0.696] [0.810 [0.640] [0.623] [0.719] [0.565] [0.679] Pre-merger Leverage -0.076 -0.067 -0.110 -0.083 -0.075 -0.046 -0.068 -0.055 -0.084 -0.069 -0.063 -0.052 [0.527] [0.578] [0.375] [0.489] [0.533] [0.729] [0.562 [0.644] [0.485] [0.559] [0.590] [0.692] Method of Payment -0.103 -0.089 -0.076 -0.099 -0.068 -0.108 -0.092 -0.075 -0.064 -0.086 -0.058 -0.099 [0.159] [0.222] [0.293] [0.180] [0.351] [0.167] [0.212 [0.306] [0.374] [0.249] [0.428] [0.212] Capital Liquidity 0.174 0.175 0.172 0.194 0.160 0.141 0.166 0.165 0.162 0.178 0.143 0.134
[0.056] [0.046] [0.052] [0.030] [0.077][0.149] [0.064 [0.056] [0.065] [0.043][0.103] [0.165] Timing of Mergers 0.197 0.203 0.234 0.196 0.206 0.185 0.177 0.181 0.197 0.173 0.167 0.173
[0.016] [0.010] [0.007] [0.019] [0.018] [0.046] [0.032 [0.022] [0.024] [0.041] [0.059] [0.073] Firms Industry 0.127 0.120 0.109 0.119 0.114 0.121 0.127 0.119 0.110 0.119 0.112 0.116
[0.102] [0.119] [0.154] [0.123] [0.139] [0.146] [0.099 [0.121] [0.146] [0.124] [0.144] [0.165] CEOs’ Tenure 0.000 0.000 0.000 0.000 0.000 0.000 0.000 0.000 0.000 0.000 0.000 0.000
[0.523] [0.340] [0.366] [0.478] [0.491] [0.544] [0.461 [0.325] [0.361] [0.436] [0.403] [0.567] CEOs’ Ownerships -0.014 -0.007 -0.007 -0.007 -0.003 -0.012 -0.016 -0.007 -0.008 -0.008 -0.005 -0.013 [0.270] [0.500] [0.535] [0.525] [0.778] [0.387] [0.227 [0.502] [0.520] [0.483] [0.640] [0.356]
Pre-merger NI/Sales -0.476 -0.452 -0.483 -0.429
[0.131] [0.285] [0.123 [0.310]
Pre-merger ATO 0.051 -0.013 0.042 -0.006
[0.339] [0.849] [0.430] [0.937]
Pre-merger ROA -0.216 0.233 -0.143 0.197
[0.325] [0.520] [0.502] [0.589]
Pre-merger Sales Growth 0.138 0.060 0.120 0.109
[0.272] [0.721] [0.336] [0.587]
Pre-merger M/B -0.015 -0.016 -0.012 -0.015
[0.414] [0.478] [0.525] [0.501]
CEOs’ Behaviour 0.023 0.045 0.060 0.052 0.029 0.021 -0.059 -0.067 -0.068 -0.065 -0.085 -0.042 [0.755] [0.531] [0.420] [0.473] [0.694] [0.789] [0.393] [0.322] [0.328] [0.357] [0.224] [0.593] Adjusted R2 0.090 0.074 0.074 0.088 0.031 -0.008 0.099 0.081 0.077 0.092 0.049 0.000 SE of the Estimate 0.292 0.293 0.295 0.295 0.294 0.298 0.291 0.292 0.294 0.295 0.292 0.298 p-value for F-test 0.080 0.107 0.110 0.082 0.271 0.506 0.065 0.089 0.100 0.074 0.191 0.466
215
Soegiharto—What Drives the Payment of Higher Merger Premiums? In the next analysis, this study
adds each of CEOs’ behavior mea-sures (Measure A, Measure B, and Measure C) into each of the other individual explanatory variables em-ployed. Regression models that include Measure A, Measure B, or Measure C as one of their explanatory variables are identified as Model A, Model B, or Model C, respectively, and are also presented in Table 6. Except for the results in Model C1 which show a significant (at significance level of 0.1) and negative effect of payment method on the dependent variable (in line with Model 1), the results of regression analyses in Model A1 and Model B1 indicate that the method of payment no longer has a significant effect on the dependent variable. Similarly, in Model A2, Model B2, and Model C2, the results also demonstrate that the effect of capital liquidity on premiums paid is no longer significant. The in-significant effects of the payment method and the capital liquidity on premiums paid are inconsistent with their effects shown in Model 1 and Model 2, respectively. Nevertheless, in Model A2, Model B1, and Model B2, the CEOs’ behavior has a signifi-cant and negative effect on premiums paid to target firms, meaning that the overconfident CEOs tend to pay lower mergers premium, which is consistent with the findings in Model 7 when Measure B is used. All of regression models that comprise each of the mea-sures of CEOs’ behavior and each of the other individual explanatory vari-ables are presented in Appendix 3-B.
As the next step, this study classi-fies the first eight of explanatory vari-ables presented in Table 6 into four groups. The first group is called ac-counting number factors, which con-sist of pre-merger free cash flows and pre-merger leverage. The second group consisting of the method of payment used and the capital liquidity is la-belled as financing factors. The third group, which comprises the timing of mergers and the industry of merged firms, and the fourth group comprised of CEO turnover and COE ownership are identified as merger factors and CEO factors, respectively. As pre-sented in Table 6, the method of pay-ment and the capital liquidity signifi-cantly affect premiums paid (see Model 3). The effect of the former variable is negative, suggesting that firms which finance their mergers using stocks tend to pay lower premiums. Meanwhile, the effect of the latter variable is posi-tive, implying that during the high liquidity year the bidders are more likely to pay higher premiums. These results are consistent with those in Model 1 and Model 2 (Table 6).
included to the financing factors group. In model B3, besides the method of payment and the capital liquidity, the CEOs’ behavior (Measure B) also sig-nificantly affects the premiums paid. Nevertheless, the effect of the method of payment in Model B3 and Model C3 and the effect of the CEOs’ behavior in Model B3 are only marginally signifi-cant (at significance level of 0.1). All of the other results of regression analy-ses for the models that contain ac-counting number factors, financing factors, merger factors, and/or CEO factors are presented in Appendix 3-C. Model 4, Model A4, Model B4, and Model C4 in Table 6 consist of pre-merger free cash flows, pre-merger leverage, method of payment, and capi-tal liquidity (accounting number fac-tors and financing facfac-tors) as explana-tory variables. In addition, Model A4, Model B4, and Model C4 also contain Measure A, Measure B, and Measure C, respectively, as the other indepen-dent variables. Except for Model A4 where there is no single predictor that significantly affects the dependent variable, the results of regression analy-ses for the other three models indicate that the capital liquidity is the only variable that remains to be signifi-cantly (at significance level of 0.1) and positively affecting the premiums paid. Model 5, which consists of ac-counting number factors (pre-merger free cash flows and pre-merger lever-age), financing factors (method of pay-ment and capital liquidity), and merger factors (timing of mergers and indus-try of merged firms), indicates that
capital liquidity remains a significant explanatory variable and that the tim-ing of mergers appears to be a variable that significantly and positively affect the premiums paid. The results show that during merger waves, premium paid to target firms tend to be higher. Similar results can also be seen in Model A5, Model B5, and Model C5, where the measure of CEOs’ behavior as the other explanatory variable is added. The results for Models 6, A6, B6, and C6 are consistent with those for Model 5. The only exception is in Model A6 where CEO tenure also has a significant and positive effect on the premiums paid.
217
Soegiharto—What Drives the Payment of Higher Merger Premiums? there is a potential competition amongst
bidders during merger waves. As a conclusion, it can be said that bidders that undertake mergers following the year of high liquidity and during merger waves tend to pay higher premiums, supporting the predictions formulated. In addition, the behavior of CEOs, in general, does not have any effect on the premiums paid to target firms.
In the next analysis, each of the pre-merger performance used in this study is individually and simulta-neously added to Model 6, Model A6, Model B6, and Model C6 in Table 6, and these new models are presented in the second part of Table 6. Similar to Harford (2005), this study employs a set of measures of operating perfor-mance that consist of net income [A172] to sales [A12], assets turnover (sales [A12]/average of total assets [A6]), return on assets (operating in-come [A13]/average of total assets [A6]), sales [A12] growth, and market [A24xA25] to book [A60]. The pre-merger operating performance is the average of years -3 to -1 relative to the announcement industry-adjusted per-formance. In general (at significance level of 0.01, 0.05, and 0.1), the results of regression analyses show that the capital liquidity and the timing of merg-ers remain to be significantly and posi-tively affecting the premiums paid (Model 8 to Model 12, Model A8 to Model A12, Model B8 to Model B12, and Model C8 to Model C12). These are consistent with the results
Conclusion
In this study, the tests on the dif-ference in premiums paid by overcon-fident and less overconovercon-fident bidder CEOs, for in-wave and non-wave merg-ers, for within and across industry mergers, for stock and cash mergers, and for mergers undertaken during a high and low liquidity year have been conducted. This study argues that over-confident CEOs may overestimate the values of target firms, their abilities to manage the targets, or the gains/re-turns from mergers. As a consequence, their overconfidence may lead them to pay higher premiums to the targets. This study employs three measures of CEOs’ behaviour, i.e., Measure A, Measure B, and Measure C, and the results of this study indicate that there is no difference between premiums paid by overconfident and less over-confident CEOs either when Measure A or Measure C is used as a measure of CEOs’ behaviour. When Measure B is employed, the difference in premiums paid between the two groups of CEOs is significant but it is the less overcon-fident CEOs who pay the higher pre-miums. Regression analysis shows that the effect of CEO overconfidence (gauged using each of the three mea-sures) on the premiums paid to target firms is insignificant.
Bidders that use stocks to finance their mergers are argued to pay higher merger premiums to target firms when their stocks are overvalued. In contrast to this argument, this study finds that bidders of cash mergers pay
signifi-cantly more premiums than do bidders of stock mergers. This is more likely due to the undervaluation of bidders’ stocks and/or the high level of their free cash flows. Nevertheless, the re-gression results indicate that the method of payment has no significant effect on the premiums paid to target firms.
It is also argued that the payment of higher premiums may occur espe-cially during merger waves where the competition amongst bidders poten-tially exists. The finding of univariate tests in this study, however, shows that there is no difference between premi-ums paid for in-wave and non-wave mergers. On the other hand, the results of multivariate tests (in all models employed) demonstrate that bidders that undertake mergers during merger waves pay higher merger premiums. The other argument of this study is that in the year of high capital liquidity, bidders tend to pay higher premiums as the transaction costs are low. This argument is confirmed by both univariate and multivariate tests con-ducted. These results suggest that bid-ders pay higher premiums when they have access to economic sources of fund to accommodate the reallocation of assets.
219
Soegiharto—What Drives the Payment of Higher Merger Premiums? to target firms when combined with
one or more other independent vari-ables in regression models. In this study, the timing of merger (i.e., merger waves) and capital liquidity (i.e., year of high liquidity) are variables that significantly and positively affect the premiums paid to target firms. On the other hand, the main independent vari-able (CEOs’ behaviour) examined in this study, in general, does not show any significant effect on the premiums paid. There is a doubt as to whether the CEO overconfidence is “exaggerated”. The other results of univariate tests indicate that premiums paid by over-confident CEOs for mergers under-taken during merger waves and
out-side the waves are not significantly different. This may occur as —although there may be a potential competition amongst interested bidders— the pres-ence of many targets during merger waves may provide an opportunity for overconfident bidder CEOs to choose the most favorable one without paying higher premiums. In addition, the re-sults show that the premiums paid by overconfident CEOs and less overcon-fident CEOs during merger waves are not significantly different. Also, irre-spective of CEOs’ behaviour, the pre-miums paid by bidder CEOs during merger waves and outside the waves are not significantly different.
References
Alicke, M. D. 1985. Global self-evaluation as determined by the desirability and control-lability of trait Adjectives. Journal of Personality and Social Psychology 49: 1621-1630.
Alicke, M. D., M. L. Klotz, D. L. Breitenbecher, and T. J. Yurak. 1995. Personal contact, individuation, and the better-than-average effect. Journal of Personality and Social Psychology 68 (5): 804-825.
Andrade, G., M. Mitchell, and E. Safford. 2001. New evidence and perspectives on mergers. Journal of Economic Perpectives 15 (2): 103-120.
Andrade, G., and E. Stafford. 2004. Investigating the economic role of mergers. Journal of Corporate Finance 10 (1): 1-36.
Ang, J. S., and Y. Cheng. 2003. Direct evidence on the market-driven acquisitions theory. Working Paper. Florida State University.
Asquith, P., and D. Mullins. 1986. Equity issues and offering dilution. Journal of Financial Economics (January/February): 61-89.
Berger, P. G., and E. Ofek. 1995. Diversification’s effect on firm value. Journal of Financial Economics 37 (1): 39-65.
Comment, R., and G. A. Jarrell. 1995. Corporate focus and stock returns. Journal of Financial Economics 37: 67-87.
Crawford, D., and T. A. Lechner. 1996. Takeover premiums and anticipated merger gains in the US market for corporate control.Journal of Business Finance and Accounting 23 (5-6): 807-830.
Dong, M., D. Hirshleifer, S. Richardson, and S. H. Teoh. 2002. Does investor misvaluation drive the takeover market? Working Paper. Ohio State University.
Fama, E., and K. French. 1997. Industry costs of equity. Journal of Financial Economics 43: 153–193.
Finkelstein, S., and D. C. Hambrick. 1989. Chief executive compensation: A study of the intersection of markets and political processes. Strategic Management Journal 10 (2): 121-134.
Frank, J. R., R. S. Harris, and S. Titman. 1991. The post-merger share price performance of acquiring firms. Journal of Financial Economics 29: 81-96.
Gervais, S., and T. Odean. 2001. Learning to be overconfident. Review of Financial Studies 14 (1): 1-27.
Harford, J. 2005. What drives merger waves? Journal of Financial Economics 77: 529– 560.
Haspeslagh, P. C., D. B. and Jemison. 1991. Managing acquisitions:Creating Value through Corporate Renewal. New York: Free Press.
Hayward, M. L. A., and D. C. Hambrick. 1997. Explaining the premium paid for large acquisitions: Evidence of CEO hubris. Administrative Science Quarterly 42 (1): 103-127.
Hietala, P., S. N. Kaplan, and D. T. Robinson. 2003. What is the price of hubris? Using takeover battles to infer overpayments and synergies. Financial Management 32 (3). Hubbard, R. G., and D. Palia. 1999. A reexamination of the conglomerate merger wave in the 1960s: An internal capital markets view. The Journal of Finance LIV (3): 1131-1152.
Lang, L. H. P., and R. M. Stulz. 1994. Tobin’s q, corporate diversification, and firm performance. The Journal of Political Economy 102 (6): 1248-1280.
Langer, E. J. 1975. The Illusion of control. Journal of Personality and Social Psychology 32: 311-328.
Mace, M. 1971. Directors: Myth and Reality. Boston: Harvard Business School Press. Malmendier, U., and G. Tate. 2003. Who makes acquisitions? CEO overconfidence and
the market’s reaction. Working Paper.
March, J. G., and Z. Shapira. 1987. Managerial perspectives on risk and risk taking.
Management Science 33: 1404-1418.
Masulis, R., and A. Korwar. 1986. Seasoned equity offerings: An empirical investigation. Journal of Financial Economics (January/February): 91-118.
221
Soegiharto—What Drives the Payment of Higher Merger Premiums?
Mikkelson, W., and M. Partch. 1986. Valuation effects on security offerings and the issuance process. Journal of Financial Economics (January/February): 31-60. Mitchell, M. L., and H. J. Mulherin. 1996. The impact of industry shocks on takeover and
restructuring activity. Journal of Financial Economics 41 (2): 193-229.
Morck, R., A. Shleifer, A., and R. W. Vishny. 1990. Do managerial objectives drive bad acquisitions? The Journal of Finance XLV (1): 31-48.
Mulherin, J. H., and A. L. Boone. 2000. Comparing acquisitions and divestitures. Journal of Corporate Finance 6: 117-139.
Myers, S. C., and N. S. Majluf. 1984. Corporate financing and investment decisions when firms have information that investors do not have. Journal of Financial Economics 13: 187-221.
Raj, M., and M. Forsyth. 2003. Hubris amongst U.K. bidders and losses to shareholders International Journal of Business 8 (1): 1-16.
Rhodes-Kropf, M., D. T. Robinson, and S. Viswanathan. 2004. Valuation waves and merger activity: The empirical evidence. Working Paper.Columbia University. Rhodes-Kropf, M., and S. Viswanathan. 2004. Market valuation and merger waves.
Journal of Finance 59 (6): 2685-2718.
Roll, R. 1986. The hubris hypothesis of corporate takeovers. The Journal of Business 59 (2): 197-216.
Rose, N., and A. Shepard. 1997. Firm diversification and CEO compensation: Managerial ability or executive entrenchment? The Rand Journal of Economics 28: 489-514. Servaes, H. 1991. Tobin’s Q and the gains from takeovers. Journal of Finance 46:
409-419.
Shleifer, A., and R. Vishny. 1989. Management entrenchment: The case of manager-specific investments. Journal of Financial Economics 25: 123 - 139.
Shleifer, A., and . W. Vishny. 2003. Stock market driven acquisitons. Journal of Financial Economics 70 (3): 295-311.
Soegiharto, S. 2008. Drivers of merger waves: A revisit. Gadjah Mada International Journal of Business 10 (1): 1-23.
Travlos, N. G. 1987. Corporate takeover bids, methods of payment, and bidding firms’ stock return. The Journal of Finance 42 (4): 943-963.
Weinstein, N. D. 1980. Unrealistic optimism about future life events. Journal of Person-ality and Social Psychology 39: 806-820.
Appendix A. Predicting Premiums Paid to Targets Using Individual Predictors
Bid premiums are calculated as: (bid offer – target price-30)/target price-30. Bid offer is the final price paid per target share by the bidder and target price-30 is the value of the target shares thirty days prior to the first bid announcement. The explanatory variables employed in the regression analyses are free cash flows, leverage, CEOs tenure, and CEOs stock ownerships. Free cash flow is calculated as operating income – (taxes + interest + preferred dividend + common dividend) and leverage is calculated as long-term debt divided by book value of equities. The difference between the date an individual became a CEO and the date the mergers announced is used to determine CEOs’ tenure, and shares owned by CEOs is divided by number of shares outstanding to obtain CEOs’ stock ownerships. The measure of performance used as predictors are net income to sales, assets turnover, return on assets, sales growth, and market-to-book. Five other explanatory variables are dummies. These variables are method of payment that takes value of 1 for stock and 0 for cash, capital liquidity that takes value of 1 for high liquidity years (the years in which the rate spread is below its time-series median and the industry’s market-to-book ratio is simultaneously above its time-series median) and 0 for low liquidity year (all other years), timing of merger that takes value of 1 for waved merger and 0 for non-waved merger, industry of merged firms that takes value of 1 for intra-industry mergers and 0 for inter-industry mergers, and CEOs behaviour that takes value of 1 for overconfident CEOs and 0 for less overconfident CEOs. Three measures of CEOs’ behaviour, Measure A, Measure B, and Measure C, are used in Model A, Model B, and Model C, respectively.
1 2 3 4 5 6 7 8
Intercept 0.513 0.496 0.532 0.454 0.475 0.465 0.463 0.479
[0.000] [0.000] [0.000] [0.000] [0.000] [0.000] [0.000] [0.000]
Pre-merger FCF 0.000
[0.816]
Pre-merger Leverage -0.056
[0.418]
Method of Payment -0.100
[0.034]
Capital Liquidity 0.081
[0.069]
Timing of Mergers 0.011
[0.792]
Industry of Merged Firms -0.007
[0.858]
CEOs Tenure 0.000
[0.660]
CEOs Stock Ownerships -0.080
[0.604] Adjusted R2 -0.006 -0.001 0.019 0.010 -0.004 -0.004 -0.003 -0.004
Std. Error of the Estimate 0.310 0.311 0.298 0.298 0.305 0.295 0.312 0.316 p-value for F-test 0.816 0.418 0.034 0.069 0.792 0.858 0.660 0.604
223
Soegiharto—What Drives the Payment of Higher Merger Premiums?
Continued from Appendix A
9 10 11 12 13 14 15 16
Intercept 0.497 0.476 0.495 0.466 0.461 0.487 0.549 0.493
[0.000] [0.000] [0.000] [0.000] [0.000] [0.000] [0.000] [0.000]
Pre-merger Net Income/Sales -0.317 [0.259] Pre-merger Assets Turnover 0.011 [0.817] Pre-merger Return on Assets -0.179
[0.231]
Pre-merger Sales Growth 0.092
[0.414]
Pre-merger Market-to-Book ratio 0.015
[0.107]
CEOs’ Behaviour (Measure A) -0.027
[0.508]
CEOs’ Behaviour (Measure B) -0.119
[0.002]
CEOs’ Behaviour (Measure C) -0.046
[0.208]
Adjusted R2 0.001 -0.004 0.002 -0.001 0.007 -0.002 0.032 0.002
Std. Error of the Estimate 0.307 0.312 0.304 0.302 0.307 0.300 0.288 0.295 p-value for F-test 0.259 0.817 0.231 0.414 0.107 0.508 0.002 0.208