(IJSBAR)
I SSN 2 3 0 7 - 4 5 3 1 (Print & Online)
http://gssrr.org/index.php?journal=JournalOfBasicAndApplied
---
A Data Model for Processing Financial Market and News
Data in Electronic Financial System for Investors with
Non- Financial Expertises: The Case of Saudi Arabia
Abdulaziz Aldaarmi
a*, Dr. Maysam Abbod
bSchool of Engineering and Design, Brunel University, London, UK
School of Engineering and Design, Brunel University, London, UK
a
b
Maysam [email protected]
Abstract
In this paper, prediction model consists of two parts is presented. The first is three factors of the Fama and
French model (FF) at the micro level to forecasting the return of the portfolios in Saudi Arabia Stock Exchange
(SASE) and the second is Value Based Management (VBM) model of decision-making on the basis of
expectations of shareholders and portfolio investors to take the investment decision and the behaviour of stoke
price using an accurate modern technique in forecasting Artificial Neural Networks (ANN). This study
examined monthly data relating to common stocks from the listed companies of Saudi Arabia Stock Exchange
from January 2007 to December 2011. The results from this study indicate that ANN technique can be used in
predicting the stock portfolios returns, the investment decision and the behaviour of stoke price.
Keywords: Fama and French Model (FF); Artificial Neural Networks (ANN) and Value Based Management
(VBM)
---
* Corresponding author.
1.Introduction
Forecasting stock exchange prices and making the investment decision are a significant financial issue, which
has been receiving increased attention in the last few years.
Different techniques are being used in the trading community for Forecasting stock exchange prices and making
the investment decision. In recent years, the new Concept of the neural networks has emerged. One of these, the
Artificial Neural Network (ANN), is
able to create forecasts with significant predictive ability. ANN has been successfully applied in a variety of
business fields including accounting [1], economics [2], finance [3], management information systems [4],
marketing [5], and production management [6].
In this context, the aim of this study is to predict the stock return, making the investment decision and determine
whether the predictive power of stock price can be improved in Saudi Arabia Stock Exchange (SASE) by using
the Artificial Neural Networks technique (ANN).
Moreover, this study explores the efficiency of Saudi Arabia Stock Exchange. If the attempts to improve the
predicting power of stock price in (SASE) using the ANN technique made the market inefficient, then there are
two possibilities. This inefficiency may be due to the fact that it is an emerging market. Alternatively, the
predicating power of stock return in (SASE) cannot be improved by using this specific technique (ANN).
In order to achieve the aims of this study, the following objectives were set: (1) Determining the accuracy of
computer-based information systems in predicting stock prices movement for companies traded in SASE; (2)
Specifying a model that may predict the stock return in SASE by applying the Fama and French (FF) model
three factors at the micro level by using AAN. (3) Test the Value Based Management (VBM) model of
decision-making on the basis of expectations of shareholders and portfolio investors in SASE.
The rest of this paper is organized as follows: Section two describes the literature review, while section three
shows methodology of ANN system. Section four lists the results, and finally the last section presents the
conclusion.
2.Literature review
This section presents the literature review in prediction stock exchange. Kim and Han used an ANN modified by
Genetic Algorithm (GA) to predict the stock price index [7]. They concluded that the GA approach
outperformed the conventional models. Kuo et al used a genetic algorithm base fuzzy neural network in the
Taiwan stock market to measure the qualitative effects on the stock price [8]. Quek and Cheng used ANFIS and
Neuro-Fuzzy network for forecasting investors in the US Stock Exchange [9], the findings indicate that ANFIS
is effective for predicting stock prices in the US Stock Exchange. Abraham, Ramos, and Han used a genetic
programming technique based on Multi-Expression programming (MEP) in order to forecast for two stock
problems. MEP technique gives the lowest MAP values for Nasdaq-100 index of NASDAQ Stock Market SM
and the S&P CNX NIFTY stock index. Yamashita, et al utilized artificial neural networks (ANNs) for financial
market applications [11]. They showed that multi-branch artificial neural networks (MBNNs) could have higher
representation and generalization ability than conventional NNs. They investigate the accuracy of prediction of
TOPIX (Tokyo Stock Exchange Prices Indexes) using MBNNs. Using the TOPIX related values in time series
and other information, MBNNs can learn the characteristics of time series and predict the TOPIX values of the
next day. Several simulations were carried out in order to compare the proposed predictor using MBNNs with
those using conventional NNs. The results show that the proposed method can have higher accuracy of the
prediction.
Trinkle tested ANFIS and neural network to forecast the annual excess returns of the three publicly traded
companies [12]. The predictive ability of these two techniques is compared with an autoregressive moving
average (ARMA) model, the results show that the ANFIS and neural network techniques are able to create
forecasts with significant predictive ability. Afolabi and Olatoyosiuse used Kohonen Self Orginising Map
(SOM) and hybrid Kohonen SOM for forecasting stock price, the results explain that the hybrid Kohonen
self-organizing map is power predation than the other techniques [13]. Chang and Liu improved a Takagi–Sugeno–
Kang (TSK) type fuzzy rule-based system for forecasting Taiwan Stock Exchange (TSE) price [14], the TSK
fuzzy model efficiently forecasts stock price with accuracy close to 97.6% in TSE index and 98.08% in Media
Tek. Abbasi and Abouec investigated the current movement of stock price of the Iran Khodro Corporation at
Tehran Stock Exchange by using an Adaptive Neuro-Fuzzy Inference System (ANFIS) [15], the findings of the
research demonstrate that the movement of stock price can be forecast with a low level of error. Guresen and
Kayakutlu investigated neural network models like GARCH-DAN2 and EGARCH-DAN2, and compared these
models in two regards: MSE and MAD to forecast Istanbul Stock Exchange (ISE XU10) [16]. Shamsuddin and
Sallehuddin developed a hybrid Neuro-Fuzzy with ANFIS to predict daily price of the Kuala Lumpur
Composite Index (KLCI) [17], the results show that ANFIS method is competent in forecasting the KLCI
compared to ANN. Atsalakis and Valavanis applied Adaptive Neuro-Fuzzy Inference System (ANFIS) to find
the stock price prediction model [18]. The results show that ANFIS are able to prediction the next day price of
stock exchange. Sutheebanjard and Premchaiswadi have predicted the stock exchange of Thailand index
movement [19]. Currently, there are two stock markets in Thailand; the stock exchange of Thailand (SET) and
the market for alternative investment (MAI). This paper focuses on the movement of the stock exchange of
Thailand index (SET Index). The back propagation neural network (BPNN) technology was employed in
prediction the SET index. An experiment was conducted by using data of 124 trading days from 2 July 2004 to
30 December 2004. The data were divided into two groups: 53 days for BPNN training and 71 days for testing.
The experimental results show that the BPNN successfully predicts the SET Index with less than 2% error. The
BPNN also achieves a lower prediction error when compared with the adaptive evolution strategy, but a higher
prediction error when compared with the (1+1) evolution strategy. Naeini et al have used two kinds of neural
networks, a feed forward multi-layer perceptron (MLP) and an Elman recurrent network, are used to predict a
company’s stock value based on its stock share value history [20]. The experimental results show that the
application of MLP neural network is more promising in predicting stock value changes rather than Elman
market return using Adaptive Network-Based Fuzzy Inference System (ANFIS) was investigated [21]. The
objective of this study was to determine whether an ANFIS algorithm is capable of accurately predicting stock
market return. They model and predict the return on stock price index of the Istanbul Stock Exchange (ISE)
using ANFIS. Six macroeconomic variables and three indices as input variables were made use of and it was
reported that experimental results reveal that the model successfully forecasts the monthly return of ISE
National 100 Index with an accuracy rate of 98.3%. Olatunji et al have presented an artificial neural network
based model for predicting the Saudi Arabia stock market [22]. The proposed model has been tested on three
different company selected as the major determinants of Saudi stock market. The results indicated that the
proposed ANN model predicts the next day closing price stock market value with a very low RMSE down to
1.8174, very low MAD down to 18.2835; very low MAPE of down to1.6476 and very high correlation
coefficient of up to 99.9% for the test set.
3. Methodology
3.1 Introduction
In this study a model that can predict the stock returns in SASE will be investigated by applying the Fama and
French (FF) three factors model using ANN. The three factors of the FF model are the market return, size and
book-to-market ratio [23][24]. Then applying second model for Value Based Management (VBM) is a new
methodology to take investment decision on the basis of expectations of shareholders and portfolio investors.
The VBM model contain into four factors weighted average cost of capital, actual profitability of investments,
the expected return on an investment and required return on invested capital. However in this system there are
two stages first applying the FF model and using the output as one of input in the second stage VBM model.
3.2 Data Description
The period of this study extended from January 2007 to December 2012, using monthly stock prices for
corporations listed in Saudi Arabia Stock Exchange (SASE). The source of all the data used in this study is the
website of the Saudi Arabia Stock Exchange. Therefore, the number of observations was 60 [25]. There were
sixty monthly observations for each portfolio, divided into two parts. The first one contains the first 48
observations, which represent the training period from 2007 to 2010, while the last 12 observations (twelve
months in 2011) represent the test period.
3.3 Monthly Return
The monthly return calculated in the following equation:
Rit = ( Pti – Pit-1) / Pit-1 (1)
where Rit is the monthly return for a stock.
Pit-1 is the end of the previous month stock price
3.4 Forming the Dependent Variables Portfolios
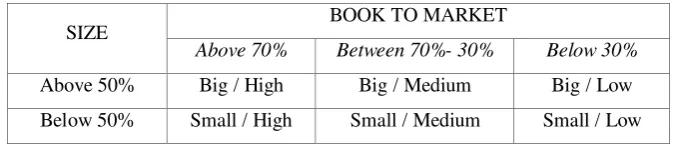
This study covers all the companies in Saudi Arabia Stock Exchange; therefore, I divide the exchange
companies upon 50% breakpoint for size at each year into two size groups: B for Big & S for Small. Then, each
size group divided into three book-to-market group upon two breakpoints 30% and 70% at each year. After that,
six size portfolios (B/H, B/M, B/L, S/H. S/M. S/L) are formed from the two size portfolios. Table 1 below
illustrates the six portfolios performed [26][27].
Table 1. The Six Portfolios
3.5 Forming the Independent Factors Portfolios
:
From the six portfolios formed above in the dependent variable we construct the independent variables RSMB
(small minus big) portfolio returns which is defined as RSMB = (RSL + RSM + RSH - RBL- RBM - RBH)/3,
and the HML (high minus low) portfolio returns which are defined as RHML = (RSH + RBH - RSL - RBL)/2.
Also a value weighted portfolio Market is formed which contains all the firms in these portfolios [26][27].
3.6. Equations
The equations of the three factors model of Fama and French are [26]:
Ri-Rf = αi + βi(RM-Rf) + γi RSMB + δi RHML + εi (2)
The dependent variable is Ri-Rf: the weighted average return for all the companies in stock market for six
portfolio which are the following: (1) RHB, which is Portfolio return for companies that are high
Book-to-Market level and big group; (2) RHS, which is Portfolio return for companies that are high Book-to-Book-to-Market
level and small group; (3) RMB, which is Portfolio return for companies that are medium Book-to-Market level
and big group; (4) RMS, which is Portfolio return for companies that are medium Book-to-Market level and
small group; (5) RLB, which is Portfolio return for companies that are low Book-to-Market level and big group
and finally (6) RLS, which is Portfolio return for companies that are low Book-to-Market level and small group.
The independent variables include the following. (1) RM: the market return portfolio is a sum over or aggregate
portfolio of all individual investors, lending and borrowing will cancel out. In other words, it equals the entire
wealth of the state economy [28]. The methodology of Fama and French [26] for (Rm-Rf) is the weighted
average return of all the stocks in the sample. (2) RSMB: one of first and famous anomalies was size effect,
SIZE BOOK TO MARKET
Above 70% Between 70%- 30% Below 30%
Above 50% Big / High Big / Medium Big / Low
which emphasizes that small size stocks had higher risk adjusted return than the stocks of the big size stocks
[29]. The methodology of Fama and French [26] for RSMB is explained by the difference between the return
portfolios of small and big of stocks, by this equation: RSMB = (RSL+RSM+RSH-RBL-RBM-RBH)/3. (3)
RHML: another famous anomaly was book-to-Market effect, which emphasizes that low market value stocks
had poor prospects and must be penalized by higher risk adjusted return. [29].The methodology of Fama and
French [26], for RHML is explained by the difference between the return on the portfolios of high and
low-book-to-market stocks, through this equation: RHML = (RSH + RBH - RSL -RBL)/2.
The model of decision-making on the basis of expectations of shareholders and portfolio investors Following the
methodology of Sherstneva and Kostyhin [30] the decision will depend on the expectation of growth, fall or
speculative fall of the stock price, and also depending on the expectation of invest, disinvest or dividend of the
shareholder. A balance of the following four indicators is used:
• Weighted average cost of capital (WACC): is a weighted cost from financing the capital of any
company from its different resources (Equity, Debt, Preferred Stock,.etc)
• Actual Return of investments (Ract): is the real rate of return that gained from holding an asset during a specific period on time.
• Expected Investment Return (Rexp): is the mean value of its probability distribution of return.
• Required investment Return (Rreq): is the return to compensate the investors for the risk premium, they are exposing on. I will illustrate the methodology of measuring those variables:
Weighted Average Cost of Capital (WACC):
WACC = Ks ∙ Ws + Kd ∙ Wd ∙ (1 - T) + Kp ∙ Wp (3)
where: Ks = the cost of equity; Ws = weight of equity; Kd = cost of debt; Wd = weight of debt; T = corporate
tax rate; Kp = cost of preferred stock; Wp = weight of preferred stock.
Actual profitability of investments (R_act):
To calculate Ract, ROIC is used as follows:
Ract = ROIC
ROIC = Return On Invested Capital
Ract = NOPLAT /IC (4)
where NOPLAT = Net Operating Profit Less Adjusted Taxes; and IC = Invested Capital.
The expected return on an investment (R_exp):
Rexp = D/Po+Q (5)
where D = dividend; Po = share price; and Q = dividend growth.
Required return on invested capital (R_req)
The model of fama and french is proposed to calculate the R-requird
Rreq = FF
FF = Fama and French Model
Rreq = αi + βi(RM-Rf) + γi RSMB + δi RHML + εi (6)
where (Rm - Rf) = Risk premium; Rm = the return rate of a market benchmark; Rf = the rate of return for a
risk-free security; RSMB Size effect = (RSL+RSM+RSH-RBL-RBM-RBH)/3;
RHML Book-to-Market effect = (RSH +RBH-RSL-RBL)/2; βi = beta of the company’s shares.
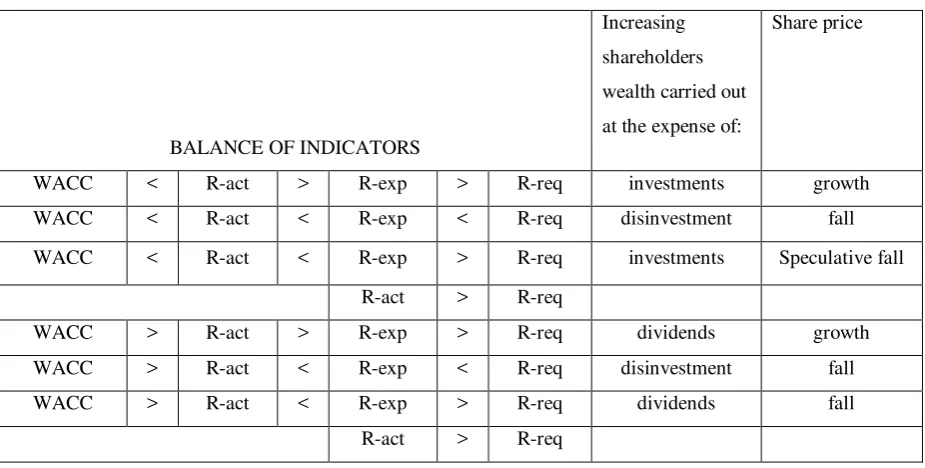
Table 2: The model of decision-making on the basis of expectations of shareholders and portfolio investors
BALANCE OF INDICATORS
Increasing
shareholders
wealth carried out
at the expense of:
Share price
WACC < R-act > R-exp > R-req investments growth
WACC < R-act < R-exp < R-req disinvestment fall
WACC < R-act < R-exp > R-req investments Speculative fall
R-act > R-req
WACC > R-act > R-exp > R-req dividends growth
WACC > R-act < R-exp < R-req disinvestment fall
WACC > R-act < R-exp > R-req dividends fall
R-act > R-req
Table 2 shows that the model of decision for the expectations of shareholder and portfolio investors the decision
will depend of the balance of four indicators. The expectation of the growth, fall or Speculative Fall of the stock
Growth: If the actual or real return bigger than the expected we predict the stock price to grow,
Fall: If the actual return is less than the expected return we expect the stock price to fall,
Speculative fall: If the expected return is more than the real return but both of them is larger than the required
return, the result will speculative fall.
The following three paragraphs show how the expectation of invest, disinvest or dividend of the shareholder has
taken:
Disinvest: if the real return is bigger than the weighted average cost of capital WACC which encourage
investing in this company, but still the expected & real return is less the required return which means that this
portfolio will not compensate the investor for the risk he will exposed to. Therefore the result will be disinvest.
Dividend: If the real rate of return is less than WACC, so any money spend in this company projects will not
cover its cost of capital, so it is preferred to distribute the profit to the investors and let them invest their money
in economically profitable companies instead in investing it in a loser projects. Therefore the result will be
dividend.
Invest: If the real rate of return is bigger than WACC, so any money spend in this company projects will cover
its cost of capital, so it is preferred to keep the money inside the company as a retained earning instead of
distributing the profit to the investors because this company is economically profitable. In addition the real rate
of return was bigger than the required return. Therefore the result will be to invest.
The output of Fama and French model - the predicted required return (R_req) – is used as an input for the VBM
model According to this model, we will decide if the stock price expectation will be growth or fall or
speculative fall and to decide if the shareholders will invest, disinvest or will distribute dividend for each
portfolio. Therefore, the inputs are: WACC, R actual, R expected and predicted R required and the outputs are
shareholder investing decision and the direction of the shares price movement for each portfolio.
4. Result
The FF model three factors have been applied using Matlab software after normalizing the data, using the
following techniques: (1) Logistic regression method (LR). (2) Different Neural Networks (NNs) types; namely,
Feed Forward Network (NEWFF), Elman networks (NEWELM), Cascaded Forward Back Propagation
(NEWCF), Radial Basis Networks (NEWRB), a feed-forward input time-delay back propagation network
(NEWFFTD), a distributed time delay neural network (NEWDTDNN) and a fitting network (NEWFIT)
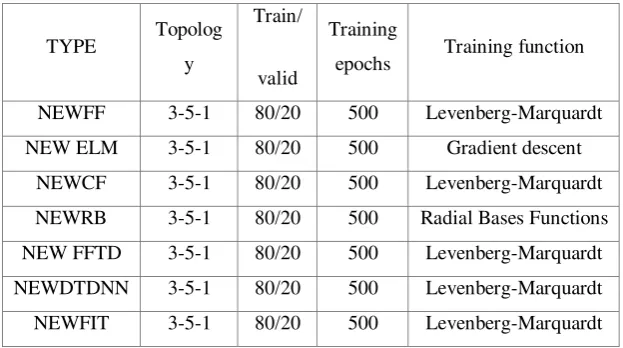
[31][32][33][34][35]. The ANN parameters and topology are illustrated in Table 3. (3) An Ensemble of the
above Neural Network techniques. (4) An ensembeled Neuro-Fuzzy (NF) system with 30 models, each having a
different number of membership functions [36]. (5) Finally, all the ensembles were combined together using
deviation was taken for each bin. Then the weights are set inversely to the standard deviation. The lower the
deviation is, the higher the weight will be.
Table 3. ANN Parameters and Topology
TYPE Topolog
y
Train/
valid
Training
epochs Training function
NEWFF 3-5-1 80/20 500 Levenberg-Marquardt
NEW ELM 3-5-1 80/20 500 Gradient descent
NEWCF 3-5-1 80/20 500 Levenberg-Marquardt
NEWRB 3-5-1 80/20 500 Radial Bases Functions
NEW FFTD 3-5-1 80/20 500 Levenberg-Marquardt
NEWDTDNN 3-5-1 80/20 500 Levenberg-Marquardt
NEWFIT 3-5-1 80/20 500 Levenberg-Marquardt
Tables 4 and 5 show that the best result for standard deviation was Average Weighted Method (the average of
the eight above portfolios) for all portfolios training and testing. Standard Deviation represents the difference
between the actual values and the predicted ones.
Table 4. Training Results for the Different ANNs and Average Weight
RAM: Training RHB RHS RMB RMS RLB RLS
LR 0.25 0.22 0.19 0.18 0.20 0.22
NEWFF 0.19 0.18 0.14 0.12 0.15 0.17
NEWELM 0.27 0.29 0.23 0.27 0.26 0.26
NEWCF 0.19 0.16 0.13 0.12 0.14 0.17
NF-AVERAGE 8.3E-6 6.8E-6 8.2E-6 6.9E-6 4.5E-6 5.8E-6
NEWRB 0.26 0.26 0.21 0.21 0.23 0.24
NEWFFTD 0.21 0.19 0.17 0.13 0.14 0.17
NEWDTDNN 0.20 0.19 0.15 0.13 0.13 0.19
NEWFIT 0.21 0.19 0.15 0.12 0.14 0.17
WEIGHT-AVE 0.18 0.17 0.13 0.12 0.13 0.16
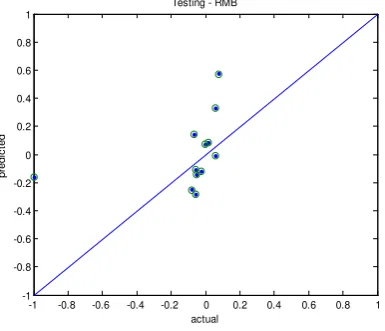
Figures 1, 2 and 3 (RHB, RHS and RMB testing portfolios) illustrate that the prediction power was very weak
because the points were too far from the prediction line, which represent the predicted values or theoretical
values. This means that the prediction accuracy is weak. On the other hand, Figures 4, 5 and 6 (RMS, RLB, RLS
prediction line, which represents the predicted values or theoretical values. Consequently, the prediction
accuracy is strong.
The second stage using the Value Based Management (VBM) model of decision-making on the basis of
expectations of shareholders and portfolio investors to take the investment decision and the behaviour of stoke
price using Artificial Neural Networks (ANN). Table 6 shows that the best result for standard deviation was
Average Weighted Method (the average of the eight above portfolios) for shareholder decision and the share
price behaviour for all portfolios training and testing. According the methodology we followed, the figures were
divided into three parts: Part 1- between 0.5 and -0.5 which is means this area for Dividend.
Part 2- Above 0.5 which means that this area for Invest. Part 3- Below -0.5 which is means this area for
disinvest. The results showed that for the shareholder decision according to Figures 7,8,9,10,11 and 12 all the
following portfolios (RHB, RHS, RMB, RMS, RLB and RLS testing) perditions were accurate and the decisions
was Invest and Dividend only. On other hand for the share price according to the Figures 13and 14 the
following portfolios (RHB and RHS) perditions were accurate and the expectation was fall in prices. While the
perdition accuracy for growth was not always perfect because there expectation were wrong. Also, according to
Figures 15 (RMB) the perditions accuracy for growth and fall were not always perfect because there expectation
were wrong.. On the other side, Figures16 and 18 portfolios (RMS and RLS) perditions were accurate for
growth and fall expectation. Finally, according to Figures17 portfolio (RLB) perditions were accurate for
growth while it was not perfect for fall.
The ANN model can be adapted by investors in Saudi Arabia Stock Exchange because its improve the level of
predicating accuracy for stock market return, investment decision and the movement of stock price in the future
in Saudi Arabia Stock Exchange (SASE). This means that we can depend on ANN model in a developing
market like the Saudi Arabia Stock Exchange (SASE) for the prediction of stock return, investment decision and
the movement of stock price.
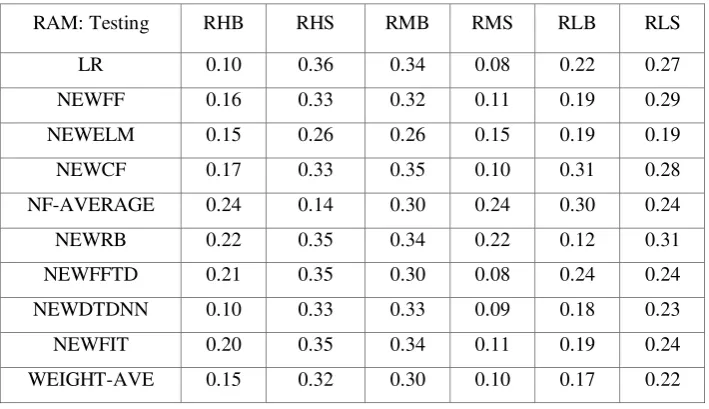
Table 5. Testing Results for the Different ANNs and Average Weight
RAM: Testing RHB RHS RMB RMS RLB RLS
LR 0.10 0.36 0.34 0.08 0.22 0.27
NEWFF 0.16 0.33 0.32 0.11 0.19 0.29
NEWELM 0.15 0.26 0.26 0.15 0.19 0.19
NEWCF 0.17 0.33 0.35 0.10 0.31 0.28
NF-AVERAGE 0.24 0.14 0.30 0.24 0.30 0.24
NEWRB 0.22 0.35 0.34 0.22 0.12 0.31
NEWFFTD 0.21 0.35 0.30 0.08 0.24 0.24
NEWDTDNN 0.10 0.33 0.33 0.09 0.18 0.23
NEWFIT 0.20 0.35 0.34 0.11 0.19 0.24
Table 6. Testing and training Results for shareholder and share price using the Average Weight
2007/2011
Ave-Weight Shareholder RMS Ave-Weight Shareprice RMS
-1 -0.8 -0.6 -0.4 -0.2 0 0.2 0.4 0.6 0.8 1
Fig.7. RHB testing results using average weight technique for shareholder. Fig.8. RHS testing results using average weight technique for shareholder.
-2 -1.5 -1 -0.5 0 0.5 1 1.5 2
-2 -1.5 -1 -0.5 0 0.5 1 1.5 2
Fig.11. RLB testing results using average weight technique for shareholder. Fig.12. RLS testing results using average weight technique for shareholder.
-2 -1.5 -1 -0.5 0 0.5 1 1.5 2
Fig.13. RHB testing results using average weight technique for share price. Fig.14. RHS testing results using average weight technique for share price.
-2 -1.5 -1 -0.5 0 0.5 1 1.5 2
-2 -1.5 -1 -0.5 0 0.5 1 1.5 2
Fig.17. RLB testing results using average weight technique for share price. Fig.18. RLB testing results using average weight technique for share price.
5. Conclusions
Predicting stock market return, investment decision and the movement of stock price are a hard task, but
Artificial Neural Network (ANN) provides the ability to forecast them. This is a new and emerging area; there is
a considerably large domain to use Artificial Neural Network (ANN) for predicting more accurate stock return
as well as predict whether it is best to buy, hold or sell shares of stock market.
This paper investigated two models the FF model three factors and Value Based Management (VBM) model of
decision-making on the basis of expectations of shareholders and portfolio investors using ANN to prediction
the stock market return, investment decision and the movement of stock price in the future in Saudi Arabia
Stock Exchange (SASE). The results show that the ANN techniques are able to generate forecasts with
significant predictive ability. The ANN can improve the investor’s prediction for the stock price and their
decision in SASE
.
The major limitation encountered in this study was related to the number of the companies inSaudi Arabia Stock Exchange. This limitation decided the number of companies in the portfolios, especially the
big size portfolios. When applying the same methodology of Fama and French, the numbers of the companies
in some of the big size portfolios are few companies.
The future work involves deploying the electronic financial system adviser for investors with non-financial
expertise using FF model and VBM model with filed study.
Reference
[1] M. Lenard, P. Alam and G. Madey, “The application of neural networks and a qualitative response model to
the auditor’s going concern uncertainty decision,” Decision Sciences, vol. 26, pp. 209–224, 1995.
[2] M. Hu, G. Zhang, C. Jiang and B. Patuwo, “A cross-validation analysis of neural network out-of-sample
[3] H. Etheridge R. Sriram and H. Hsu, “A comparison of selected artificial neural networks that help auditors
evaluate client financial viability,” Decision Sciences, vol. 31, pp. 531–549, 2000.
[4] D. Zhu, G. Premkumar, X. Zhang and C. Chu, “Data mining for network intrusion detection: a comparison
of alternative methods,” Decision Sciences, vol. 32, pp. 635–653, 2001.
[5] P. Papatla M. Zahedi and M. Zekic-Susac, “Leveraging the strengths of choice models and neural networks:
a multiproduct comparative analysis,” Decision Sciences, vol. 33, pp. 433–468, 2002.
[6] S. Kaparthi and N. Suresh, “Performance of selecting part-machine grouping technique for data sets of wide
ranging sizes and imperfection,” Decision Sciences, vol. 25, pp. 515–532, 1994.
[7] K. Kim, and I. Han, “Genetic algorithms approach to feature discretization in artificial neural networks for
the prediction of stock price index,” Expert Systems with Applications, vol. 19, pp. 125–132, 2000.
[8] R. Kuo, C. Chen and Y. Hwang, “An intelligent stock trading decision support system through integration of
genetic algorithm based fuzzy neural network and artificial neural network,” Fuzzy Sets and Systems, vol. 118,
pp. 21–24, 2001.
[9] C. Quek and P. Cheng, “Predicting the impact of anticipator action on US stock market – An event study
using ANFIS (a neural fuzzy model),” Computational Intelligence, vol. 23, pp. 117–141, 2005.
[10] C. Grosan, A. Abraham, V. Ramos and S. Han, “Stock market prediction using multi expression
programming,” In Proceedings of Portuguese conference of artificial intelligence, workshop on artificial life and
evolutionary algorithms Portuguese IEEE Press, 2005, pp. 73–78.
[11] T. Yamashita, K. Hirasawa, J. Hu, “Application of Multi-Branch Artificial neural networks to Stock Market
Prediction”, Proceedings of International Joint Conference on Neural Networks, Montreal, Canada,
2005,pp.2544-2548.
[12] B. Trinkle, “Forecasting annual excess stock returns via an adaptive network-based fuzzy inference
system,” Intelligent Systems in Accounting, Finance and Management, vol. 13, pp. 165–177, 2006.
[13] M. Afolabi, and O. Olatoyosi, “Predicting stock prices using a hybrid Kohonen self-organizing map
(SOM),” 40th Annual Hawaii international conference on system sciences, 2007, pp. 1–8.
[14] P. Chang and C. Liu, “A TSK type fuzzy rule based system for stock price Prediction,” Expert Systems
with Applications, vol. 34, pp. 135–144, 2008.
[15] E. Abbasi and A. Abouec, “Stock price forecast by using neuro-fuzzy inference system,” World Academy
[16] E.Guresen. and G. Kayakutlu, “Forecasting stock exchange movements using artificial neural network
models and hybrid models,” Intelligent Information Processing, vol. 288, pp. 129–137, 2008.
[17] Z. Yunos, S. Shamsuddin and S. Sallehuddin, “Data Modeling for Kuala Lumpur Composite Index with
ANFIS,” In Second Asia international conference on modeling and simulation AICMS, 2008, pp. 609–614.
[18] G. Atsalakis and K. Valavanis, “Forecasting stock market short-term trends using a neuro-fuzzy based
methodology,” Expert Systems with Applications, vol. 36, pp. 10696–10707, 2009.
[19] P. Sutheebanjard and W. Premchaiswadi,“Stock Exchange of Thailand Index predictionusing Back
Propagation Neural Networks”, Second International Conference on Computer and Network Technology IEEE,
2010, pp: 377-380.
[20] M. Naeini, H. Taremian, and H. Hashemi,” Stock Market Value Prediction Using Neural
Networks”,International Conference on Computer Information Systems and Industrial Management
Applications (CISIM) IEEE, 2010, pp: 132-136.
[21] M. boyacioglu, and D. Avci ,"An Adaptive Network-Based Fuzzy Inference System (ANFIS) for the
prediction of stock market return: The case of the Istanbul Stock Exchange." Expert Systems with Applications
vol.37, pp.7908-7912, 2010.
[22] S. olatunji , M. alahmadi , M. elshafei and Y. fallatah, “forecasting the Saudi Arabia stock market prices
based on artificial neural networks model,” international journal of intelligent information
systems,vol.2,pp.77-86,2013.
[23] V. Eraslana, “Fama and French Three-Factor Model: Evidence from Istanbul Stock Exchange,” Business
and Economics Research Journal, vol. 4, pp. 11-22, 2013.
[24] Z. Hamid, C. Hanif, S. Malook and W. Asimullah. “ Fama and French three factor model: Empirical
evidence from financial market of Pakistan,” African Journal of Business Management, vol. 6, no. 8, pp.
2945-2950, 2012.
[25] Saudi Stock Exchange.“Tadawal”. Internet: http://www.tadawul.com.sa/, Mar.10, 2008, [Feb. 16, 2013].
[26] F. Eugene and K. French, “Common Risk Factors in the Return on Stocks and Bonds,” Journal of Financial
Economics, vol. 33, pp. 3-56, 1993.
[27] F. Eugene and K. French, “The Cross-Section of Expected Stock Returns,” Journal of Finance, vol. 47, no.
2, pp. 427-465, 1992.
[29] R. Banz, “The relationship between return and market value of common stocks,” Journal of Financial
Economics, vol. 9, pp. 13-18, 1981.
[30] S. marina, K. yury, “Model of decision-making on the basis of expectations of shareholders and portfolio
investor,” The second international conference COMAT, 2012 pp. 1-5.
[31] E. Guresen, G. Kayakutlu and T. Daim, “Using artificial neural network models in stock market index
prediction,” Expert Systems with Applications, vol. 38, pp. 10389–10397, 2011.
[32] K, Al-Zubi, H, Salameh and H. Al Hamad, “Does the Predicating Power of Stock Return in Amman Stock
Exchange (ASE) Improved by Using the Artificial Neural Networks ANN,” International Research Journal of
Finance and Economics, vol. 46, pp. 80-98, 2010.
[33] M. Mostafa, “Forecasting stock exchange movements using neural networks: empirical evidence from
Kuwait,” Expert Systems with Applications, vol. 37, pp. 6302–6309, 2010.
[34] M. Naeini, H. Taremian and H. Hashemi, “Stock market value prediction using neural networks.”
International Conference on Computer Information Systems and Industrial Management Applications (CISIM),
2010, pp. 132–136.
[35] Q. Cao, M. Parry and K. Leggio, “The three-factor model and artificial neural networks: predicting stock
price movement in China,” Annals of Operations Research, vol. 185, pp. 25–44, 2011.
[36] S. George and K. Valavanis, “Forecasting stock market short–term trends using a neuro-fuzzy based
methodology,” Expert Systems with Applications, vol. 36, pp. 10696–10707, 2009.