Summary Effects of water supply on gas exchange, carbon isotopic composition, and relative growth rate were compared among seedlings from three populations of ponderosa pine (Pinus ponderosa Dougl. ex Laws.) grown in a controlled environment chamber. The three populations were chosen to represent high, moderate and low drought tolerance. There was no indication that drought tolerance was related to high water-use efficiency. Populations differed (P < 0.05) in relative growth rate (RGR), but did not differ (P > 0.10) in gas exchange variables or carbon isotope ratio (δ13C). Well-watered seedlings had significantly higher RGR, xylem pressure potential (Ψxpp),
net photosynthesis (A), stomatal conductance to water vapor (g), and lower δ13C and instantaneous water-use efficiency than water-stressed seedlings. With decreasing Ψxpp, A decreased
linearly, whereas g decreased exponentially. Seedlings of the highly drought-tolerant population were more sensitive to water availability than seedlings from the other populations; they used water quickly when water was available, but closed their stomata in response to water stress. We conclude that, in ponderosa pine, the drought avoidance mechanism is more important for survival and growth in arid and semiarid environ-ments than the efficient use of water.
Keywords: carbon isotope ratio, net photosynthesis, Pinus ponderosa, relative growth rate, stomatal conductance, water-use efficiency, xylem pressure potential.
Introduction
Plants growing in arid and semiarid climates often face some degree of drought stress (Fischer and Turner 1978, Morgan 1984). As a consequence, plants have developed various mechanisms to enhance their drought tolerance including well-developed root systems, osmotic adjustment, and certain leaf morphologies (Levitt 1980, Kramer 1983, Jones 1992, Larcher 1995). Although much is known about the mecha-nisms that increase drought tolerance, few studies have fo-cused on the relationship between drought tolerance and
water-use efficiency (WUE) (DeLucia and Heckathorn 1989, DeLucia and Schlesinger 1991, Jones 1993).
Water-use efficiency is defined as the ratio of carbon gain (dry matter accumulation) to water loss (amount of water transpired during a period of dry matter accumulation) (Sin-clair et al. 1984). Plants can achieve high WUE through either high net photosynthesis, or low transpiration, or both. Both processes are at least partially regulated by stomatal conduc-tance (Cowan 1982). When water is limiting, conducconduc-tance decreases as a result of stomatal closure. Stomatal closure has a greater effect on photosynthesis than on transpiration be-cause of the additional resistance associated with diffusion of CO2 relative to H2O in the leaf (Cowan 1982, Nobel 1991).
Thus, an increase in WUE caused by stomatal closure results in a decrease in carbon assimilation. However, when water is limited, plants that use a finite water supply more efficiently should grow more rapidly (Wright et al. 1993). Therefore, under drought conditions, plants with a high WUE should have higher productivity or a greater ability to survive than plants with a low WUE (Jones 1993).
We tested the hypothesis that drought-tolerant populations have higher WUE under drought conditions than less tolerant populations. We chose three populations of ponderosa pine (Pinus ponderosa Dougl. ex Laws.) that showed high, moder-ate and low drought tolerance in terms of survival and dry weight accumulation under several severe drying cycles (Cregg 1994). We chose this species for several reasons: first, population differentiation in growth, morphology, and phenol-ogy of ponderosa pine is well documented (Rehfeldt 1993); second, ponderosa pine is a drought-tolerant species relative to other sympatric woody species (Conkle and Critchfield 1988); and third, population variation in photosynthetic gas exchange is marginal (Cregg 1993, Zhang and Marshall 1995).
We measured water-use efficiency directly by dividing net photosynthetic rate by transpiration over a short period of time and indirectly by determining the stable carbon isotopic com-position (δ13C) of needle tissues (Farquhar et al. 1989). Plants discriminate against the heavier 13C when they fix carbon
Carbon isotopic composition, gas exchange, and growth of three
populations of ponderosa pine differing in drought tolerance
J. W. ZHANG,
1Z. FENG,
2,3B. M. CREGG
2,4and C. M. SCHUMANN
2,51
Department of Forestry, Fisheries and Wildlife, University of Nebraska at Lincoln, East Campus, Lincoln, NE 68583-0822, USA
2 USDA Forest Service, Rocky Mountain Research Station, National Agroforestry Center, East Campus-UNL, Lincoln, NE 68583-0822, USA
3
Current address: College of Forestry, Shandong Agricultural University, Tai’an, Shandong 271018, P.R. China
4
Current address: Union Camp Corporation, 1720 Goza Road, Mayesville, SC 29104, USA
5 Current address: USDA-ARS, Appalachian Soil and Water Conservation Laboratory, 1224 Airport Road, P.O. Box 400, Beaver, WV 25813, USA
Received July 17, 1996
through photosynthesis (O’Leary 1988), and so the ratio of 13C to 12C in plant tissues is lower than that in the atmosphere. Because the extent of discrimination is directly related to the intercellular CO2 concentration (ci) (Farquhar and Richards
1984, Farquhar et al. 1989), the relationship between δ13C and WUE is connected by ci. Furthermore, carbon isotopic
compo-sition represents a time-integrated estimate of WUE, which is a more useful measurement than instantaneous A/E values, determined by gas exchange, for studying overall WUE over a period of time (Ehleringer 1993).
Materials and methods
Plant materials and experimental design
We selected three populations (Table 1) of ponderosa pine that varied in drought tolerance as measured by the effects of several drought cycles on height, diameter, and dry weight growth and the effects of a prolonged dry-down on survival rate (Cregg 1994). Seedlings from South Dakota survived about 20 days longer and accumulated more dry weight under drought conditions than seedlings from Western and Central Montana, and seedlings from Western Montana had intermedi-ate survival rintermedi-ate and growth. Seeds were collected from each location by the US Forest Service in 1962--1964 (Read 1980). Each population consisted of a mixture of 6--8 open-pollinated families. In April 1995, stratified seeds (−4 °C for 4 weeks) were planted in plastic containers (164 cm3) in a 1/1 (v/v) mixture of peat and vermiculite. Germination ranged from 75 to 95%. Seedlings were irrigated three times per week with water adjusted to pH 5.8 and fertilized once a week with 150 ppm N and micronutrients (N,P,K 20,10,20).
In August, we measured height and root collar diameter of all seedlings and harvested 20 seedlings from each population to estimate allometric relationships between seedling dry weight and height and diameter (Table 1). Thereafter, we moved 74 seedlings (15 seedlings per population and irrigation treatment (12 for Central Montana population)) to a growth chamber (Conviron PGW36, Controlled Environments Inc., Winnipeg, Manitoba, Canada). The growth chamber was maintained at a day/night temperature of 25/20 °C and a relative humidity of 70%. During the 12-h photoperiod, pho-tosynthetic photon flux density was approximately 700 µmol m−2 s−1 at the top of the seedlings. In the well-watered treat-ment, seedlings were watered every day. Seedlings in the water-stress treatment were initially watered to field capacity,
and then watered once a week for four weeks. At the end of the 4-week experiment, we measured the height and diameter of the seedlings. The seedlings were then harvested, separated into aboveground and belowground components, and dry weights determined after oven-drying at 70 °C for at least 48 h. Relative growth rate (RGR) was calculated for all 74 seedlings as: (lnW2− lnW1)/(T2−T1); where W is plant dry weight and
T is number of days. The subscripts 1 and 2 refer to the first and the last harvest, respectively. The initial dry weight (W1)
was estimated from the regression equations generated from the initial harvest (Table 1).
Gas exchange and xylem pressure potential
We selected five seedlings from each population and treatment to measure needle pressure potential (Ψxpp), net photosynthesis
(A), stomatal conductance to water vapor (g), and transpiration (E) every five days after the seedlings were moved to the growth chamber. Pressure potential was measured with a pres-sure chamber (PMS Instrument Company, Corvallis, OR) on a single needle from each seedling at each time that gas ex-change was measured. Gas exex-change measurements were de-termined on two or three fascicles (six needles) per seedling with an open-system infrared gas analyzer (ADC-LCA-4, Ana-lytical Development Company, Hoddesdon, England). Inlet air was provided from a standard 350 ppm CO2 gas cylinder to
provide a stable CO2 concentration to the leaf chamber. Flow
was monitored by a mass flow controller and the gas was humidified by means of a portable dew point generator (Model LI-610, Li-Cor Inc., Lincoln, NE). For calculation of g, we assumed that boundary layer conductance was 2.5 mol m−2 s−1. Fascicles for gas exchange measurements were marked with small rubber rings at the base to ensure that the same needles were measured throughout the experiment. At the end of the experiment, we measured projected leaf area of the needles used in the gas exchange measurements with an area meter (Li-Cor Model LI-3100).
We generated A/ci curves from gas exchange measurements
with the LCA-4. The concentration of CO2 was varied by
means of soda lime scrubbers attached to the LCA-4. Begin-ning with the 900 ppm CO2 concentration, we measured A and
intercellular CO2 concentration (ci) on 2--3 seedlings from
each population for each irigation treatment at six CO2
concen-trations (from 900 to 400 ppm in 100-ppm decrements) using standard 900 ppm CO2 gas. Then the standard 350 ppm gas was
connected and four concentrations of CO2 were used to
meas-ure A and ci until CO2 declined to 50 ppm.
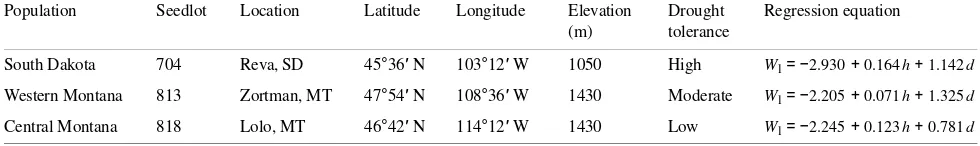
Table 1. Geographic information, drought tolerance (Cregg 1994), and regression equations between total dry weight (W1) and height (h) and
diameter (d) (model W1 = b0 + b1h + b2d) for ponderosa pine seedlings. Both intercepts and slopes differed among the three populations (P < 0.05).
Population Seedlot Location Latitude Longitude Elevation Drought Regression equation (m) tolerance
South Dakota 704 Reva, SD 45°36′ N 103°12′ W 1050 High Wl=−2.930 + 0.164h + 1.142d
Western Montana 813 Zortman, MT 47°54′ N 108°36′ W 1430 Moderate Wl=−2.205 + 0.071h + 1.325d
To establish that the growth chamber provided a saturating light intensity for the seedlings in the two irrigation treatments, light responses were measured at photosynthetic photon flux densities (PPFD) from 0 to 1200 µmol m−2 s−1 provided by a portable cool incandescent light (12 V, 75-W General Electric EYF bulb) at 25 °C, 350 ppm CO2 and 70% RH. The light
response curves differed between the water treatments (P < 0.001) based on measurements of one seedling from each population for each water treatment (n = 3 per water treatment) (Figure 1). Light compensation points were 80 and 77 µmol m−2 s−1 for the well-watered and the water-stressed seedlings, respectively. Light saturation occurred near 700 µmol m−2 s−1, which was the irradiance used for the gas exchange measure-ments.
Carbon isotopic composition
We harvested needle samples from all seedlings used for gas exchange measurements plus one additional seedling chosen at random for carbon isotope ratio measurements (n = 6 per treatment and per population). Oven-dried needles from each seedling were finely ground and δ13C, expressed relative to the PeeDee Belemnite standard (Craig 1957), was analyzed with an isotope ratioing mass spectrometer at Waikato Stable Iso-tope Unit, University of Waikato, New Zealand.
Data analysis
Relative growth rate and carbon isotope ratio were evaluated by analysis of variance (ANOVA) performed with the SAS software package (SAS Institute Inc., Cary, NC, 1995). The repeated measures analysis of variance in the SAS GLM pro-cedure was used for gas exchange variables and xylem pres-sure potential. Both A/ci and A/PPFD curves were fitted by the
Marquardt iterative least-square method. Differences among curves were tested by nonlinear regression analysis with a
nested model (Bates and Watts 1988). We also determined both simple linear regressions for allometric variables and correla-tion coefficients for net photosynthesis and xylem pressure potential.
Results
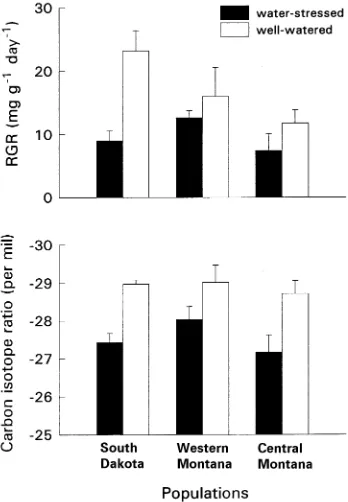
Populations differed in relative growth rate (RGR) (Figure 2, F = 3.26, P = 0.044), but the interaction between population and drought treatment was only significant at the 0.1 level (F = 2.49, P = 0.090). The South Dakota population had the highest RGR in the well-watered treatment, whereas the popu-lation from Central Montana had the highest RGR in the drought treatment. Across all populations, RGR was 80% higher in well-watered seedlings than in water-stressed seed-lings (F = 10.68, P = 0.002) (Figure 2).
Variation in carbon isotope ratio (δ13C) was not significant among populations (Figure 2, P > 0.25), but well-watered seedlings had significantly higher discrimination than water-stressed seedlings (P < 0.001). The population × treatment interaction was not significant for δ13C (P > 0.65) indicating that the rank of δ13C among populations did not change with drought treatment (Figure 2).
Well-watered seedlings had higher net photosynthetic rates (A), stomatal conductance to water vapor (g), and xylem pres-sure potential (Ψxpp) but lower water-use efficiency (A/E) than
water-stressed seedlings (Figure 3 and Table 2). However, populations did not differ in these variables, and population × treatment interactions were nonsignificant. Within subjects, A,
Figure 1. Net photosynthesis (A) as a function of photosynthetic photon flux density (PPFD) for individual fascicles of well-watered and water-stressed ponderosa pine seedlings. Because no difference was detected among populations within an irrigation treatment, only the fitted curves for all of the well-watered seedlings (dotted line) (A = 18.04PPFD/(277.91 + PPFD) -- 4.04) and water-stressed seedlings (solid line) (A = 12.41PPFD/(312.92 + PPFD) -- 2.45) are shown.
g, A/E, and Ψxpp differed among days of measurement and the
day × treatment interactions were also significant (except for A/E). The treatment × population × day interaction was signifi-cant for A and Ψxpp. The population × day interaction was
significant for Ψxpp only.
There was a significant relationship between A and Ψxpp
(r = 0.74, P < 0.001) (Figure 4). For both well-watered and water-stressed seedlings, as Ψxpp decreased, A decreased
line-arly, whereas g decreased exponentially and more rapidly than A (graph inside Figure 4).
The models that best fit the A/PPFD and A/ci response
curves are shown in Figures 1 and 5, respectively. The drought treatment had no significant effect on the A/ci curves (Figure 5,
F = 1.78, P > 0.25), suggesting that well-watered and water-stressed seedlings have a similar photosynthetic capacity and that A is limited exclusively by stomatal conductance. The A/ci
and A/PPFD response curves differed significantly among the
Figure 3. Net photosynthesis (A), stomatal conductance to water vapor (g), instantaneous water-use efficiency (A/E), and xylem pressure potential (Ψxpp) measured five consecutive times on well-watered (n,
s, e) and water-stressed (m, d, r) seedlings of ponderosa pine. Populations are South Dakota (m, n), Western Montana (d, s), and Central Montana (r, e). Each point represents a mean ± SE (n = 5). Well-watered seedlings were watered every day and water-stressed seedlings were watered on Days 0, 7, 14, and 21.
Table 2. Degrees of freedom (df), mean squares (MS), and F values (F) for the repeated measures of analysis of variance for net photosynthesis (A), stomatal conductance to water vapor (g), instantaneous water-use efficiency (A/E), and xylem pressure potential (Ψxpp) among three
populations of ponderosa pine.
A (µmol m−2 s−1) g (mol m−2 s−1) A/E (µmol/mmol) Ψxpp (MPa)
Source of variation df MS F1 MS F MS F MS F
Between subjects
TRT2 1 724.41 138.30*** 0.1171 32.54*** 25.11 10.45** 21.3571 198.99***
POP 2 11.99 2.29 0.0014 0.38 3.14 1.31 0.1906 1.78
TRT × POP 2 15.44 2.95 0.0018 0.50 7.90 3.29 0.1185 1.10
Within subjects
DAY 4 35.93 13.06*** 0.0085 15.23*** 32.08 11.28*** 3.3645 86.01***
TRT × DAY 4 24.15 8.78*** 0.0059 10.58*** 2.34 0.82 1.2053 30.81***
POP × DAY 8 2.93 1.06 0.0005 0.93 0.53 0.19 0.1112 2.84*
TRT × POP × DAY 8 13.91 5.05*** 0.0010 1.78 4.38 1.54 0.2287 5.85*
1
Significant levels for repeated measures are given as corrected probabilities: * = P < 0.05; ** = P < 0.01; *** = P < 0.001.
2 Abbreviations: TRT = water treatment; POP = population; DAY = measuring date.
Figure 4. Relation of net photosynthesis (A) (main) and stomatal conductance to water vapor (g) (inset) to xylem pressure potential (Ψxpp) of ponderosa pine seedlings. Symbols are the same as those in
populations in the well-watered treatment (graph inside Fig-ure 5, F = 3.21, P < 0.01), but only because of variation in the population from Western Montana.
Discussion
There was no evidence of a clear relationship between drought tolerance and carbon isotopic composition after one growing season or between drought tolerance and instantaneous water-use efficiency. The population from South Dakota, which was the most drought tolerant in terms of survival and dry weight accumulation under drought conditions (Cregg 1994), had moderate values of δ13C in both irrigation treatments. There were no differences in δ13C and A/E in this population com-pared with the other two populations (Figures 2 and 3). Popu-lation variation in δ13C was less in the well-watered treatment than in the water-stress treatment suggesting that the relation-ship between WUE and drought tolerance, if one exists, was complicated by internal gas exchange characteristics and ex-ternal factors such as water availability, or their interaction.
Natural selection may not favor a high WUE in dry environ-ments because water saved could be used by competing vege-tation if the root systems overlap (Cohen 1970, Orians and Solbrig 1977, Passioura 1982). Alternatively, it is possible that drought tolerance and WUE are not related. With decreasing water availability, xylem pressure potential declined and sto-matal conductance and photosynthetic rate decreased in all of the populations (Figure 4). Although we did not detect popu-lation differences in these variables (Table 2), we did observe that performance of the South Dakota population with inter-mediate δ13C differed from that of the other two populations on Day 10, when it had a much lower g and A under water stress than the other two populations. (The trend was reversed in the well-watered treatment (Figure 3).) However, stomatal
conductance and net photosynthesis recovered quickly on Day 15 following rewatering on Day 14, indicating that the relative overall WUE of the South Dakota population was dependent on the proportion of time that water was available during the growing period.
In previous studies of conifer species, Zhang (1994) and Zhang et al. (1996) reported that some populations of Douglas-fir, ponderosa pine, and western larch used water and accumu-lated biomass quickly when water was available, but closed their stomata when water stress was imposed. van Buijtenen et al. (1976) identified a similar population in loblolly pine (Pinus taeda L.). Our finding that the relative growth rate of the South Dakota population was highest under well-watered conditions, but became intermediate when soil was dry is consistent with these observations. We conclude, therefore, that the highly plastic response of the South Dakota population is advantageous in dealing with environmental stresses (cf. Scheiner 1993). Thus, in a natural plant community, this type of drought-avoidance mechanism confers a competitive advan-tage by optimizing carbon gain under favorable conditions and minimizing water loss when water is limiting.
Population variation in widely distributed species should be high because natural selection by dissimilar environments al-ters gene frequency to produce differentiated populations (Stebbins 1950). However, photosynthetic gas exchange in ponderosa pine does not fit this expected pattern (cf. Cregg 1993, Zhang and Marshall 1995). It may be that the large variations in needle morphology, height and diameter growth, and phenology that have been described in this species (Conkle and Critchfield 1988, Cregg 1993, Rehfeldt 1993, Sorensen 1994) compensate to keep photosynthetic gas exchange at a constant value (Zhang 1994).
In conclusion, we reject the hypothesis that variation in drought tolerance among ponderosa pine populations is related to variations in water-use efficiency. We postulate that the drought-tolerant populations have more sensitive stomata than the less tolerant populations, resulting in higher photosynthetic rates in drought-tolerant populations than in drought-sensitive populations when water is available, and in lower rates of net photosynthesis when water is limiting. As a consequence, relative growth rate is higher in the highly drought-tolerant population than in the less tolerant populations under well-wa-tered conditions. We conclude that, under dry conditions, the ability to terminate water loss is more important than high water-use efficiency.
Acknowledgments
We thank Drs. J.D. Marshall and D.G. Williams for their comments on an earlier draft of this manuscript, Dr. R.M. King for consulting on curve comparisons, and Ted Hovland for his help in running the growth chamber. The research was partially supported by USDA Cooperative State Research Service, and NRI Competitive Grant #94371000835 to BMC.
References
Bates, D.M. and D.G. Watts. 1988. Nonlinear regression analysis and its applications. John Wiley & Sons, Inc., New York, 365 p. Figure 5. Net photosynthesis (A) as a function of intercellular CO2
concentration (ci) for well-watered and water-stressed ponderosa pine
seedlings. Symbols are the same as those in Figure 3. Because there was no difference between irrigation treatments, data were fitted with one curve (A = 41.48ci/(349.62 + ci)− 9.61). Populations varied only
in the well-watered seedlings. Therefore, we present A/ci curves in this
Cohen, D. 1970. The expected efficiency of water utilization in plants under different competition and selection regimes. Isr. J. Bot. 19:50--54.
Conkle, M.T. and W.B. Critchfield. 1988. Genetic variation and hy-bridization of ponderosa pine. In Ponderosa Pine: The Species and Its Management. Eds. D.M. Baumgartner and J.E. Lotan. Washing-ton State Univ. Coop. Ext. Serv., Pullman, WA, pp 27--43. Cowan, I.R. 1982. Regulation of water use in relation to carbon gain
in higher plants. Encyclopedia of Plant Physiology, Springer-Ver-lag, Berlin, 12B:489--613.
Craig, H. 1957. Isotopic standards for carbon and oxygen and correla-tion factors for mass spectrometric analysis of carbon dioxide. Geochim. Cosmochim. Acta 12:133--149.
Cregg, B.M. 1993. Seed-source variation in water relations, gas ex-change, and needle morphology of mature ponderosa pine trees. Can. J. For. Res. 23:749--755.
Cregg, B.M. 1994. Carbon allocation, gas exchange, and needle mor-phology of Pinus ponderosa genotypes known to differ in growth and survival under imposed drought. Tree Physiol. 14:883--898. DeLucia, E.H. and S.A. Heckathorn. 1989. The effect of soil drought
on water-use efficiency in a contrasting Great Basin desert and Sierra montane species. Plant Cell Environ.12:935--940.
DeLucia, E.H. and W.H. Schlesinger. 1991. Resource-use efficiency and drought tolerance in adjacent Great Basin and Sierran plants. Ecology 72:51--58.
Ehleringer, J.R. 1993. Carbon and water relations in desert plants: an isotopic perspective. In Stable Isotopes and Plant Carbon--Water Relations. Eds. J.R. Ehleringer, A.E. Hall and G.D. Farquhar. Aca-demic Press Inc., NewYork, pp 155--172.
Farquhar, G.D. and R.A. Richards. 1984. Isotopic composition of plant carbon correlates with water-use efficiency of wheat geno-types. Aust. J. Plant Physiol. 11:539--552.
Farquhar, G.D., J.R. Ehleringer and K.T. Hubick. 1989. Carbon iso-tope discrimination and photosynthesis. Annu. Rev. Plant Physiol. Plant Mol. Biol. 40:503--537.
Fischer, R.A. and N.C. Turner. 1978. Plant productivity in the arid and semiarid zones. Annu. Rev. Plant Physiol. 29:277--317.
Jones, H.G. 1992. Plants and microclimate: a quantitative approach to environmental plant physiology. Cambridge University Press, Cambridge, U.K., 428 p.
Jones, H.G. 1993. Drought tolerance and water-use efficiency. In Water Deficits: Plant Responses from Cell to Community. Eds. J.A.C. Smith and H. Griffiths. BIOS Scientific Publishers, Oxford, U.K., pp 193--203.
Kramer, P.J. 1983. Water relations of plants. Academic Press, New York, 489 p.
Larcher, W. 1995. Physiological plant ecology: ecophysiology and stress physiology of functional groups. 3rd Edn. Springer-Verlag, Berlin, 506 p.
Levitt, J. 1980. Responses of plants to environmental stress. 2nd Edn. Vol. 2. Academic Press, New York, 497 p.
Morgan, J.M. 1984. Osmoregulation and water stress in higher plants. Annu. Rev. Plant Physiol. 35:299--319.
Nobel, P.S. 1991. Physicochemical and environmental plant physiol-ogy. Academic Press, San Diego, CA, 635 p.
O’Leary, M.H. 1988. Carbon isotopes in photosynthesis. Bioscience 38:325--336.
Orians, G.H. and O.T. Solbrig. 1977. A cost income model of leaves and roots with special reference to arid and semiarid areas. Am. Nat. 111:677--690.
Passioura, J.B. 1982. Water in the soil--plant--atmosphere continuum. Encyclopedia of Plant Physiology, Springer-Verlag, Berlin, 12B:5--33.
Read, R.A. 1980. Genetic variation in seedling progeny of ponderosa pine provenances. For. Sci. Monogr. 23:1--59.
Rehfeldt, G.E. 1993. Genetic variation in the Ponderosae of the South-west. Am. J. Bot. 80:330--343.
Scheiner, S.M. 1993. Genetics and evolution of phenotypic plasticity. Annu. Rev. Ecol. Syst. 24:35--68.
Sinclair, T.R., C.B. Tanner and J.M. Bennett. 1984. Water-use effi-ciency in crop production. Bioscience 34:36--40.
Sorensen, F.C. 1994. Genetic variation and seed transfer guidelines for ponderosa pine in central Oregon. USDA For. Serv., Res. Pap. PNW-RP-472, Pacific Northwest Res. Stn., Portland, OR, 24 p. Stebbins, G.L. 1950. Variation and evolution in plants. Columbia
University Press, New York, 643 p.
van Buijtenen, J.P., W.V. Bilan and R.H. Zimmerman. 1976. Morpho-physiological characteristics related to drought resistance in Pinus taeda. In Tree Physiology and Yield Improvement. Eds. M.G.R. Cannell and F.T. Last. Academic Press, New York, pp 349--359. Wright, G.C., K.T. Hubick, G.D. Farquhar and R.C. Nageswara Rao.
1993. Genetic and environmental variation in transpiration effi-ciency and its correlation with carbon isotope discrimination and specific leaf area in peanut. In Stable Isotopes and Plant Carbon--Water Relations. Eds. J.R. Ehleringer, A.E. Hall and G.D. Farquhar. Academic Press, New York, pp 247--267.
Zhang, J.W. 1994. Population variation in photosynthetic gas ex-change, water-use efficiency, and carbon isotope discrimination of three conifer species in western north America. Ph. D. Thesis, Univ. Idaho, Moscow, ID, 131 p.
Zhang, J.W. and J.D. Marshall. 1995. Variation in carbon isotope discrimination and photosynthetic gas exchange among populations of Pseudotsuga menziesii and Pinus ponderosa in different environ-ments. Funct. Ecol. 9:402--412.