DESIGN OF STOCK TAKE POLICY FOR REDUCING TOTAL COST OF STOCK
TAKE ACTIVITY USING CYCLE COUNTING METHOD IN RAW MATERIAL
DISTRIBUTION CENTER OF PT XYZ
1Michael Panjaitan, 2Ari Yanuar Ridwan, 3Budi Santosa
1,2,3
Program Studi Teknik Industri, Fakultas Rekayasa Industri, Telkom University
1[email protected], 2[email protected], 3[email protected]
Abstract
PT XYZ is a company that engaged in logistics. It holds inventories of raw materials of PT ABC. PT XYZ has warehouse which the value of raw material inventory accuracy is 86.41% out of the target set at 99.95%. The type of goods in warehouse classified into two types namely, packaging and raw materials. Observed from the investment value, raw materials has contributed 97.04%, while 2.96% of packaging material. PT XYZ has 16 SKUs raw material. Activity stock take existing spending Rp, 35.566.500,-. Stock take cost is expensive accompanied by the performance of the accuracy of warehouse is relatively distant from target achievement. PT XYZ requires a stock take design policy proposals aim to reducing costs and maintaining the accuracy of the goods at warehouse. Along with the stock take optimal policy can help reduce the stock take cost. Based on the calculation and analysis, implementation of policy proposals stock take can reduce processing time stock take activity, reducing the number of SKUs are calculated each stock take of its activities. Stock take of the proposed activity may minimizing costs up to Rp.15.208.500. Business process activities stock take activity stock increased by 1.67%. In terms, stock take of the proposed activity is able to minimize the cycle time per second 161.67 per pallet.
Keywords: 3PL, Inventory Record Accuracy, Cycle Counting, Cost Stock Take, Stock Take Activity
1. Introduction
PT. XYZ is a 3PL (Third Party Logistics) is a multinational company that acts as a provider of logistics services such as warehousing, inventory management, transportation and distribution. PT. XYZ develop service supply chain management through a series of solutions supply chain, namely Intribution (raw materials management to support manufacturing), Retrogistic (service and returns management) and Intrabution (customer goods distribution).
PT. XYZ has a main warehouse located in Cibitung. There are several places as a warehouse storage of goods, and one of which is a raw material warehouse. SKU is divided into two categories: powder and liquid. SKU is used as a raw material to supply the plant, located in Pasar Rebo and Ciracas.
Category Numbers of SKU’s Investment per SKU
Powder DEMINERAL WHEY POWDER 25% 5.79%
Powder MALTODEXTRINE DE 19 6.93% Powder BUTTER MILK POWDER 4.26%
Powder MODIFIED STARCH 1.63% Powder FRUTAFIT HD 0.72% Powder DRIED CREAM EXTRACT 0.25%
Powder MILK PROTEIN CONCENTRATE 0.30% Powder WHOLE MILK POWDER INSTANT 0.35%
From the table 1 it can be seen that there are 16 SKU raw material with the category of each SKU. Contributions of goods stored in the warehouse donated by the greatest MH skimmed milk powder, whey permeate Powder Consense 050, etc. For the monitoring of goods in the warehouse PT. XYZ stock usually do activities take in order to determine the accuracy of the goods stored in the warehouse. Activity stock take done manually by calculating the physical quantity of goods and then compared with the existence of goods in the system. PT. XYZ has carried out activities to warehouse raw material stock take with the results as shown below :
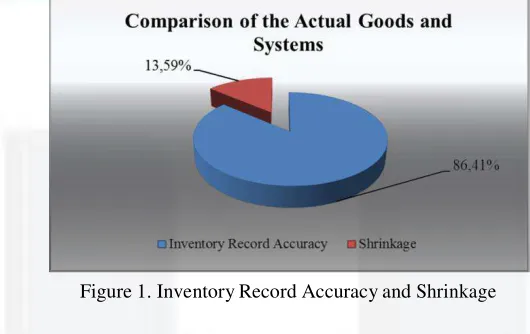
Figure 1. Inventory Record Accuracy and Shrinkage
Based on the results obtained stock take of the value of inventory record accuracy of 86.41% and a shrinkage of 13.59%. Based on the results obtained take stock of the value of inventory record accuracy of 86.41% and a shrinkage of 13.59%. Compared to the target that has been set is 99.95% achievement is still far from the target. Based on identification, the shrinkage caused by SKU unidentified, miss placed, damaged etc.
The following is a contribution shrinkage from each SKU.
In the figure 2 can be seen can be seen that some categories have a sizeable contribution towards shrinkage. For example, the largest contribution is owned by Skimmed Milk Powder MH amounted to 32.79%, Maltodextrine DE10 amounted to 32.05%, and Anhydrous Milk Fat amounted to 23.18% etc. In addition, PT XYZ also spent a significant operational cost for the activity stock take. Activity stock take has some variable costs into an expense XYZ. The details of each cost is as follows:
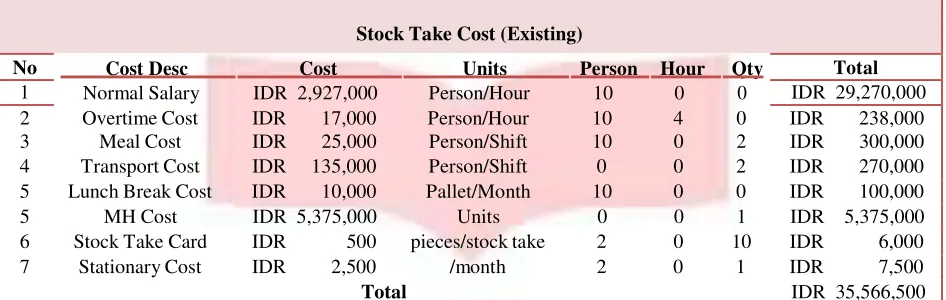
Table 2. Stock Take Cost Existing
Stock Take Cost (Existing)
No Cost Desc Cost Units Person Hour Qty
Normal Salary IDR 2,927,000 Person/Hour 10 0 0
Total
1 IDR 29,270,000
2 Overtime Cost IDR 17,000 Person/Hour 10 4 0 IDR 238,000 3 Meal Cost IDR 25,000 Person/Shift 10 0 2 IDR 300,000 4 Transport Cost IDR 135,000 Person/Shift 0 0 2 IDR 270,000 5 Lunch Break Cost IDR 10,000 Pallet/Month 10 0 0 IDR 100,000 5 MH Cost IDR 5,375,000 Units 0 0 1 IDR 5,375,000 6 Stock Take Card IDR 500 pieces/stock take 2 0 10 IDR 6,000 7 Stationary Cost IDR 2,500 /month 2 0 1 IDR 7,500
Total IDR 35,566,500
Based on the results obtained by calculating the total cost of the total Rp. 35.566.500, -. There are several variable cost to take stock of activities, one of which is the overtime cost. Overtime costs imposed on the calculation because stock take activity takes place from 09.00 s / d 23.00.
Given the high value of shrinkage that occurs in the warehouse PT XYZ and the costs are relatively expensive stock take activity. Hence the need for a cost minimization stock take policy proposal to be more efficient. Cycle counting can improve the accuracy of inventory in the warehouse until more than 97%[1], besides it can also reduce costs for the activity stock take.
Besides cycle counting method also aims to divide the stock take a period of time so that a faster implementation time and periodically. With the periodical check the activity of shrinkage adjustment to the goods would be more frequent. Obviously with reduced shrinkage of goods will increase the value of inventory record accuracy.
There is also a business improvement process based on existing business processes. Business improvement process is performed using Business Process Improvement. By using BPI will be obtained several activity eliminated[3]. The impact of the elimination of these activities is to minimize total cycle time take stock activity.
2. Design of Stock Take Policy to Minimize the Total Cost of Stock Take
2.1 Conceptual Model
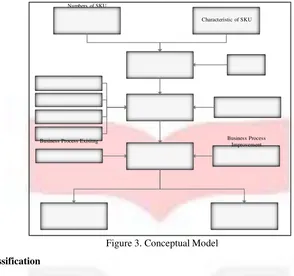
Conceptual model is a structured design that is used as a framework for mutually organized and express logical relationships and influences between concepts and methods used to solve the problem. The main concept of this research is to provide policy proposals stock take of using cycle counting. After that, it will be done to improve business processes be more effectively and efficiently. At the end of the resulting stock will take a proposal stock take schedule and cost.
Numbers of SKU
Product Classification FSN Analysis
Inventory Accuracy Existing
Operational Hours
Stock Taking Policy Cycle Counting Method Proposed Layout
Stock Take Cost Existing
Proposed Stock Take Business Process
Proposed Stock Take Cost Stock Take Schedule Characteristic of SKU
Business Process Exisitng Business Process
Improvement
2.2 Product Classification
Figure 3. Conceptual Model
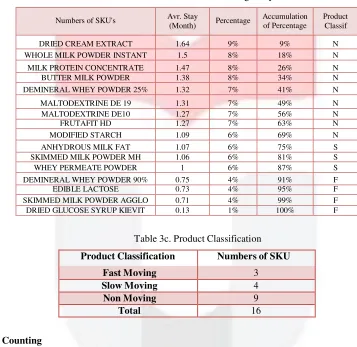
FSN analysis is the method used to manage inventory to classify a number of items based on the speed of movement of goods. FSN analysis is used to find out the fast moving, slow moving, and non-moving items. Each item will be classified based on the calculation consumption rate and average stay of goods in the warehouse [2].
There following steps in doing the FSN analysis :
1. Calculation of average stay and the consumption rate of the material in warehouse
2. FSN Classification of materials based on average stay in the inventory
3. FSN Classification of the material based on consumption rate
4. Finally classifying based on above FSN analysis.
The following is a formula for determining the average stay and the consumption rate :
Inventory Holding Balance Average Stay =
(Opening Balance + Total Receipt) . ………… . . [2]
Consumption Rate = Total Period Duration Total Issue Quantity ……… [2]
In the early stages carried out the classification of goods in the warehouse by the speed of turnover of goods. In principle all items will be calculated consumption rate and average stay of goods in the warehouse. Calculation of any good or average stay consumption rate, the goods will be categorized into the category of fast moving, slow moving, non-moving. After that, it will be concluded through a comparison category of consumption rate and average stay of goods.
was conducted on a 3PL (raw material) and the methods used is the FSN analysis, whereas previous studies carried out in the warehouse of a manufacturing plant (finished goods) and the methods used ABC Analysis.
2.3 Cycle Counting
Cycle counting is a method used to monitor the presence of the goods in the warehouse in order to maintain accuracy. This action is an attempt to minimize the occurrence of shrinkage. This method uses a technique by dividing inventory into several sections in the activities of a stock take[1].
Here are the steps to do perform the calculation method of cycle counting: 1. Perform product classification.
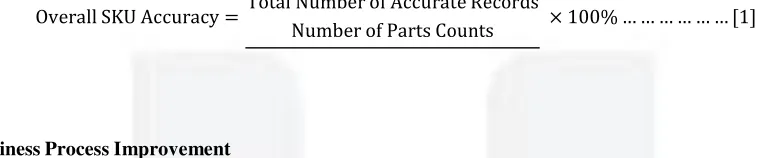
Inventory accuracy record is a record that indicates the value of the accuracy of the goods stored in a warehouse. Inventory record accuracy is usually expressed as a percentage in the form of the results of the comparison calculation results of physical of goods in a warehouse with the existence of goods in the system.
Overall SKU Accuracy = Total Number of Accurate RecordsNumber of Parts Counts × 100% ……… [1]
2.5 Business Process Improvement
Business Process Improvement (BPI) is a method used by an organization or company to make changes that can improve its business processes. BPI provide a system that will assist in the process of simplification (streamlining) of business processes, to provide assurance that internal and external customers of the organization or company will get a much better output than ever before[3].
3. Discussion
3.1 FSN Analysis
FSN analysis is used to find out the fast moving, slow moving, and non-moving items in a store department. By doing FSN analysis materials can be classified based on their movement from inventory for a specified period. Items are classified based on consumption and average stay in the inventory. Higher the stay of item in the inventory, the slower would be the movement of the material. Fast moving will be categorized as F, Slow moving as S, and non-moving as N.
Table 3a. Calculation of Consumption Rate
Number's of SKU's Cons. Rate Percentage Accumulation
Cycle count is a method for monitoring the state of goods in the warehouse in order to maintain the accuracy of the value of goods in the warehouse. PT XYZ policy on monitoring goods does not have basic standard. Here are the steps cycle counting is done on the warehouse PT XYZ with the aim to generate policy proposals improvements stock take. The steps calculation is as follows[4]:
1. The first step is to classify the product.
Classification was done previously have been based on the calculation of consumption rate and average stay of goods in the warehouse. Having obtained the results of the calculation of consumption rate and average stay it will be concluded whether the SKU in the category of fast moving, slow-moving or non- moving.
2. Assign numbers of SKU to product classification.
From the results conclusions on a number of 16 SKU of the obtained results of product classification, there are 3 SKU that fall into the category of fast moving, 4 categories classified as slow-moving, and the other 9 are non-moving.
…………[
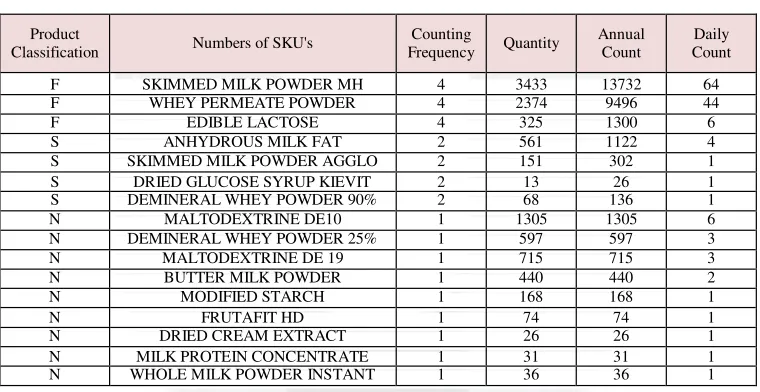
Determination of frequency count for each classification of products is based on a literature with the 4-2-1 rule. (Brooks). In the sense that the SKU that has a faster movement of goods or fast moving action given that more frequent monitoring, and so on. Therefore, the count of the specified frequency is 4 times a year for the category of fast moving, 2 times for slow-moving category, and 1 time for non-moving category. 4. The next step, count of frequency for each SKU multiplied by the number of SKUs per category.
The multiplication aims to determine the total SKUs that will be counted in one year.
5. The next step is the total number of credits that must be calculated is divided by the number of days to do the calculation to obtain the number of SKUs or pallet must be counted in one day.
Results of calculation cycle counting policy as described in the steps above are as follows[1]:
Table 4a. Cycle Counting
Based on the calculation of the 16 SKUs with pallet capacity available then we obtain the average number of SKUs (in pallet) must be calculated every day is 140 pallet
3.3 Stock Take Business Process
The improvement made on the business process stock take is to eliminate some activities that are not value added. Elimination of these activities in line with the reduction of process time to take stock activity. The following is a method of calculating the level of efficiency of business processes[3].
EFICIENCY CYCLE TIME (CE) =
Real Value A dded 3]Table 5. Cycle Time Efficiency
Cycle Time Efficiency RVA BVA NVA CE
Stock Take Existing 11 4 0 73.33% Stock Take Improvement 9 3 0 75.00%
In the existing condition there are 15 activities that consist of real value added activity and business value added activity. After analysis by streamlining the method, there are three activities were eliminated. Elimination activities carried out because such activities are duplicated from the previous activity. The efficiencies gained from the business improvement process to increase to 75%.
3.4 Cost of Stock Take Activity
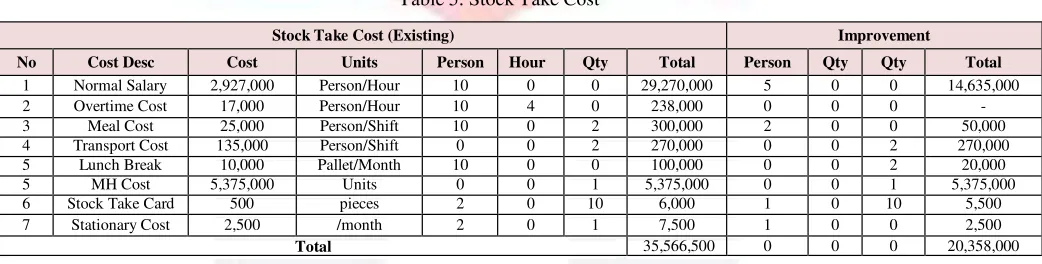
In the implementation of stock take, PT XYZ would cost. Operational costs incurred include the normal salary, overtime cost, MH cost, etc. By doing a stock take policy proposals and efficiency of the business process, the obtained minimizing costs by comparison as follows:
Table 5. Stock Take Cost
Stock Take Cost (Existing) Improvement
No Cost Desc Cost Units Person Hour Qty Total Person Qty Qty Total 1 Normal Salary 2,927,000 Person/Hour 10 0 0 29,270,000 5 0 0 14,635,000
2 Overtime Cost 17,000 Person/Hour 10 4 0 238,000 0 0 0 -
3 Meal Cost 25,000 Person/Shift 10 0 2 300,000 2 0 0 50,000
4 Transport Cost 135,000 Person/Shift 0 0 2 270,000 0 0 2 270,000
5 Lunch Break 10,000 Pallet/Month 10 0 0 100,000 0 0 2 20,000
5 MH Cost 5,375,000 Units 0 0 1 5,375,000 0 0 1 5,375,000
6 Stock Take Card 500 pieces 2 0 10 6,000 1 0 10 5,500
7 Stationary Cost 2,500 /month 2 0 1 7,500 1 0 0 2,500
Total 35,566,500 0 0 0 20,358,000
The difference in the cost of stock take reached 42.76%. Stock take cost existing was Rp 35.566.500 while achieving improvement Rp.20.358.000.
4. Conclusion
Results from this study in accordance with the purpose of the research that has been previously established as follows: if the proposal is implemented the policy stock take these activities can reduce costs up to Rp.15.208.500 stock take activity. Application of the method 4-2-1 influential cycle count against the number of items that need to be calculated per day. Every day there are only 140 pallet to be calculated. In terms of time, by eliminating some activities, time efficiency reaches 26.95% of the existing circumstances.
5. Reference
[1] R. B. Brooks and L. Willson, Inventory Record Accuracy Unleashing The Power Of Cycle Counting Second Edition, New Jersey: Jhon & Wiley Son, Inc, 2007.
[2] Chitale, A. (2011). Materials Management. India: Prentice-Hall of India.
[3] Harrington, D. (1991). Business process improvement Workbook. New York: The McGraw-hill Companies,Inc.