46 CHAPTER IV
FINDING OF THE RESEARCH
This chapter describes the obtained data to answer the statements of the problem in the first chapter. The data is obtained to fulfil the objectives of this research i.e. to find out whether or not there is any significant difference between the writing ability of the eighth grade students of SMP 3 Jekulo Kudus in academic year 2013/2014 before and after being taught by using Cluster Diagramming. It discusses two main cases i.e. the data description that describes the required data of the writing ability of the eighth grade students of SMP 3 Jekulo Kudus in academic year 2013/2014 before and after being taught by using Cluster Diagramming, and the hypothesis testing which clarifies the result of the calculation whether the hypothesis is confirmed or denied.
4.1 The Writing Ability of the Eighth Grade Students of SMP 3 Jekulo Kudus in Academic Year 2013/2014beforeBeing Taught by Cluster Diagramming
students are asked to compose a recount text based on some situations given. I emphasize on recount text because I have to make connection with the syllabus so that my research will support and not go beyond the school’s curriculum.
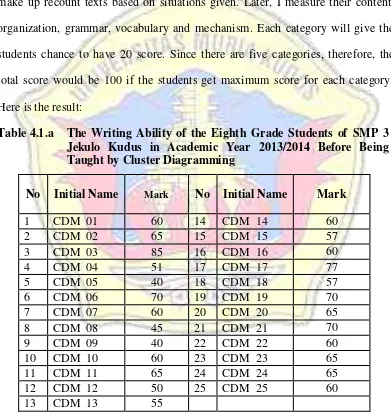
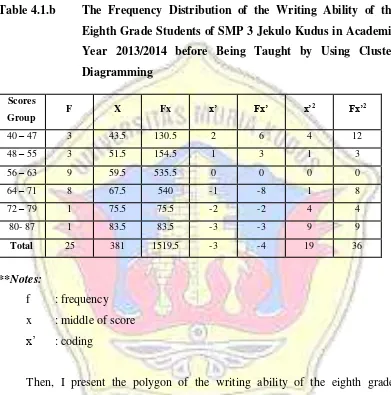
Based on Table 4.1.a the results of the pre test are: the minimum score is 40, the maximum score is 85. Then, I make the score of writing above into the table of frequency as follows:
Table 4.1.b The Frequency Distribution of the Writing Ability of the Eighth Grade Students of SMP 3 Jekulo Kudus in Academic Year 2013/2014 before Being Taught by Using Cluster Diagramming
Scores
Group F X Fx x’ Fx’ x’
2 Fx’2
40 – 47 3 43.5 130.5 2 6 4 12
48 – 55 3 51.5 154.5 1 3 1 3
56 – 63 9 59.5 535.5 0 0 0 0
64 – 71 8 67.5 540 -1 -8 1 8
72 – 79 1 75.5 75.5 -2 -2 4 4
80- 87 1 83.5 83.5 -3 -3 9 9
Total 25 381 1519.5 -3 -4 19 36
**Notes:
f : frequency x : middle of score x’ : coding
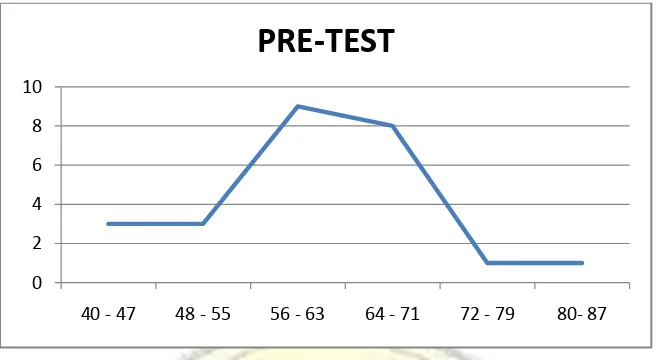
Figure 4.1The Polygon of Frequency Distribution of the Writing Ability of the Eighth Grade Students of SMP 3 Jekulo Kudus in Academic Year 2013/2014 Before Being Taught by Using Cluster Diagramming
Based on the table frequency above, the average score (mean) of the writing ability of the eighth grade students of SMP 3 Jekulo Kudus in academic year 2013/2014taught by using Cluster Diagramming is 60.78. Meanwhile the standard deviation is 9.52. It indicates that the writing ability of the eighth grade students of SMP 3 Jekulo Kudus in academic year 2013/2014taught by using Cluster Diagramming is categorized “sufficient” while the calculation presented in the appendix.
4.2 The Writing Ability of the Eighth Grade Students of SMP 3 Jekulo Kudus in Academic Year 2013/2014 After Being Taught by Cluster Diagramming
Considering the result of the pre-test, I conduct this research in further. I realize that there is a problem that needs to immediately solve. The method used by the teacher, however, becomes the min concern. That is why I feel that it is necessary to use a new brand method to teach writing in a way to give the students a new dimension of how to write an English text, especially recount text. After
0 2 4 6 8 10
having pre-test, the students are taught by using Cluster Diagramming for five meetings. I did Pre-test at first meeting on Wednesday, 5 February 2014. On the second I started to treatment which is start on 6 and on 7 February 2014. February 13 and 14 on 2014, I continued treatment in VIII A. On 18 Febuary 2014, I finished treatment. I did post- test on 19 February 2014.
After getting treatments for six meeting, the teacher gives students a test to measure how far the students improve their writing ability. The test has function to measure the writing ability of the eighth grade students of SMP 3 Jekulo Kudus in academic year 2013/2014 after being taught by using Cluster Diagramming. The post test and the pre-test which is held formerly are alike. The students are asked to compose recount text based on the situation given. All of the students came to the class in that time. Here is the result:
Table 4.2.a The Score of Writing Test of Writing of the Eighth Grade Students of SMP 3 Jekulo Kudus in Academic Year 2013/2014 After Being Taught by Cluster Diagramming
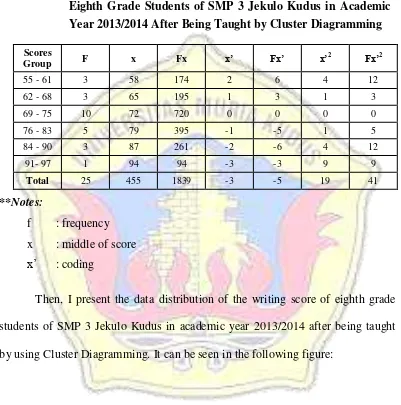
Based on Table 4.2.a the results of the CDM eriment are: the minimum score is 55, the maximum score is 95. Then, I make the table of frequency as follows:
Table 4.2.b The Frequency Distribution of the Writing Ability of the Eighth Grade Students of SMP 3 Jekulo Kudus in Academic Year 2013/2014 After Being Taught by Cluster Diagramming
Scores
Group F x Fx x’ Fx’ x’
2 Fx’2
55 - 61 3 58 174 2 6 4 12
62 - 68 3 65 195 1 3 1 3
69 - 75 10 72 720 0 0 0 0
76 - 83 5 79 395 -1 -5 1 5
84 - 90 3 87 261 -2 -6 4 12
91- 97 1 94 94 -3 -3 9 9
Total 25 455 1839 -3 -5 19 41
**Notes:
f : frequency x : middle of score x’ : coding
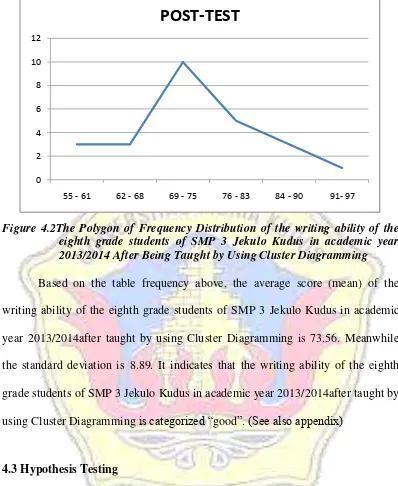
Figure 4.2The Polygon of Frequency Distribution of the writing ability of the eighth grade students of SMP 3 Jekulo Kudus in academic year 2013/2014 After Being Taught by Using Cluster Diagramming
Based on the table frequency above, the average score (mean) of the writing ability of the eighth grade students of SMP 3 Jekulo Kudus in academic year 2013/2014after taught by using Cluster Diagramming is 73.56. Meanwhile the standard deviation is 8.89. It indicates that the writing ability of the eighth grade students of SMP 3 Jekulo Kudus in academic year 2013/2014after taught by using Cluster Diagramming is categorized “good”. (See also appendix)
4.3Hypothesis Testing
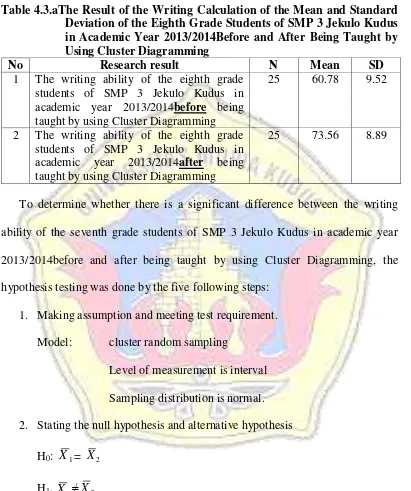
Hypothesis testing is intended to know whether or not there is the difference between the achievement of the writing of the eighth grade students of SMP 3 Jekulo Kudus in academic year 2013/2014before and after being taught by using Cluster Diagramming. To do so, the t-test method is extremely needed to do the analysis. Here is the result of the writing ability of the eighth grade students of
0 2 4 6 8 10 12
55 - 61 62 - 68 69 - 75 76 - 83 84 - 90 91- 97
SMP 3 JekuloKudus in academic year 2013/2014 before and after being taught by using Cluster Diagramming. It can be seen in the following figure:
Table 4.3.aThe Result of the Writing Calculation of the Mean and Standard Deviation of the Eighth Grade Students of SMP 3 Jekulo Kudus in Academic Year 2013/2014Before and After Being Taught by Using Cluster Diagramming
No Research result N Mean SD
1 The writing ability of the eighth grade students of SMP 3 Jekulo Kudus in academic year 2013/2014before being taught by using Cluster Diagramming
25 60.78 9.52
2 The writing ability of the eighth grade students of SMP 3 Jekulo Kudus in academic year 2013/2014after being taught by using Cluster Diagramming
25 73.56 8.89
To determine whether there is a significant difference between the writing ability of the seventh grade students of SMP 3 Jekulo Kudus in academic year 2013/2014before and after being taught by using Cluster Diagramming, the hypothesis testing was done by the five following steps:
1. Making assumption and meeting test requirement. Model: cluster random sampling
Level of measurement is interval Sampling distribution is normal. 2. Stating the null hypothesis and alternative hypothesis
H0: X1= X2
H0 : “There is no significant difference between the writing ability of the
eighth grade students of SMP 3 Jekulo Kudus in academic year 2013/2014 before and after being taught by using Cluster Diagramming.”
H1 : “There is no significant difference between the writing ability of the
eighth grade students of SMP 3 Jekulo Kudus in academic year 2013/2014 before and after being taught by using Cluster Diagramming.”
3. Selecting the sampling distribution and establishing the critical region. Sampling distribution = t distribution
= .05, two tailed test
df = N – 1 = 25 – 1 = 24 t (critical) = 2.07 4. Computing of the test statistic.
The statistic t is calculated using the following formula:
t =
=
= 11.675. Making decision and interpreting of the results by compare the t (obtained) or to with the t (critical) or t table (tt) in the level of significance
.05and df (N – 1 ) = 24.
a) Accept H0 and reject H1 if t0 does not fall in the critical region.
b) Reject H0 and accept H1 if t0 fall in the critical region.
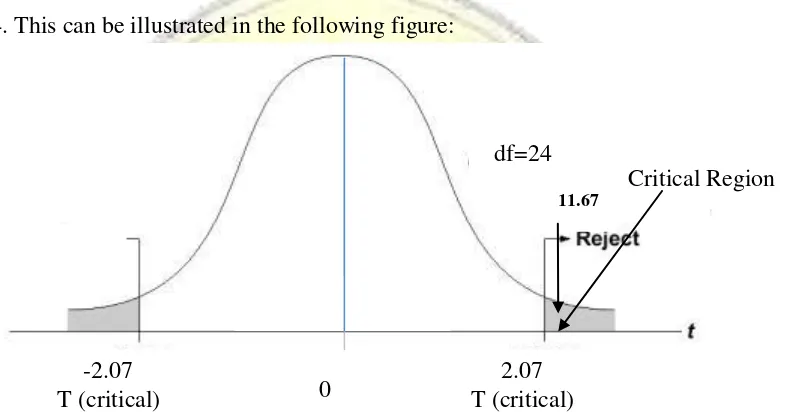
Based on the statistic calculation result in appendix, t (obtained) is 11.67. In the level of significance () 0.05 and the degree of freedom (df) 34, t critical is ±2.04. This can be illustrated in the following figure:
Because t0 falls in the critical region, the H0, which states that, “There is no
significant difference between the writing ability of the eighth grade students of SMP 3 Jekulo Kudus in academic year 2013/2014before and after being taught by using Cluster Diagramming”, is denied. Therefore, the research hypothesis (H1) is
continued, in the word, “There is a significant difference between the writing ability of the eighth grade students of SMP 3 Jekulo Kudus in academic year 2013/2014before and after being taught by using Cluster Diagramming.”
11.67
df=24
Critical Region
-2.07
T (critical) 0
2.07 T (critical)
